
Methods for altering the display of table data suitably for visualization within visible display widths

a table data and display width technology, applied in the field of methods, can solve the problem of not being able to place all of the data in a common row, and achieve the effect of lessening the loss of readability

Inactive Publication Date: 2006-06-01
POLASH PETER
View PDF15 Cites 39 Cited by
  • Summary
  • Abstract
  • Description
  • Claims
  • Application Information

AI Technical Summary

Benefits of technology

"The present invention provides a way to reduce the loss of readability when displaying data on screens with lower resolutions. This is achieved by adapting a technique used in static display layouts to dynamic layout determination. The invention uses a two-dimensional approach to lay out data, where each record's data is placed in a different row and column. The technique retains the visual cues that high-resolution displays offer, such as the consistent horizontal and vertical positions of cells in different records. By doing so, the invention ensures that data from the same record remains contiguous, even if it does not occupy a common row. This helps to provide a visual cue that indicates record membership, even if the data does not occupy a common row. The invention also adapts to different data values, resolutions, and the order of attributes in the data. Overall, the invention reduces the loss of readability caused by resolution reduction."

Problems solved by technology

When resolution is not high enough, on the other hand, placing all of a record's data in a common row is not practical.

Method used


Image

  • Methods for altering the display of table data suitably for visualization within visible display widths
  • Methods for altering the display of table data suitably for visualization within visible display widths
  • Methods for altering the display of table data suitably for visualization within visible display widths

Examples


Embodiment Construction

[0032] Before we describe illustrative embodiments of the invention, we will introduce nomenclature that will be helpful in that description.

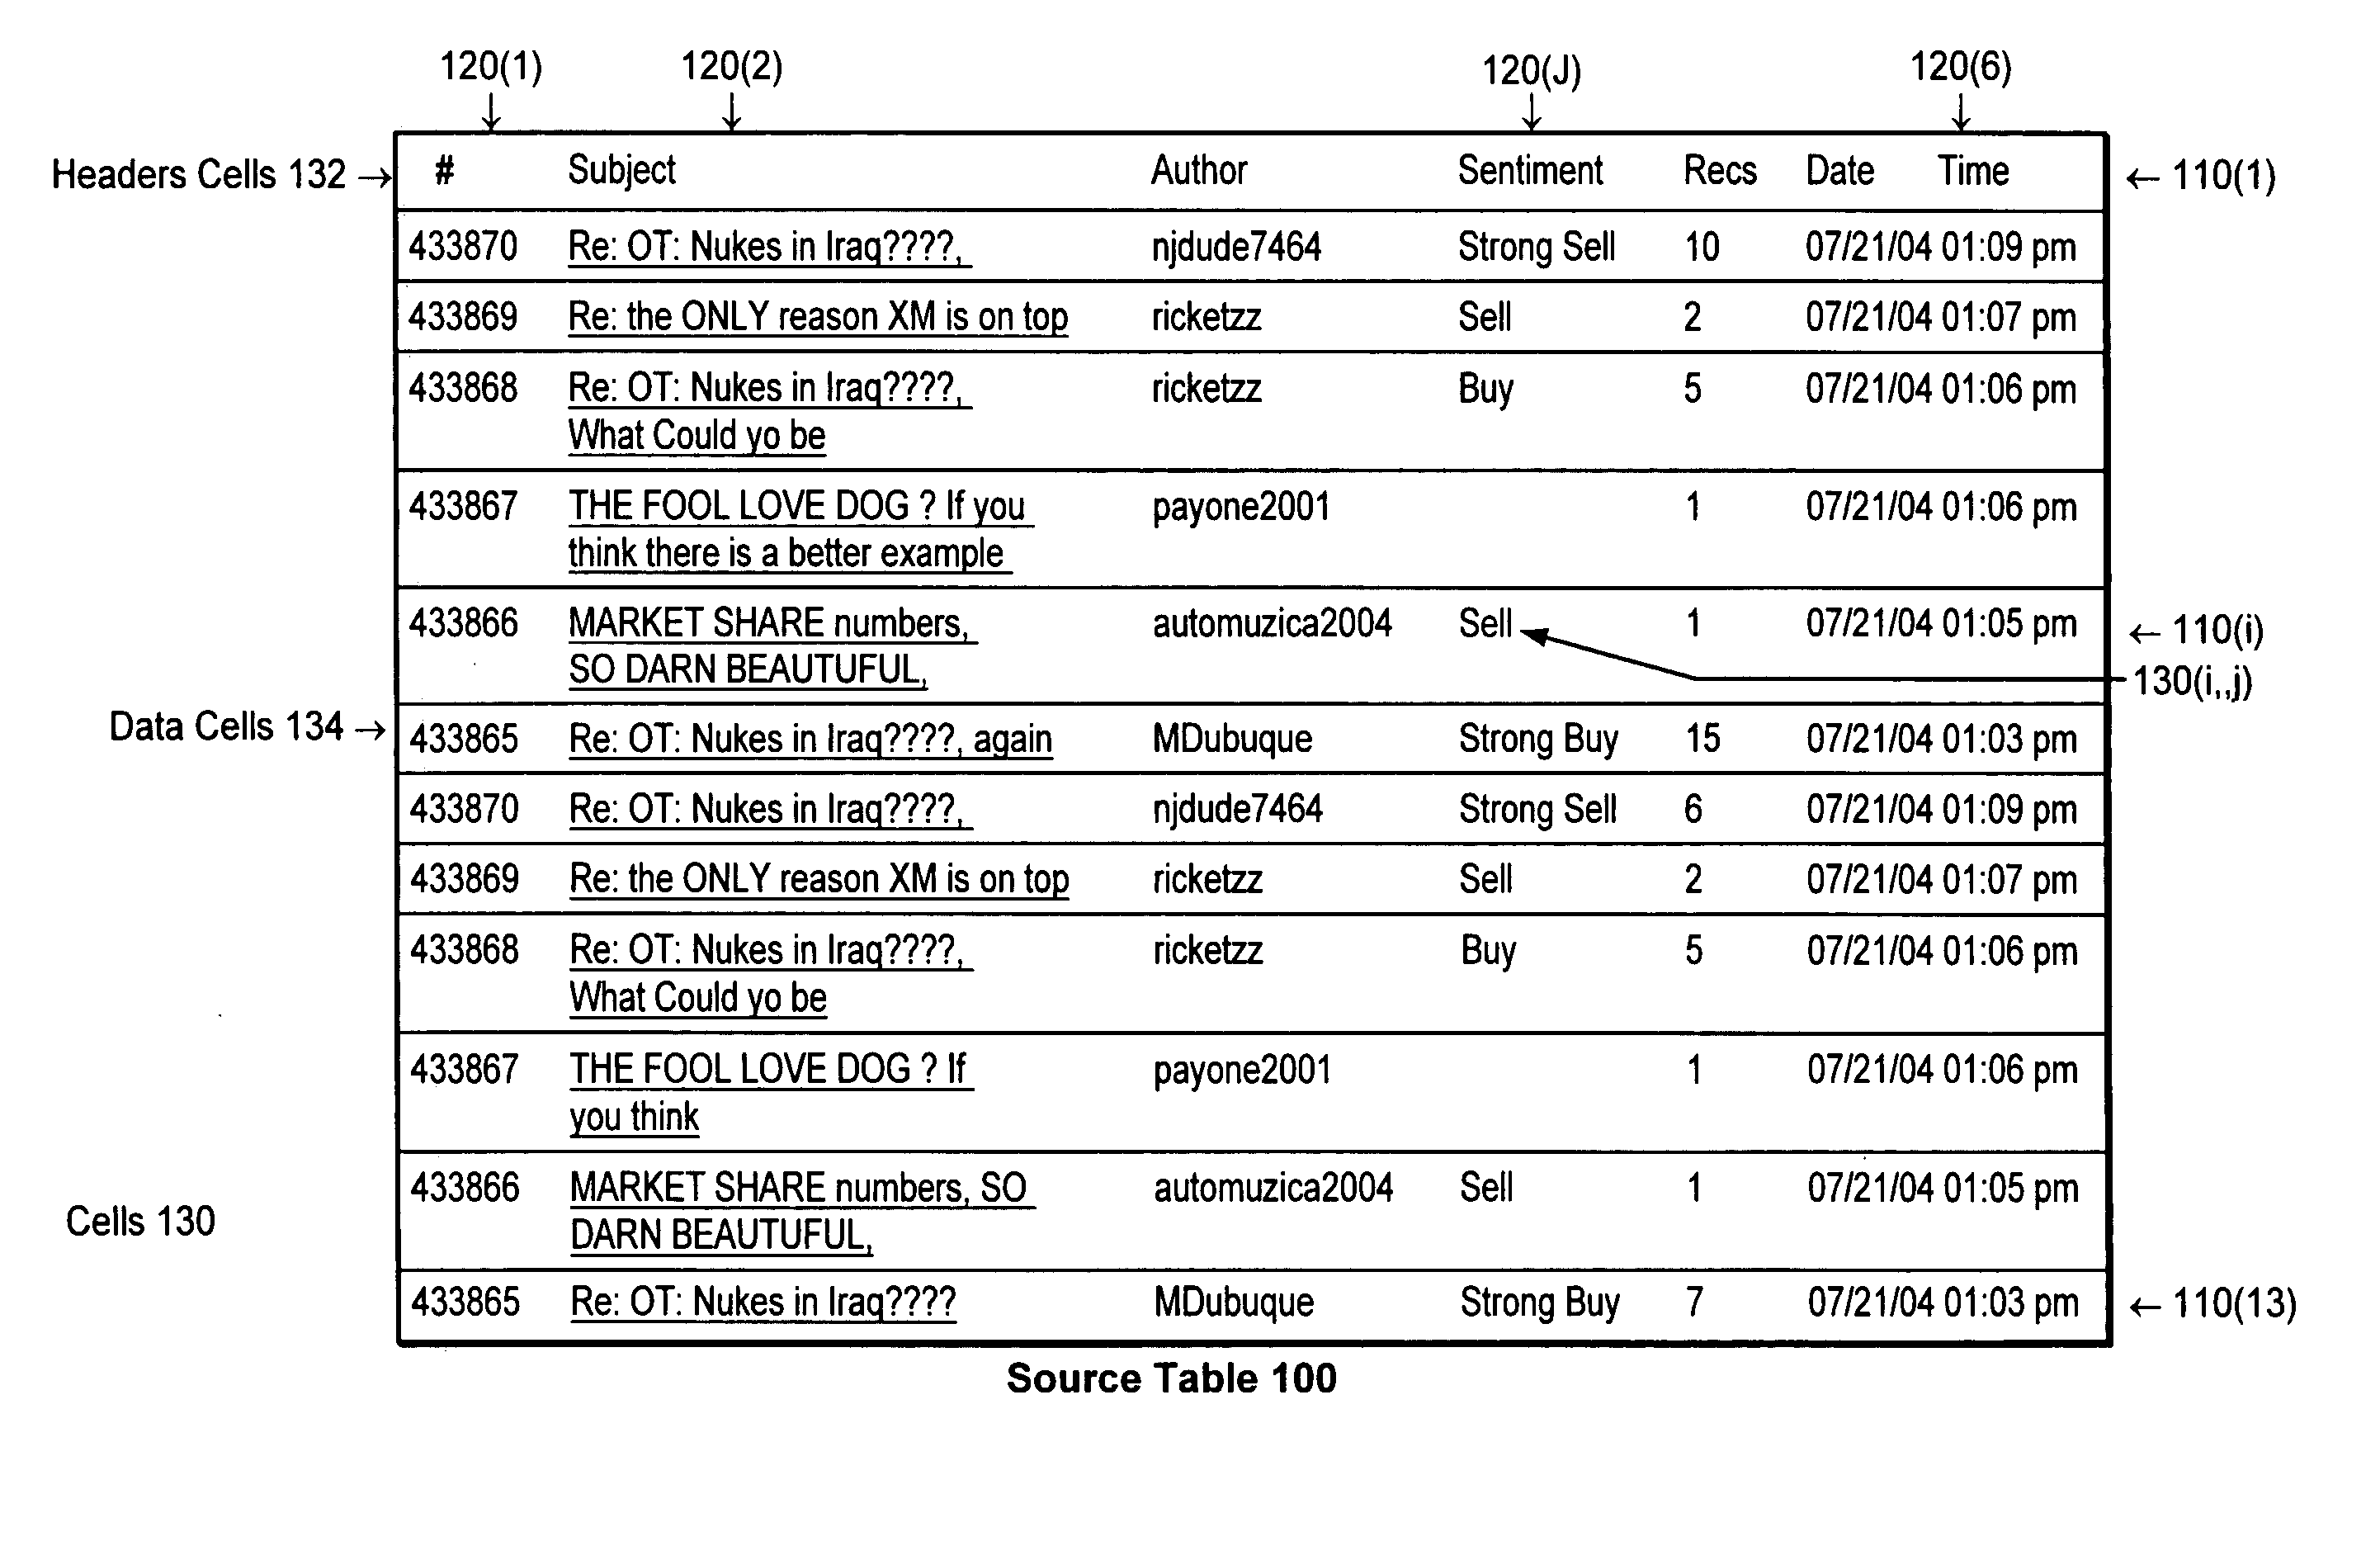
[0033] As used herein, the term source table refers to a collection of data that is stored as a relation that can be presented as a table. Each record in the relation is conventionally displayed as a row of the table. In the rows, contents of fields representing the same attribute are conventionally displayed as a column of the table. Source table also includes any set of computer instructions that specify display data in such rows and columns. The term source row refers to a record in the relation.

[0034] As used herein, the terms reformatted table layout and reformatted table refer to the results of formatting or reformatting a source table that has been formatted or reformatted in accordance with the methods described below. The terms reformatted table layout and reformatted table may also include a set of computer instructions that specify...


PUM


Abstract

Computer-implemented systems and methods are provided for reformatting tabular data based on the known characteristics of a target display device that would otherwise be insufficient in terms of display resolution to retain the visual cues indicating relationships between data items, in a manner that introduces visual and positional consistency for display of such data.

Description

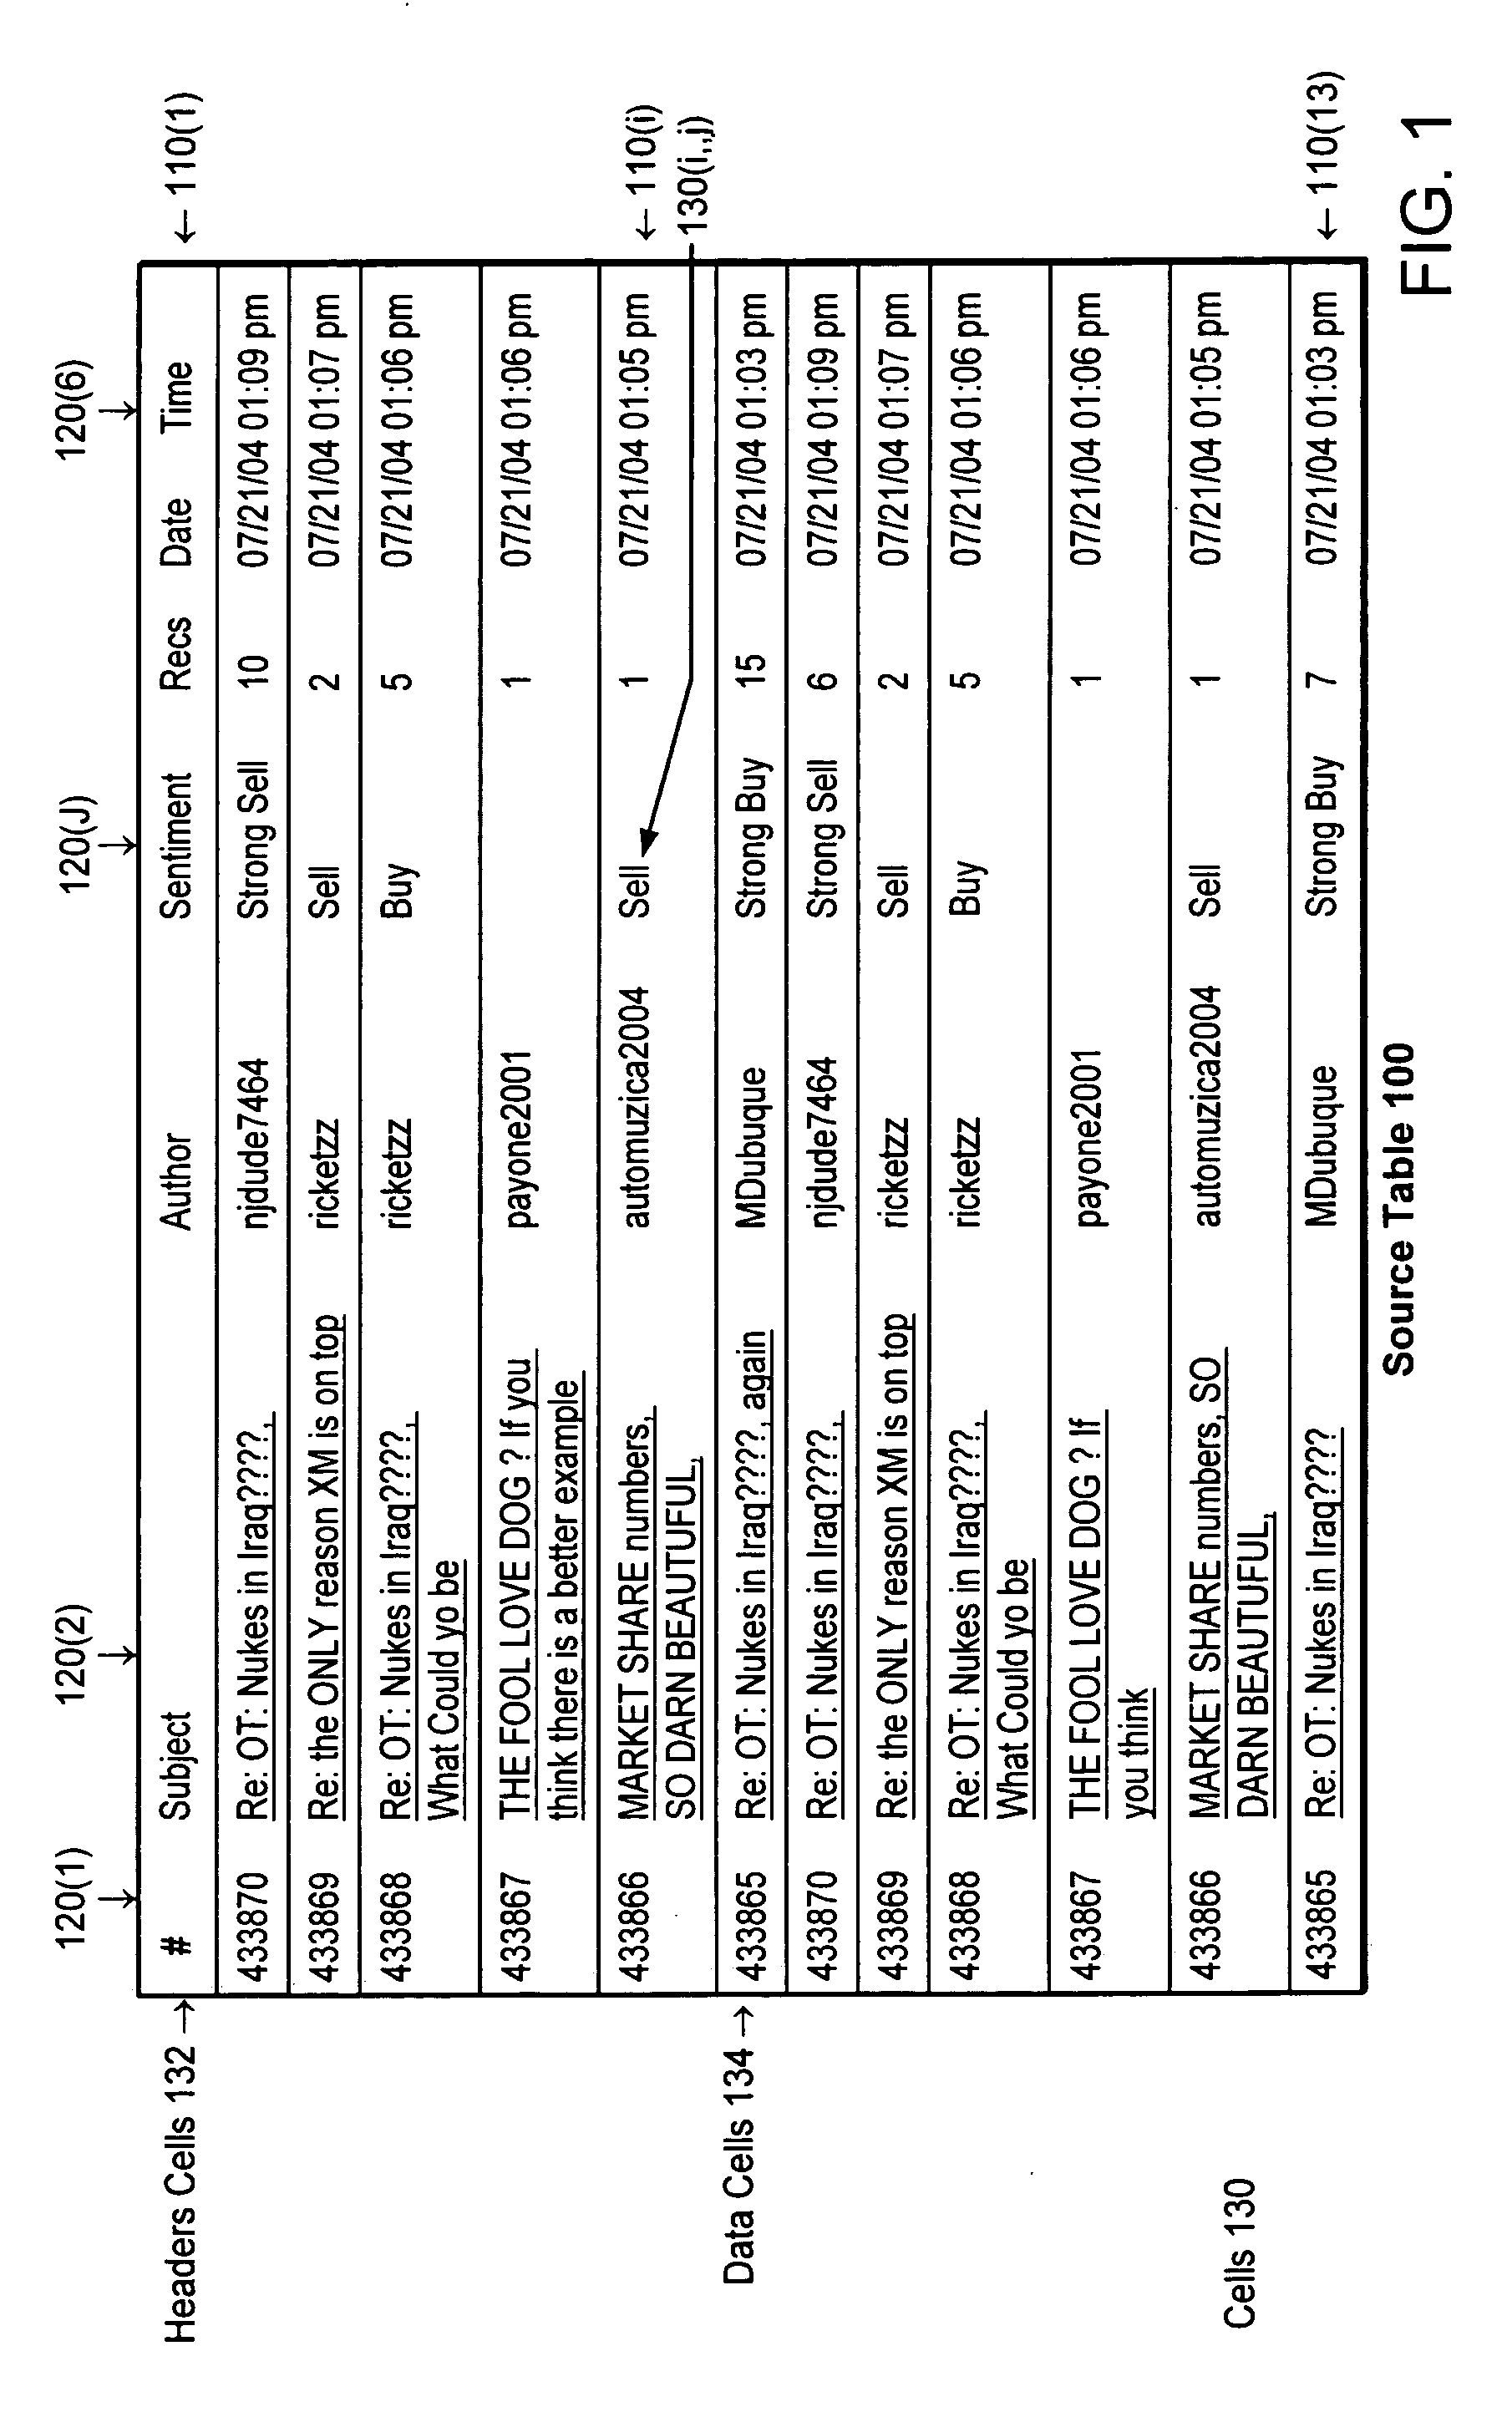
BACKGROUND OF THE INVENTION [0001] 1. Field of the Invention [0002] The present invention is directed to formatting tabular data for display devices or output media. [0003] 2. Background Information [0004] A significant percentage of the pages available for viewing from the Internet and other sources have data arranged in tables. The term table is used here to describe discrete yet related elements of information that are arranged for viewing in rows and columns. An element of data displayed in any specific row and column is called a cell. Among the primary purposes of a typical table arrangement are the following: (1) allow the user to easily identify visual relationships among multiple related data elements and (2) allow the user to infer significance from the relative positions of the data elements. [0005]FIG. 1 shows a typical table data web page as displayed on a full-screen device. [0006] Often, a table will contain more data in each row than can be reasonably displayed in the...

Claims


Application Information

Patent Timeline
Patent Type & Authority Applications(United States)
IPC IPC(8): G06F17/24
CPCG06F17/211G06F40/103
Inventor POLASH, PETER
Owner POLASH PETER
Learn More