Eureka AIR delivers breakthrough ideas for toughest innovation challenges, trusted by R&D personnel around the world.

Graph extraction labelling and visualization

Inactive Publication Date: 2006-08-10
GENERAL ELECTRIC CO
View PDF9 Cites 19 Cited by
  • Summary
  • Abstract
  • Description
  • Claims
  • Application Information

AI Technical Summary

Benefits of technology

[0006] In accordance with another embodiment of the technique, a method includes extracting a planar graph from a n-dimensional data set representing a network relationship. The method also includes performing (n-1)-dimensional connectivity analysis on each of two successive (n-1)-dimensional data sets to generate one or more (n-1)-dimensional labels. The two successive (n-1)-dimensional data sets are extracted from the n-dimensional data set. The method also includes performing n-dimensional connectivity analysis on a portion of the n-dimensional data set comprising the two successive (n-1)-dimensional data sets to generate one or more n-dimensional labels and determining one or more edges and/or vertices of the network relationship based on the one or more n-dimensional labels and corresponding (n-1)-dimensional labels. In certain embodiments, the technique may include systems and computer programs that afford such functionality.
[0007] In accordance with a further embodiment of the present technique, a method is provided for labeling a planar graph. The method includes ini

Problems solved by technology

However, these techniques generally employ a brute force graph search algorithm that may be computationally very intensive even for small graphs.
However, a limitation of such a method requires spatial correspondence between the atlas and the case being compared with.
Thus, a spatial registration is performed between the atlas and the case under comparison that is complex and prone to errors.
The current techniques are therefore cumbersome and inefficient.

Method used


Image

  • Graph extraction labelling and visualization
  • Graph extraction labelling and visualization
  • Graph extraction labelling and visualization

Examples


Embodiment Construction

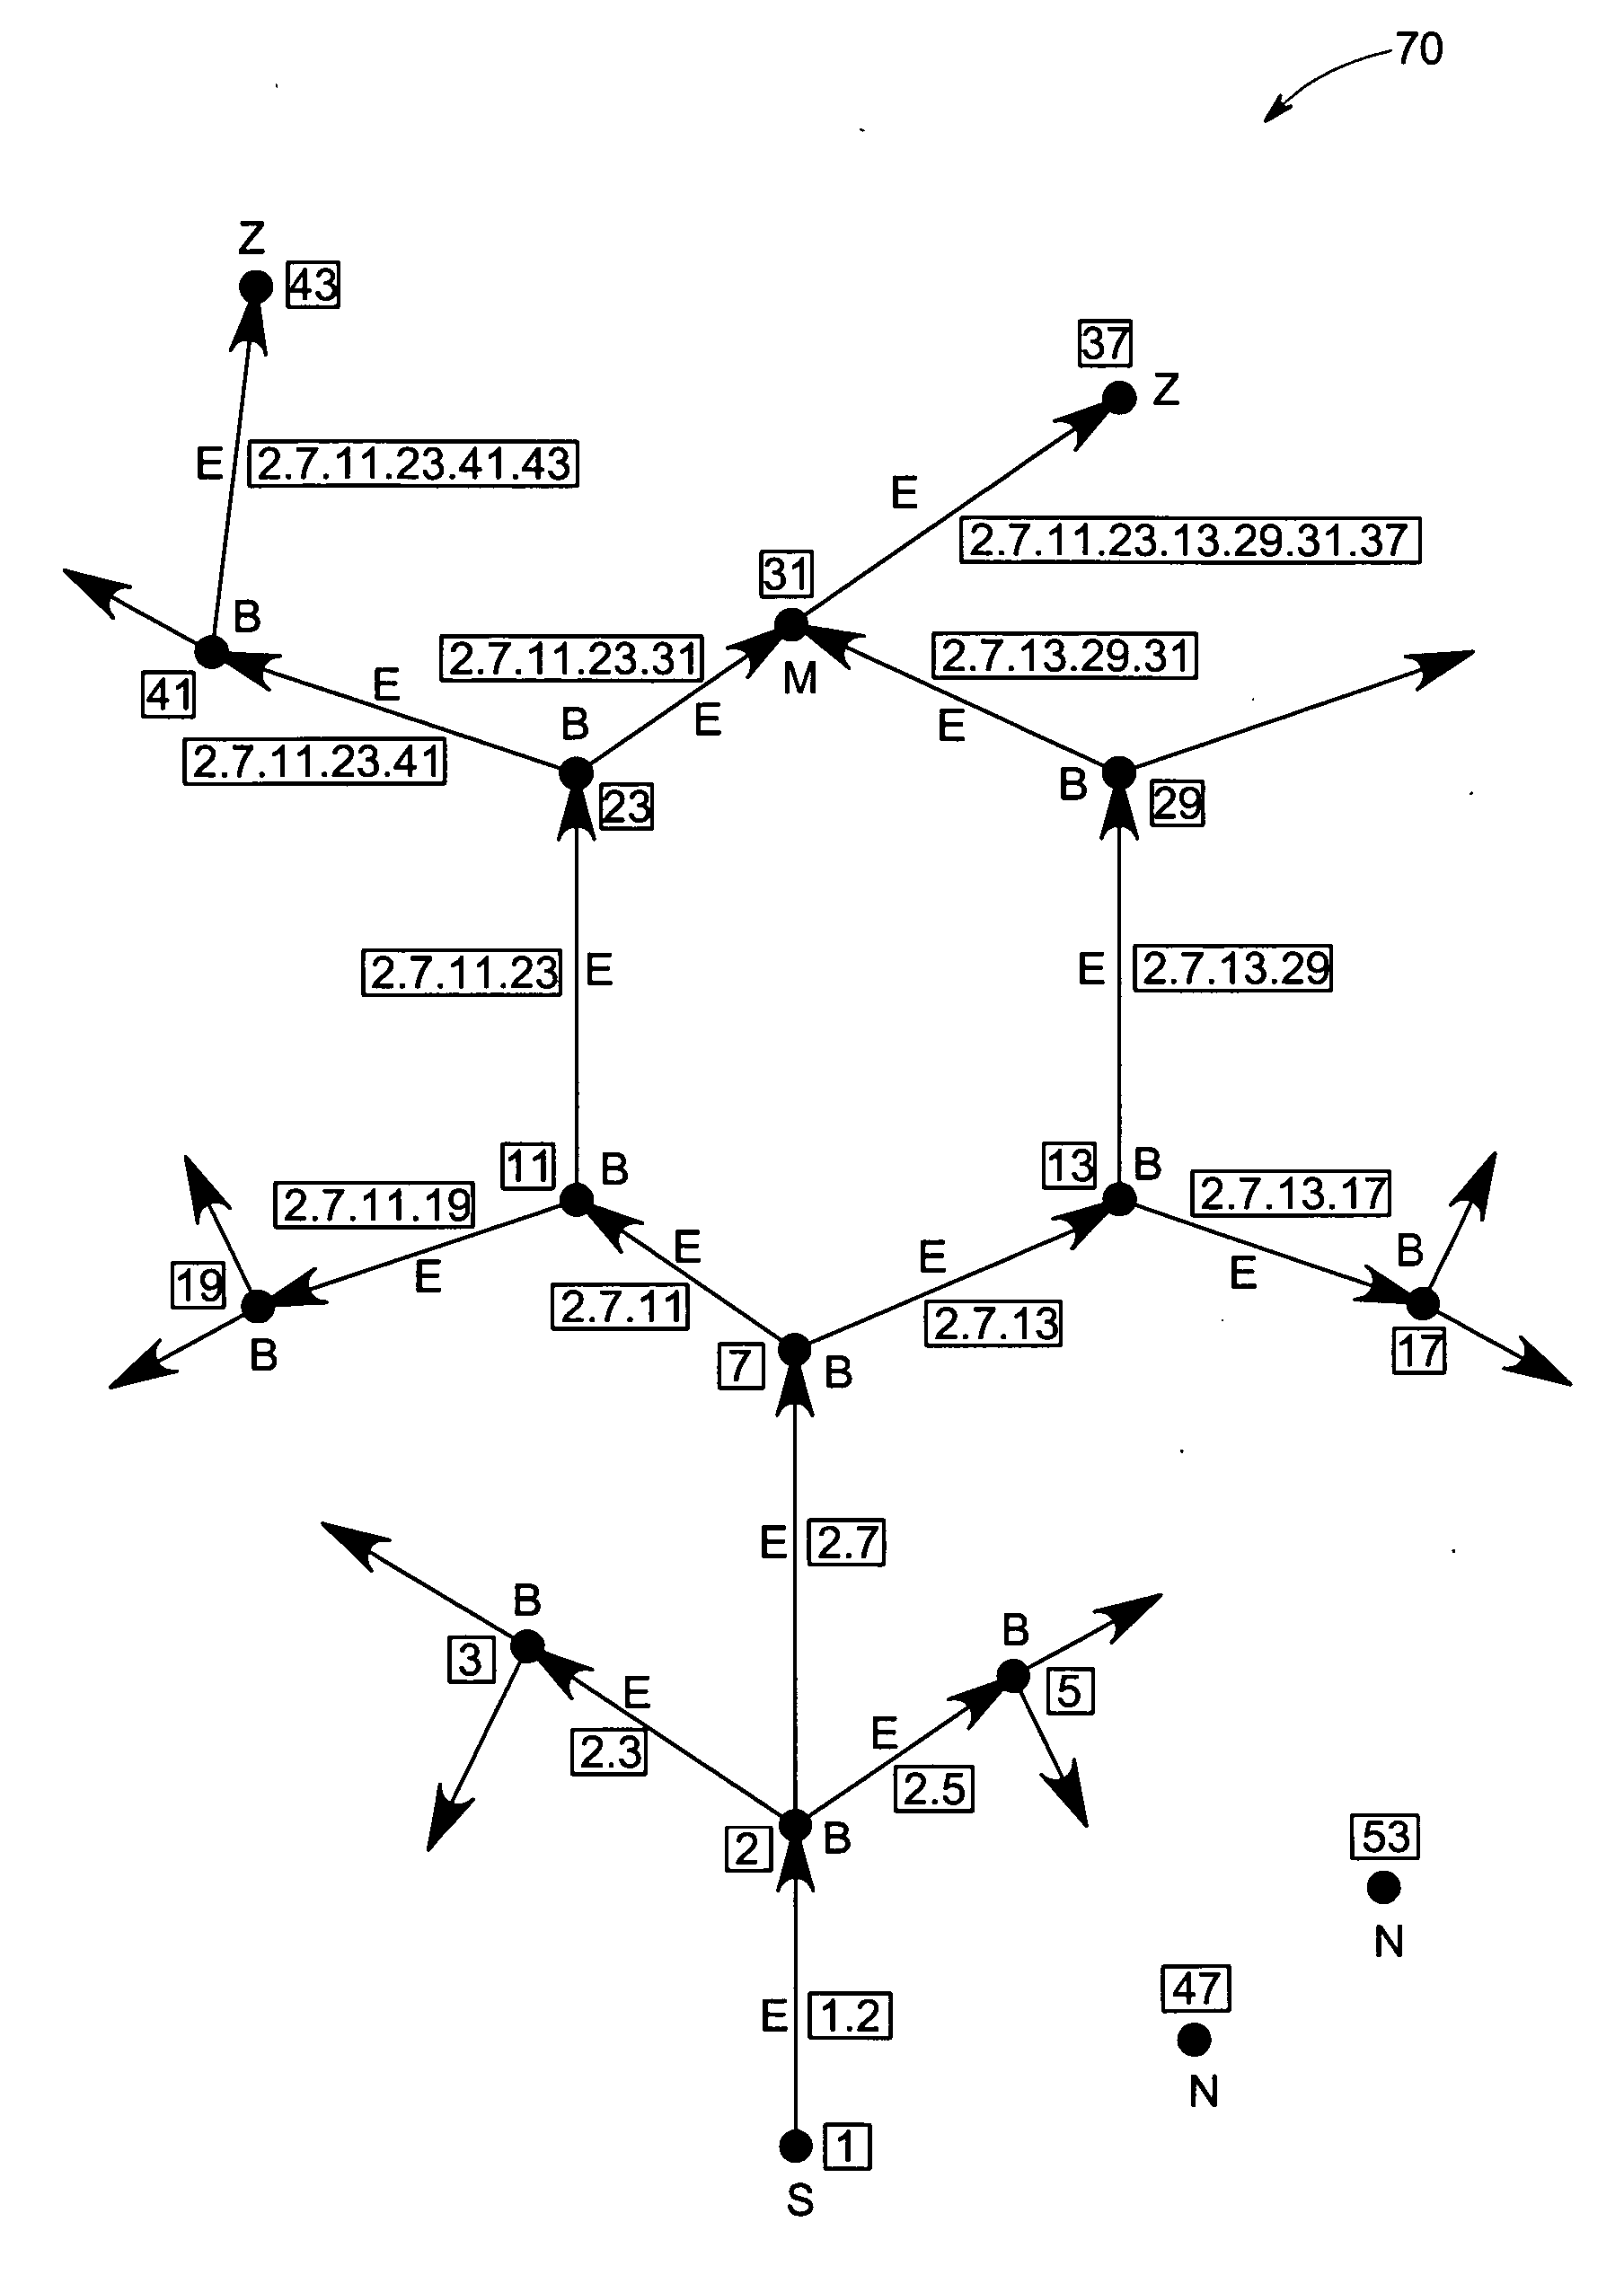
[0031] Embodiments of the present technique are generally directed toward graphical modeling of network relationships based on symbol sequences. These modeling techniques may be useful in a variety of contexts where a network relationship needs to be visualized and / or analyzed via a graphical representation. For example, network relationships include blood vessel networks, biological neural networks, electrical circuit networks, power distribution networks, communication networks, computer networks, transportation networks (e.g., trains, airplanes, automobiles, and boats), flow networks (e.g., sewage, fresh water, oil, gas, or traffic), or any other networks. Although the following discussion is limited to a few examples, a variety of networks and applications are within the scope of the present technique.

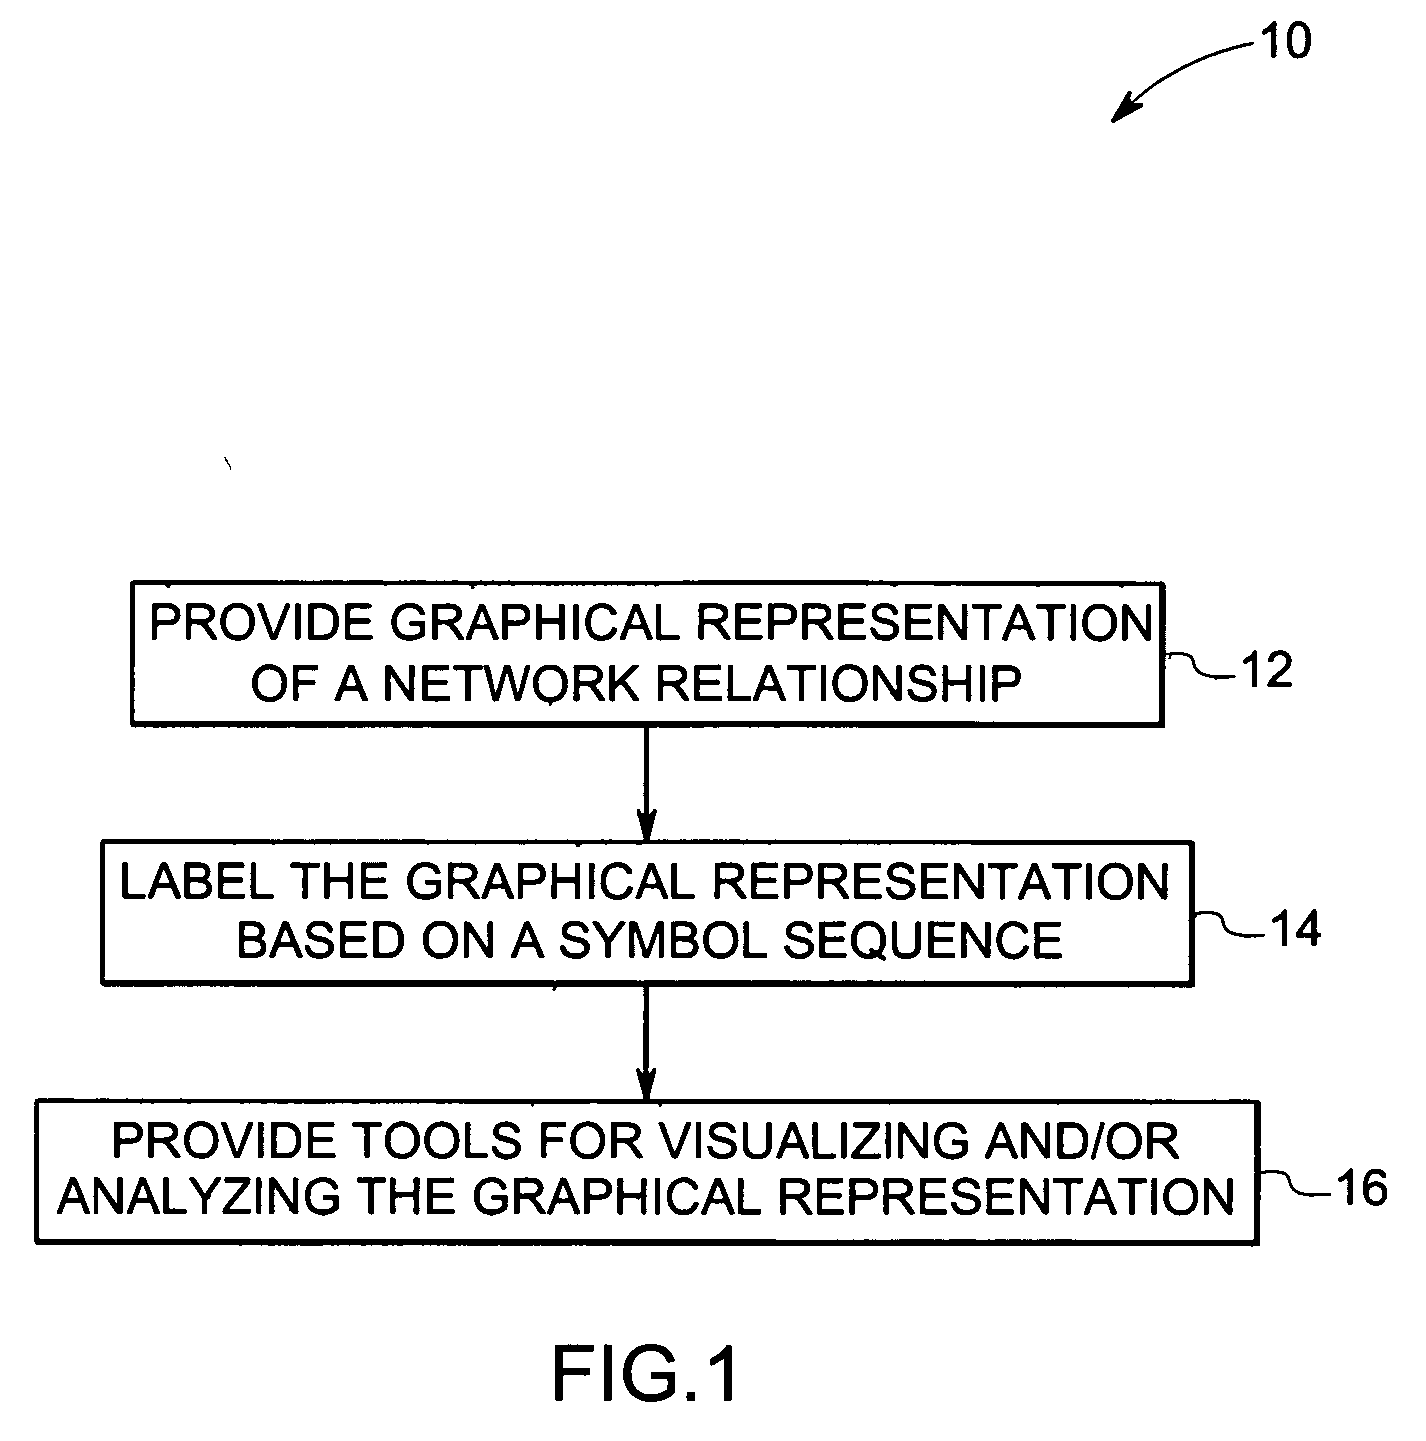
[0032] Referring now to FIG. 1, this figure is a flow chart that illustrates an exemplary process 10 of modeling a network relationship in accordance with one aspect of the presen...


PUM


Abstract

A technique is provided for modeling a network relationship via providing a graphical representation of the network relationship and labeling the graphical representation based on a symbol sequence. Further, one or more tools is provided by the present technique for interactively visualizing and / or analyzing the graphical representation of the network relationship based on the symbol sequence.

Description

BACKGROUND [0001] The invention relates generally to graphical modeling of a network and in particular to graphical modeling of a network based on symbol sequences. [0002] A wide variety of techniques are employed to visualize and / or analyze various network relationship, such as blood vessel networks, neural networks, electrical circuit networks, power system networks, communication networks transport networks or any other network. One of the popular techniques of representing a network relationship is by providing a graphical representation of the network. Though the graphical representation of the network relationship enables visualization of the network relationship and associated problems, the analysis is typically performed manually. [0003] For example, in a medical imaging application, a blood vessel network is manually analyzed to identify potentially life-threatening aneurysms, or to plan surgical operations, or for other purposes. Alternatively, computer implemented techniq...

Claims


Application Information

Patent Timeline
IPC IPC(8): G06T11/20G06V10/426
CPCG06K9/469G06T11/206H04L41/12H04L41/22Y04S40/164Y04S40/00G06V10/426
Inventor NAGARAJ, NITHINSURYANARAYANAN, SRIKANTH
Owner GENERAL ELECTRIC CO
Why Eureka
Eureka Blog
Learn More