

Method for MRI scanning of animals for transmissible spongiform encephalopathies
- Summary
- Abstract
- Description
- Claims
- Application Information
AI Technical Summary
Problems solved by technology
Method used
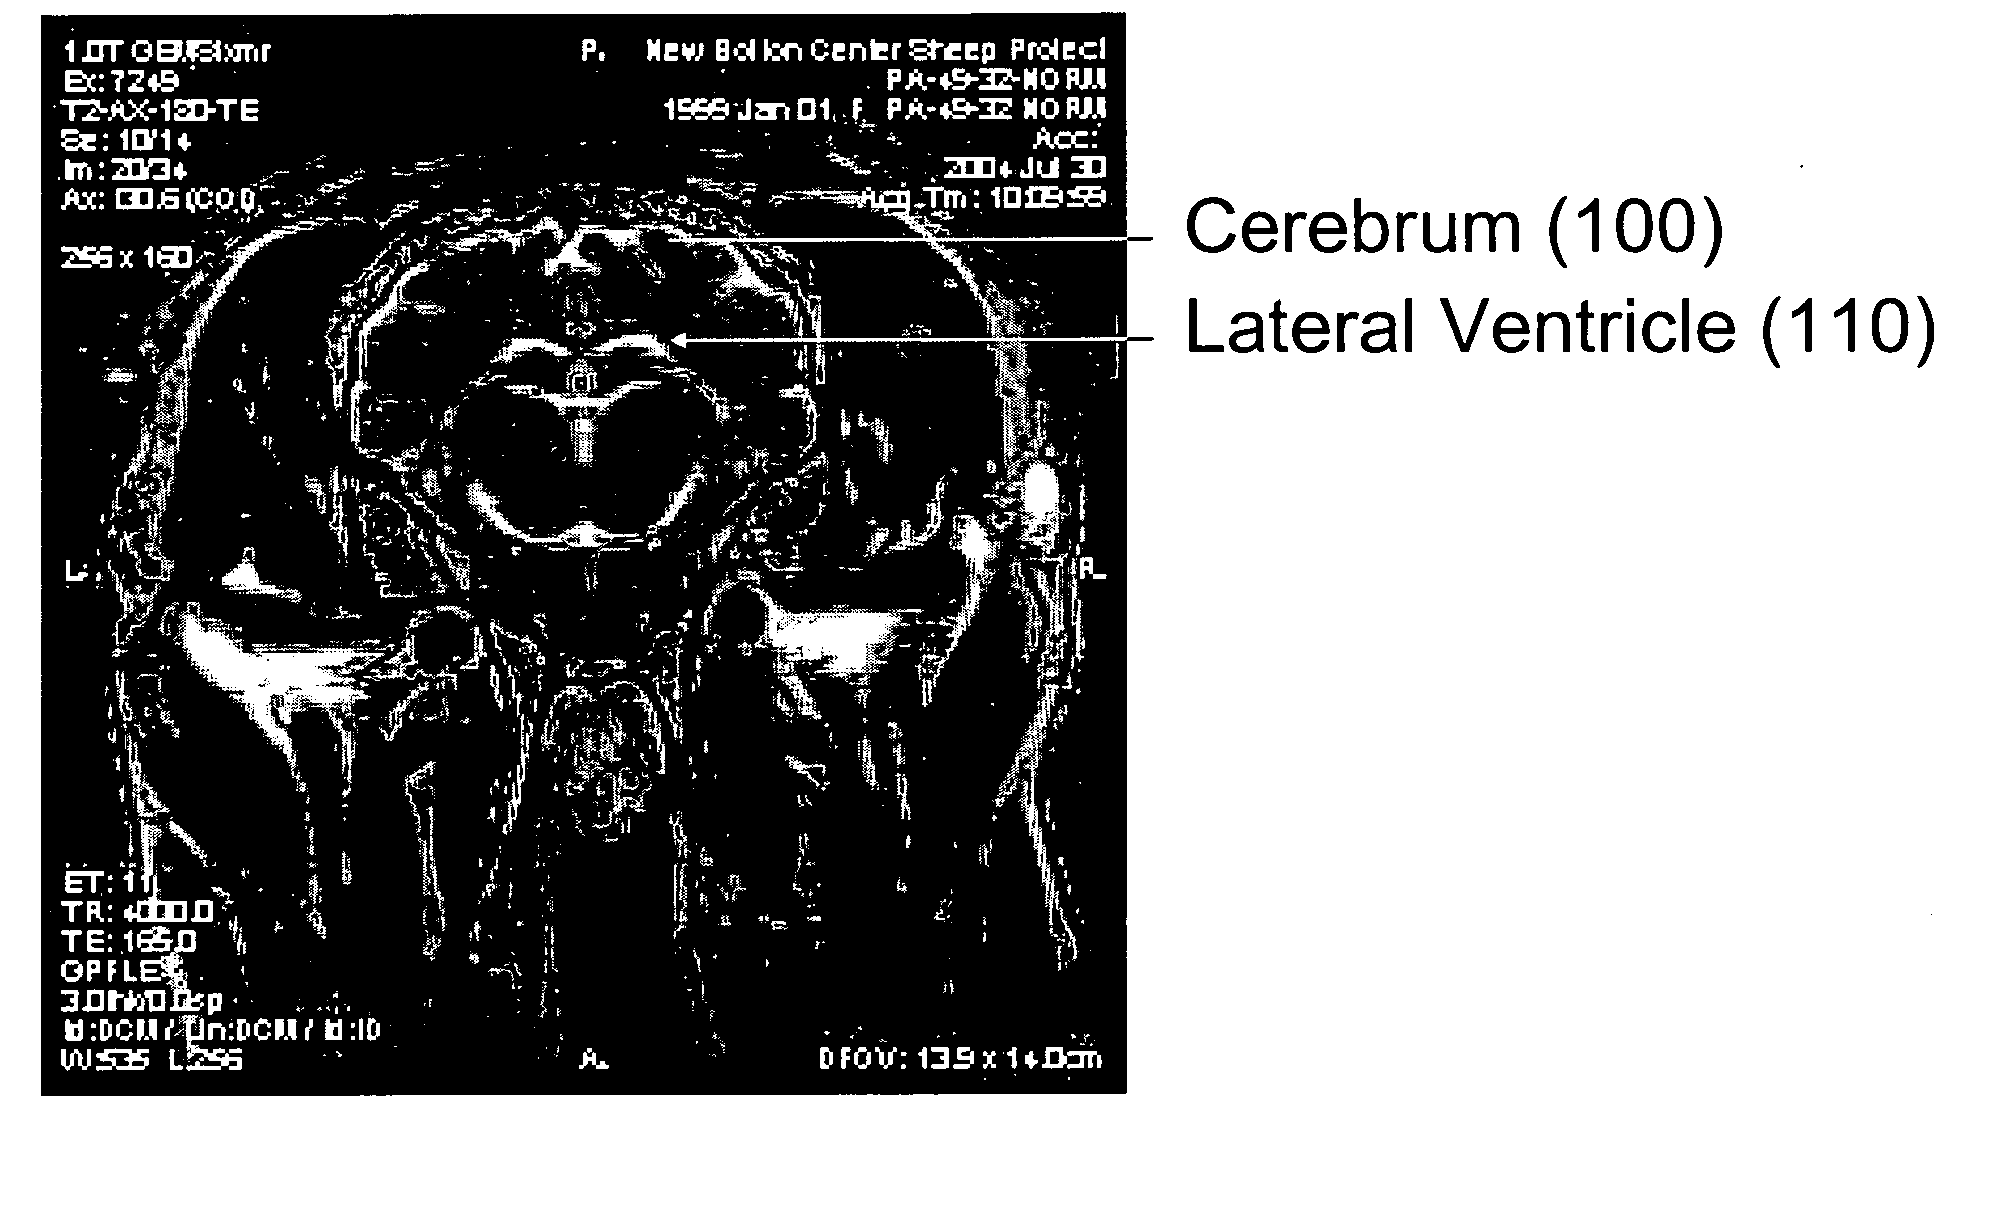
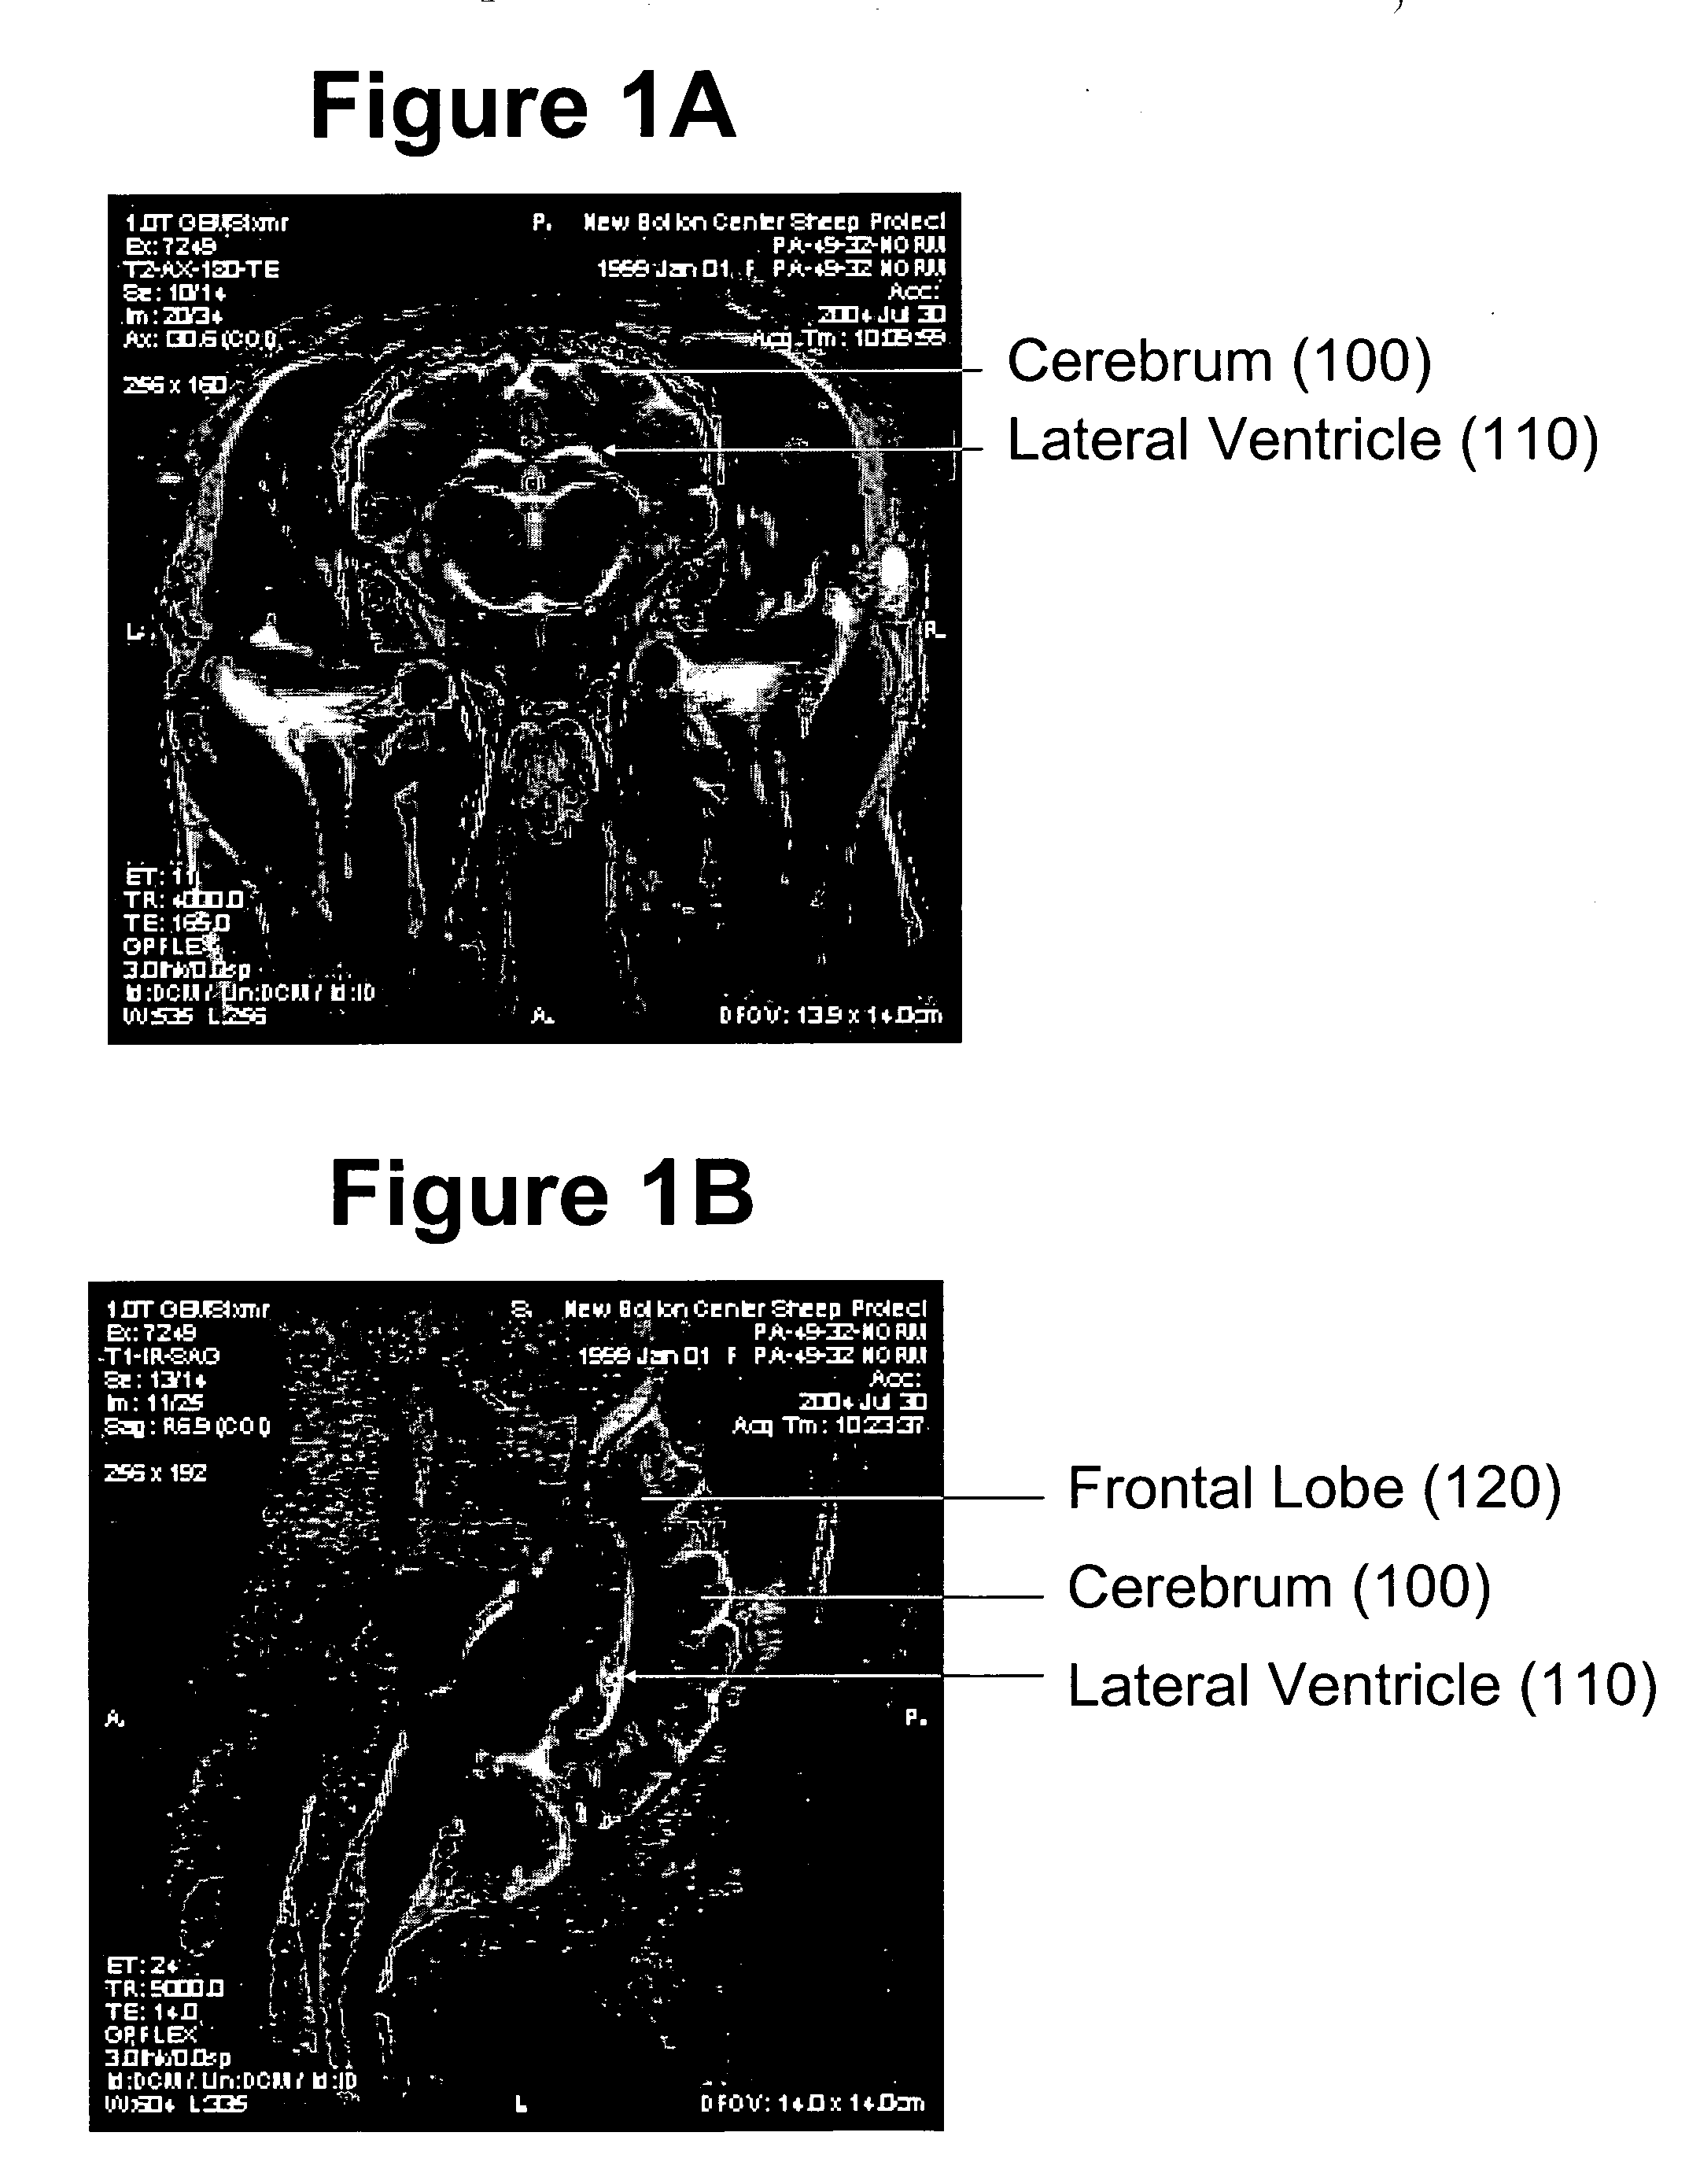
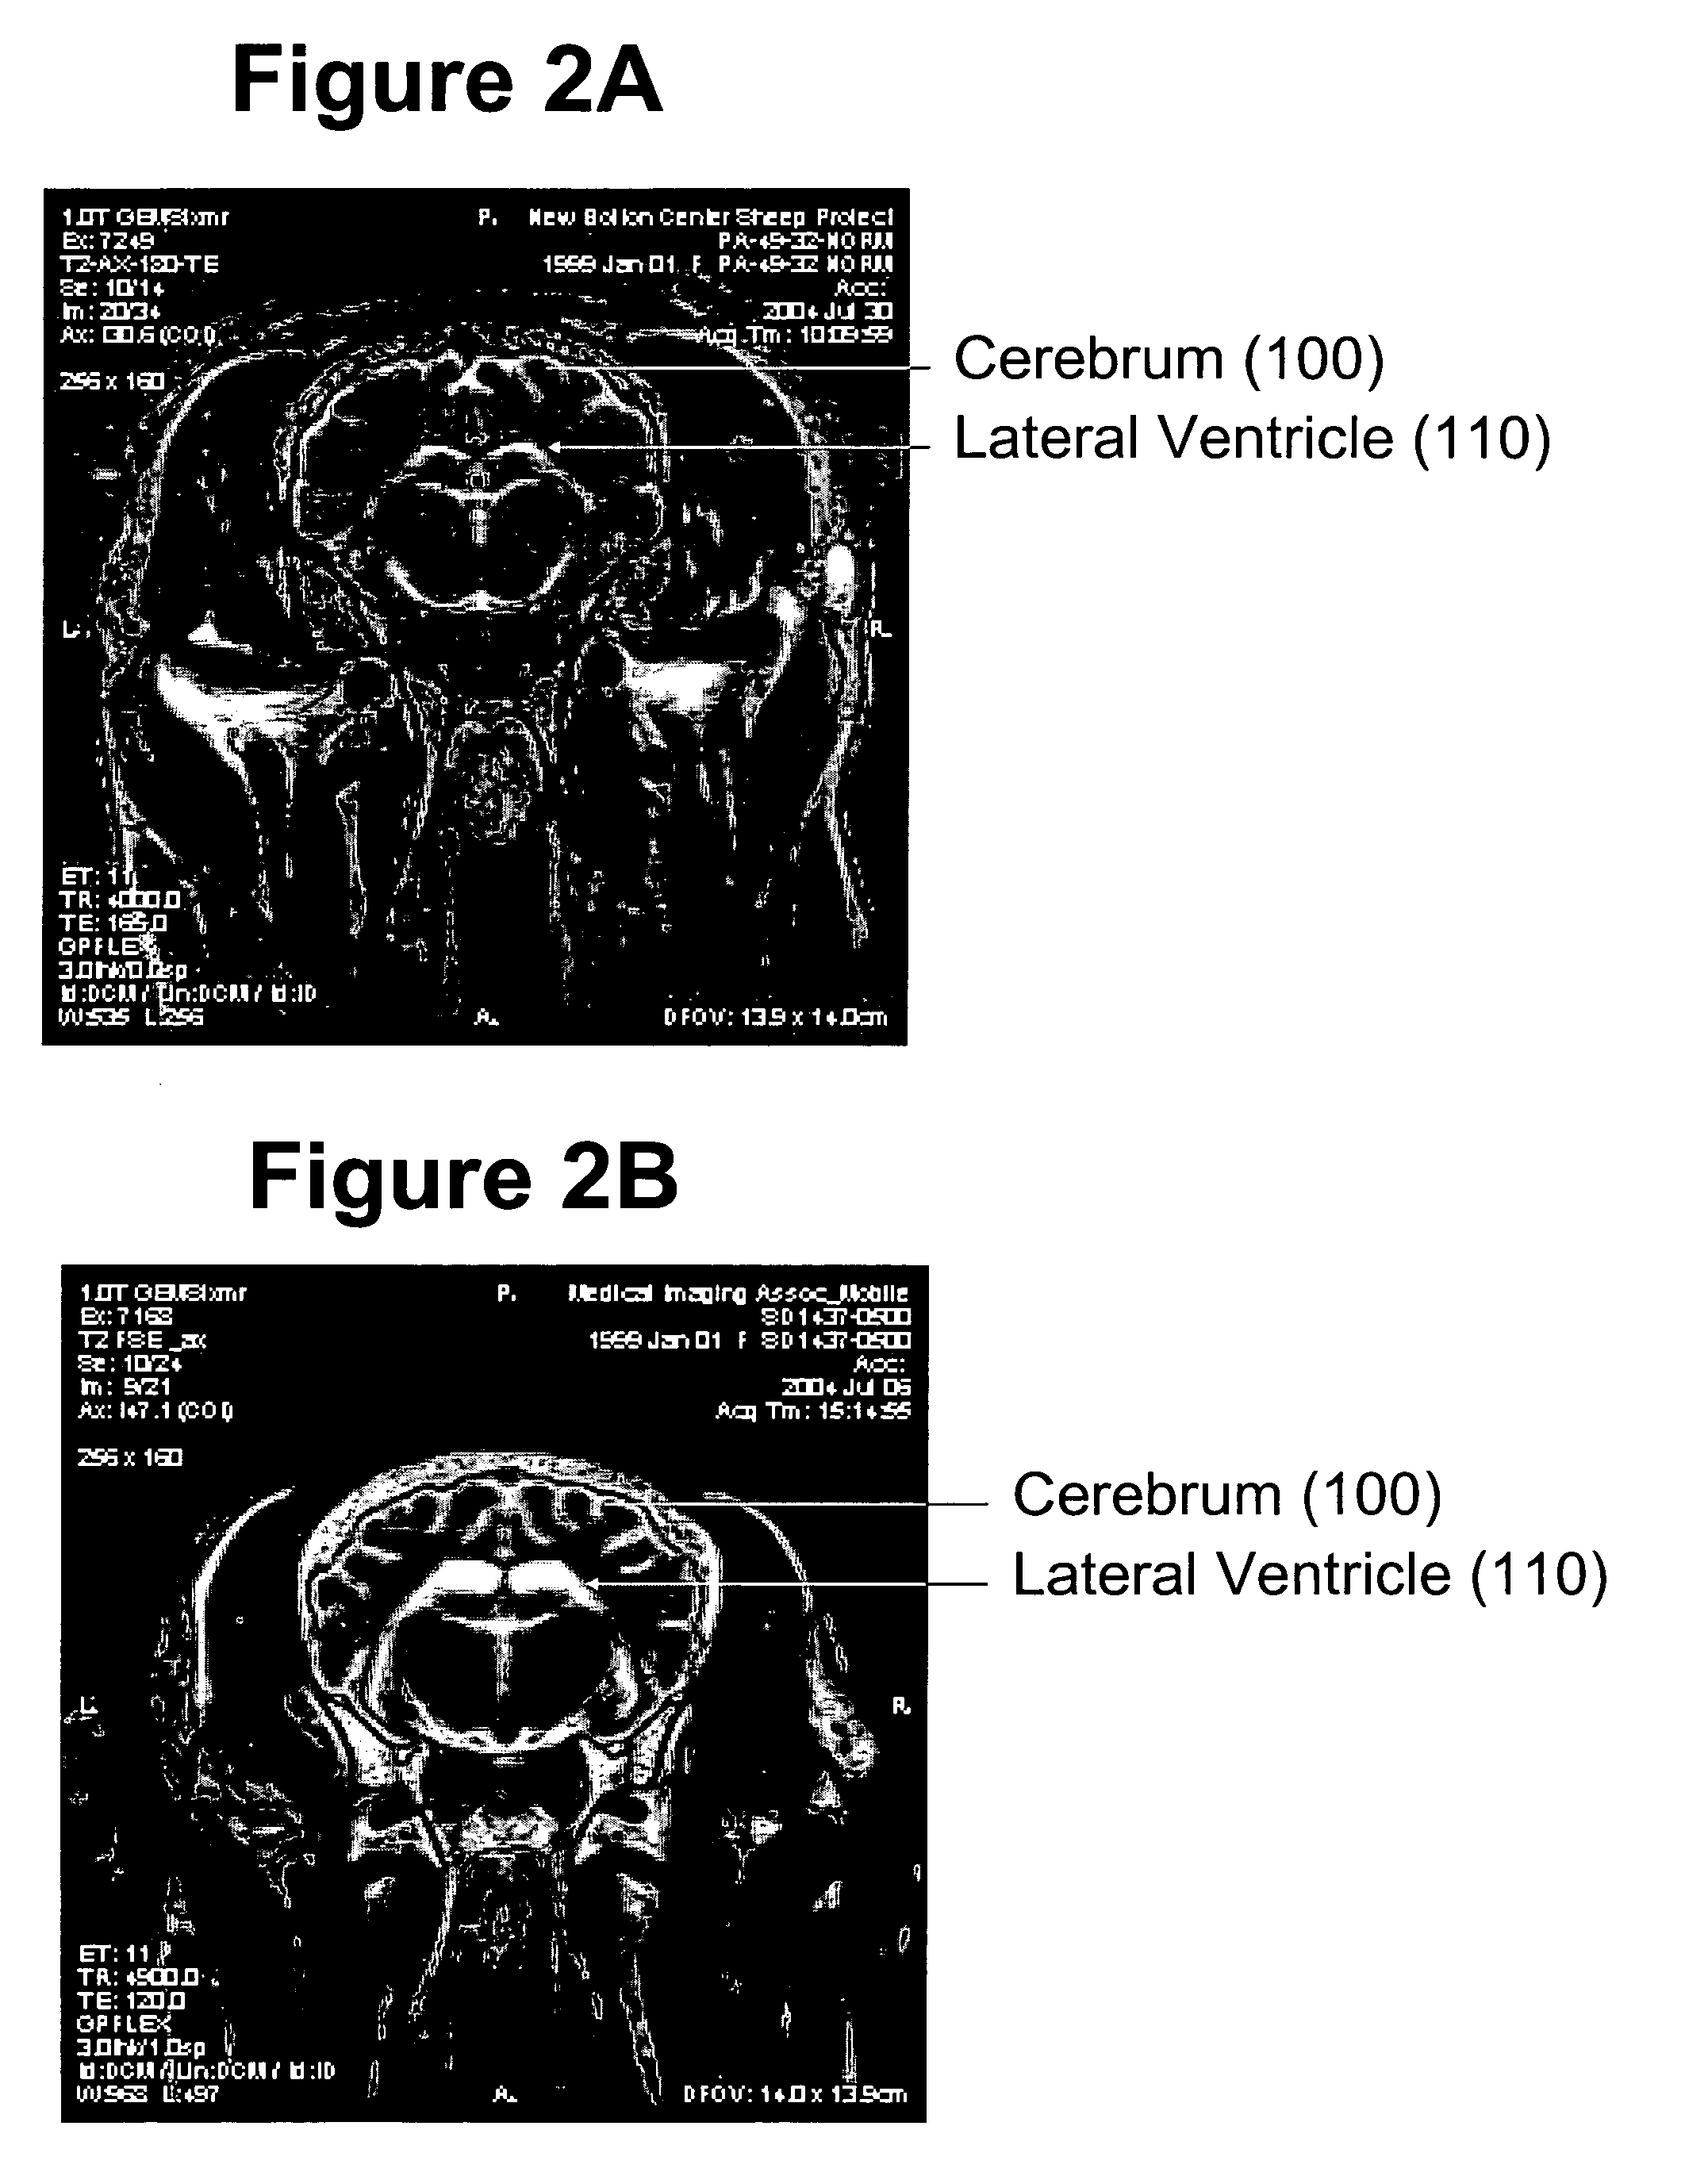
Image

Examples
example 1
Correlation Between MRI Image Ratio of Ventricle Area to Cerebrum Area with Scrapie Assessed by Histology
Histogram of Percent Ventricle Area to Cerebrum Area (FIG. 4A)
[0082]FIG. 4A shows a histogram generated using the methods of the present invention. Specifically, it shows the number of sheep (totaling 120 tested) plotted against the percent ventricle area of cerebrum area in bins of 0.5%. The sheep were scanned using MRI as described above under “MRI scanning.” The best sagittal section (slice) of the brain was selected (the slice where the lateral ventricle extends into the olfactory lobe); and the area of the lateral ventricle and cerebrum were calculated using the methods listed above in “Image analysis.” The ratio of lateral ventricle area to cerebrum area was calculated by dividing the lateral ventricle area by the cerebrum area. The number of sheep with a particular percent ratio value was separated into bins of 0.005. Each sheep was also tested using the IHC tests as de...
example 2
Correlation Between MRI Image Ratio of Ventricle Area to Cerebrum Area with Scrapie Assessed by Histology
Histogram of (Lateral Ventricle Area) / (cerebrum-lateral ventricle area)*100 (FIG. 4B)
[0085]FIG. 4B shows a histogram generated using the methods of the present invention. Specifically, it shows the number of sheep (total 117 tested) plotted against the percent ventricle area of the quantity cerebrum area minus lateral ventricle area in bins of 0.2%. The sheep were scanned using MRI as described above under “MRI scanning.” The best sagittal section (slice) of the brain was selected (the slice where the lateral ventricle extends into the olfactory lobe); and the area of the lateral ventricle and cerebrum were calculated using the methods listed above in “Image analysis.” The ratio was calculated by dividing the lateral ventricle area by the quantity of the cerebrum area minus the lateral ventricle area. This number was then multiplied by 100. The number of sheep with a particula...
example 3
Histogram of Percent Ventricle Area to Frontal Lobe Area. (FIG. 6)
[0088]FIG. 6 shows a histogram generated using the methods of the present invention. Specifically, it shows the number of sheep (totaling 119 tested) plotted against the percent ventricle area of frontal lobe area in bins of 2%. The sheep were scanned using MRI as described above under “MRI scanning.” The best sagittal section (slice) of the brain was selected (the slice where the lateral ventricle extends into the olfactory lobe), and the area of the lateral ventricle and frontal lobe were calculated using the methods listed above in “Image analysis.” The ratio of lateral ventricle area to frontal lobe area was calculated by dividing the lateral ventricle area by the frontal lobe area. The number of sheep with a particular percent ratio value was separated into bins of 2%. Each sheep was also tested using the IHC tests as described above in “Immunohistochemistry (IHC) test” and “Third-Eyelid test.” Each sheep was de...
PUM
 Abstract
Description
Claims
Application Information