
Equipment management system

a technology of equipment management and management system, applied in the direction of electric programme control, total factory control, instruments, etc., can solve the problems of inability to obtain actual processing time and loss time, difficult to continue, and difficult to obtain all data for several hundreds to several thousand manufacturing devices, etc., to achieve efficient calculation and excellent accuracy

Inactive Publication Date: 2008-01-10
RENESAS ELECTRONICS CORP
View PDF3 Cites 25 Cited by
  • Summary
  • Abstract
  • Description
  • Claims
  • Application Information

AI Technical Summary

Benefits of technology

[0013]According to the present invention, OEEs and equipment load factors in the future may be efficiently calculated for a plurality of equipments under operating. That is, the operation statuses of a plurality of equipments under operating may be automatically collected, OEEs in the future may be predicted from the OEEs accumulated in a regular base according to the improvement plan, equipment load factors in the future may be calculated, based on the predicted results, and the above information may be stored to contribute to an equipment infusion plan in the future.
[0015]According to the present invention, there is provided an equipment management system by which an overall equipment efficiency and an equipment load factor in the future for a plurality of equipments under operating may be efficiently calculated with excellent accuracy.

Problems solved by technology

Accordingly, it has been difficult to obtain all data for from several hundreds to several thousands of manufacturing devices.
In the second place, it has been also difficult to continue the operation in which the above measurement is periodically repeated for the long term to obtain up-to-the-minute information at all times. Accordingly, a tendency over time of the actual processing time and the loss time has not been able to be obtained, and a load factor based on an overall equipment efficiency has not been able to be calculated with high accuracy.
However the system according to the conventional technologies described in the above-described patent document has not had a function for the above calculation.
The loss time means eight segment loss time, and includes a scheduled maintenance loss, a failure loss, a changeover, a setup, a test time, an idle time, a speed loss, and a rework loss.

Method used


Image

  • Equipment management system
  • Equipment management system
  • Equipment management system

Examples


example

Example 1

[0104]FIG. 13 is a view showing one example of an OEE trend graph, using the equipment “A” as an example, and OEEs are steadily changed therein. In an example, like this example, in which OEEs are steadily changed, an effect is obtained at once when improvement activity is executed. It is assumed, for example, that an improvement plan is set, based on an ordinary improvement plan table 166 shown in FIG. 6A. That is, there will be explained a case in which an improvement plan is made for the equipment “A” as follows: an improvement completion time (effect contribution time): Aug. 1, 2005, an item to be improved: changeover, an effect: 5% reduction.

[0105]As the changeover is improved on Aug. 1, 2005 with regard to the equipment “A” in this example, an equipment load factor calculating unit 172 calculates an equipment load factor for infusion lots before the date without any changes in the conditions, using an average value of measured values for several months. It is assumed ...

example 2

[0107]Now, there are many cases, in a semiconductor manufacturing equipment, in which the OEE is not always stable, and unstable values are obtained. FIG. 14 is a view showing one example of an OEE trend graph, using the equipment “B” as an example, and OEEs continuously rise therein.

[0108]A batch-filling-rate improvement activity is continuously executed in the equipment “B” as shown in the continuous improvement plan table 168 shown in FIG. 6B. Thereby, speed loss is continuously reduced, and OEE has a upward tendency by the above loss-reduction improvement activity. According to an improvement plan, it is assumed that a target time: Oct. 8, 2005, an item to be improved: speed loss, a limit value: 15%.

[0109]In the above case (or the OEE is in a downward tendency by some causes), there is a case, with regard to the equipment load factor calculating PC 50, in which it is judged that product infusion is impossible though the infusion is possible, or it is mistakenly judged that unnec...

example 3

[0113]FIG. 15 is a view showing one example of an OEE trend graph, using the equipment “C” as an example, and the OEE is suddenly increased or decreased therein. For the equipment “C” having sudden deviation as described above (data on Aug. 15, 2005), the OEE data correction unit 170 calculates an average value, eliminating a point deviated from the management limit value of each loss ratio. The values calculated here are a failure loss ratio: 3%, a rework loss ratio: 18%, and an OEE: 37%. Moreover, as shown in an ordinary improvement plan table 166 shown in FIG. 6A, it is assumed that a plan is made for the equipment “C” as follows: an improvement completion time (effect contribution time): Dec. 31, 2005, an item to be improved: rework loss, an effect: 3% reduction.

[0114]When there were no improvements other than the above-described ones up to Dec. 30, 2005, the conditions are not changed to obtain the following data: a failure loss ratio: 3%, a rework loss ratio: 18%, and OEE: 37%...


PUM


Abstract

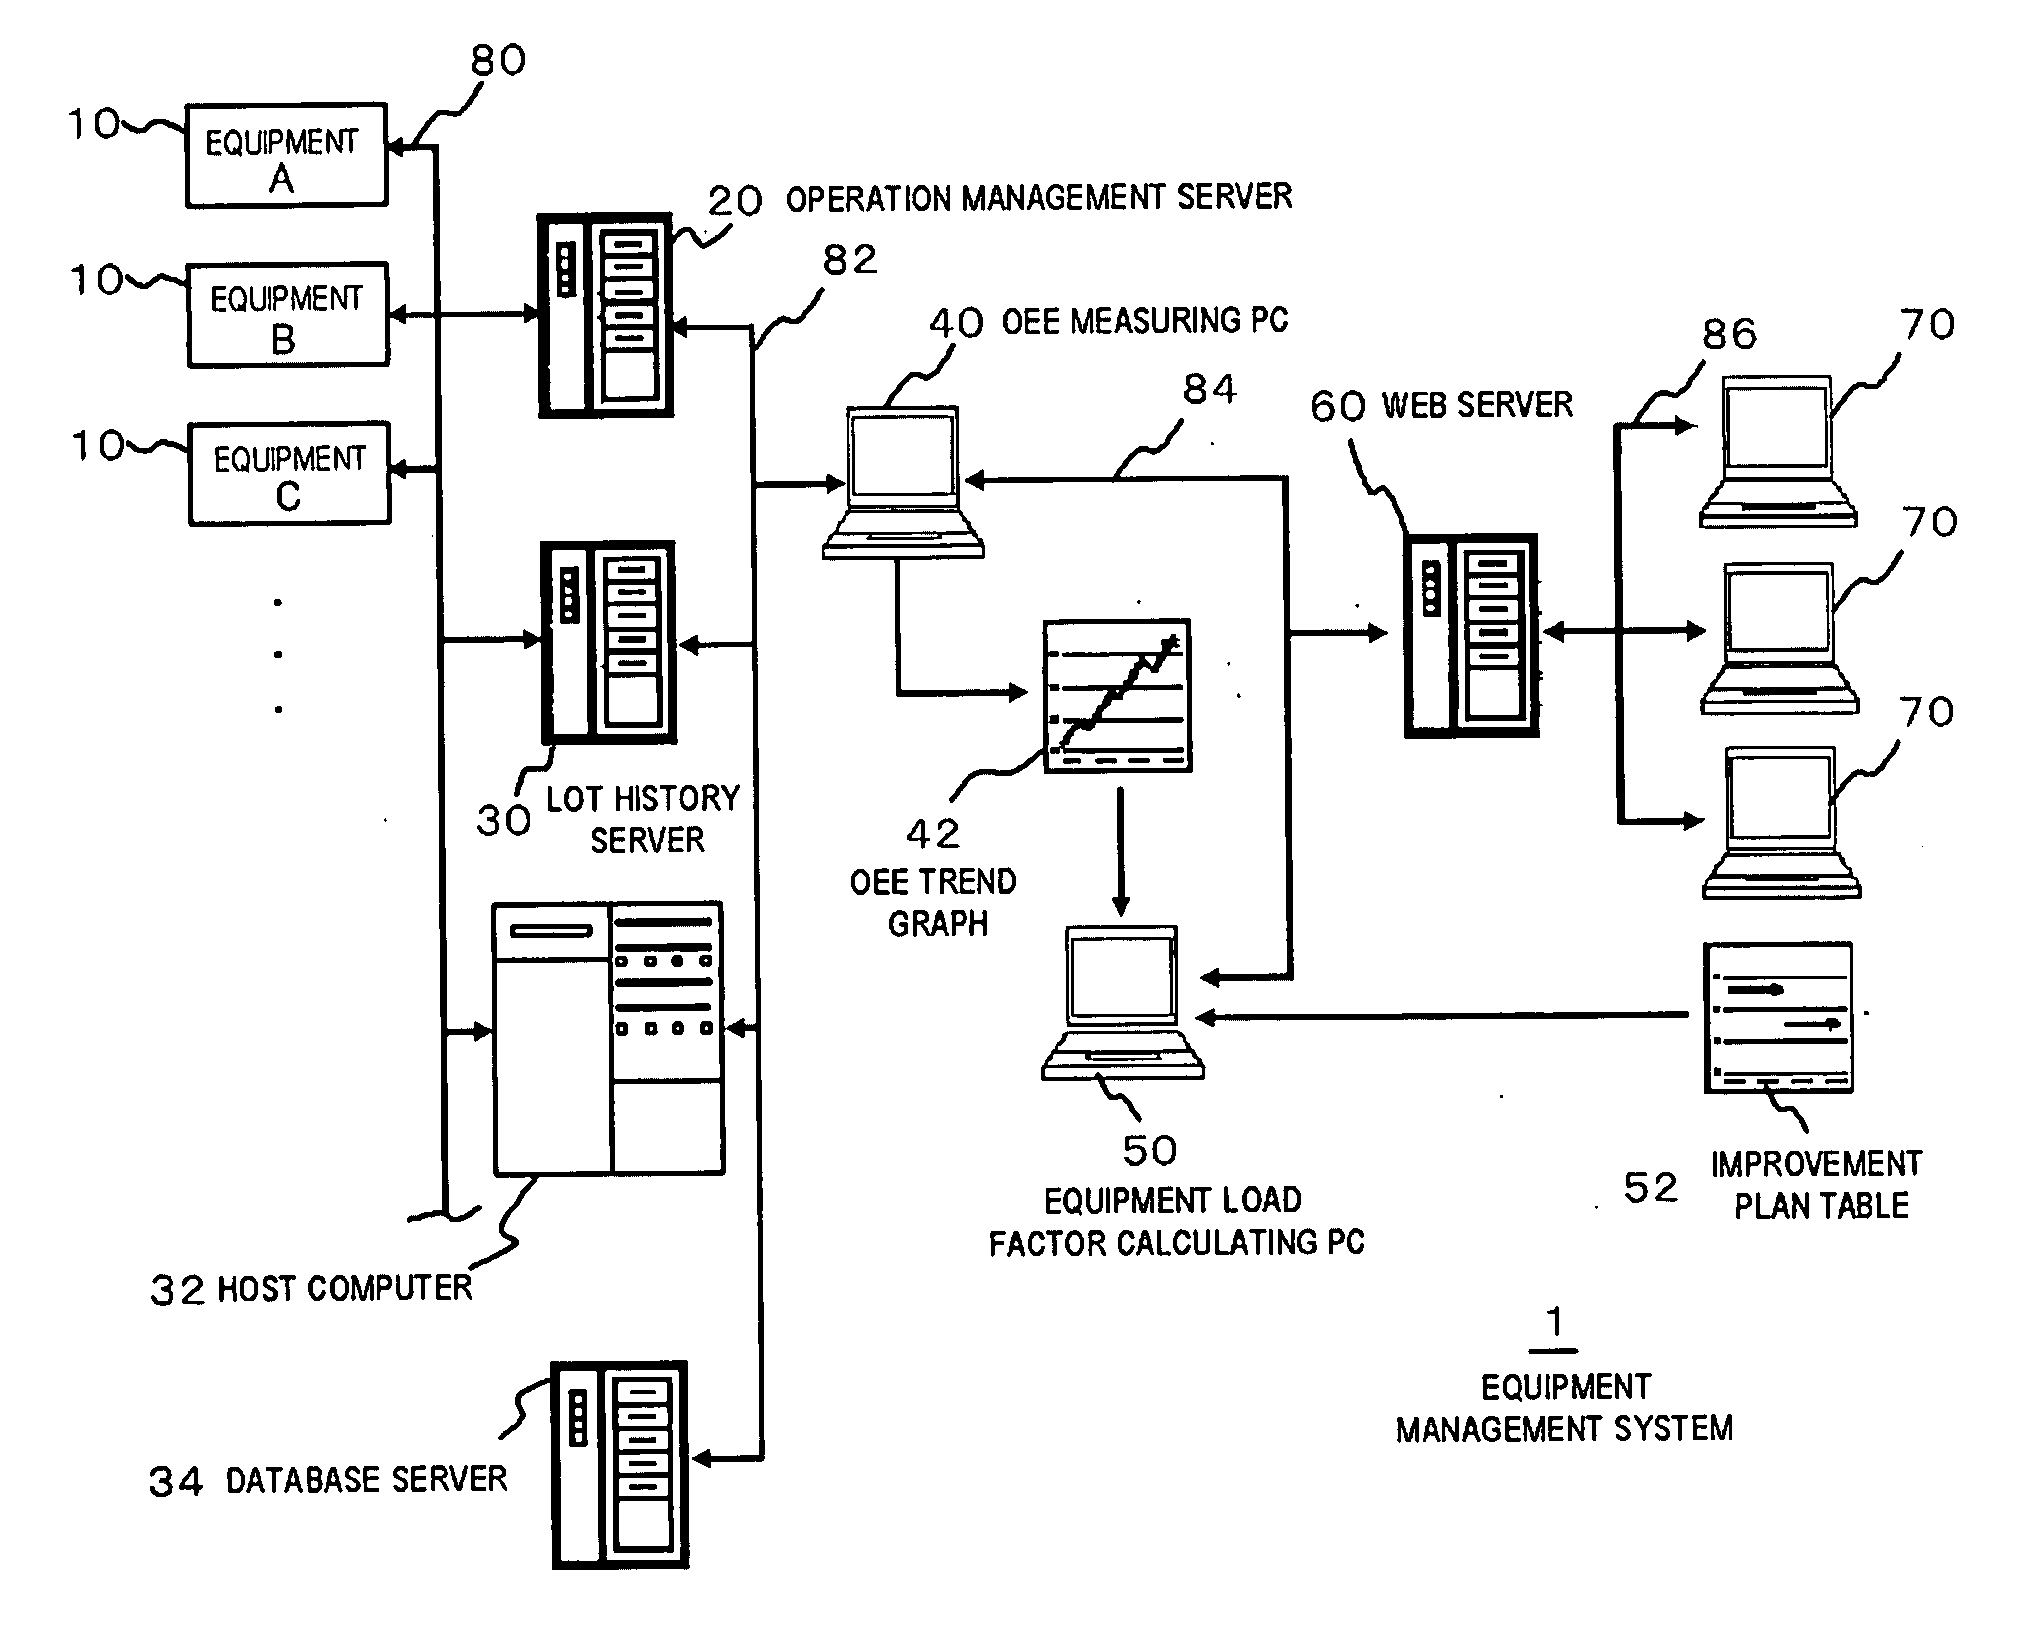
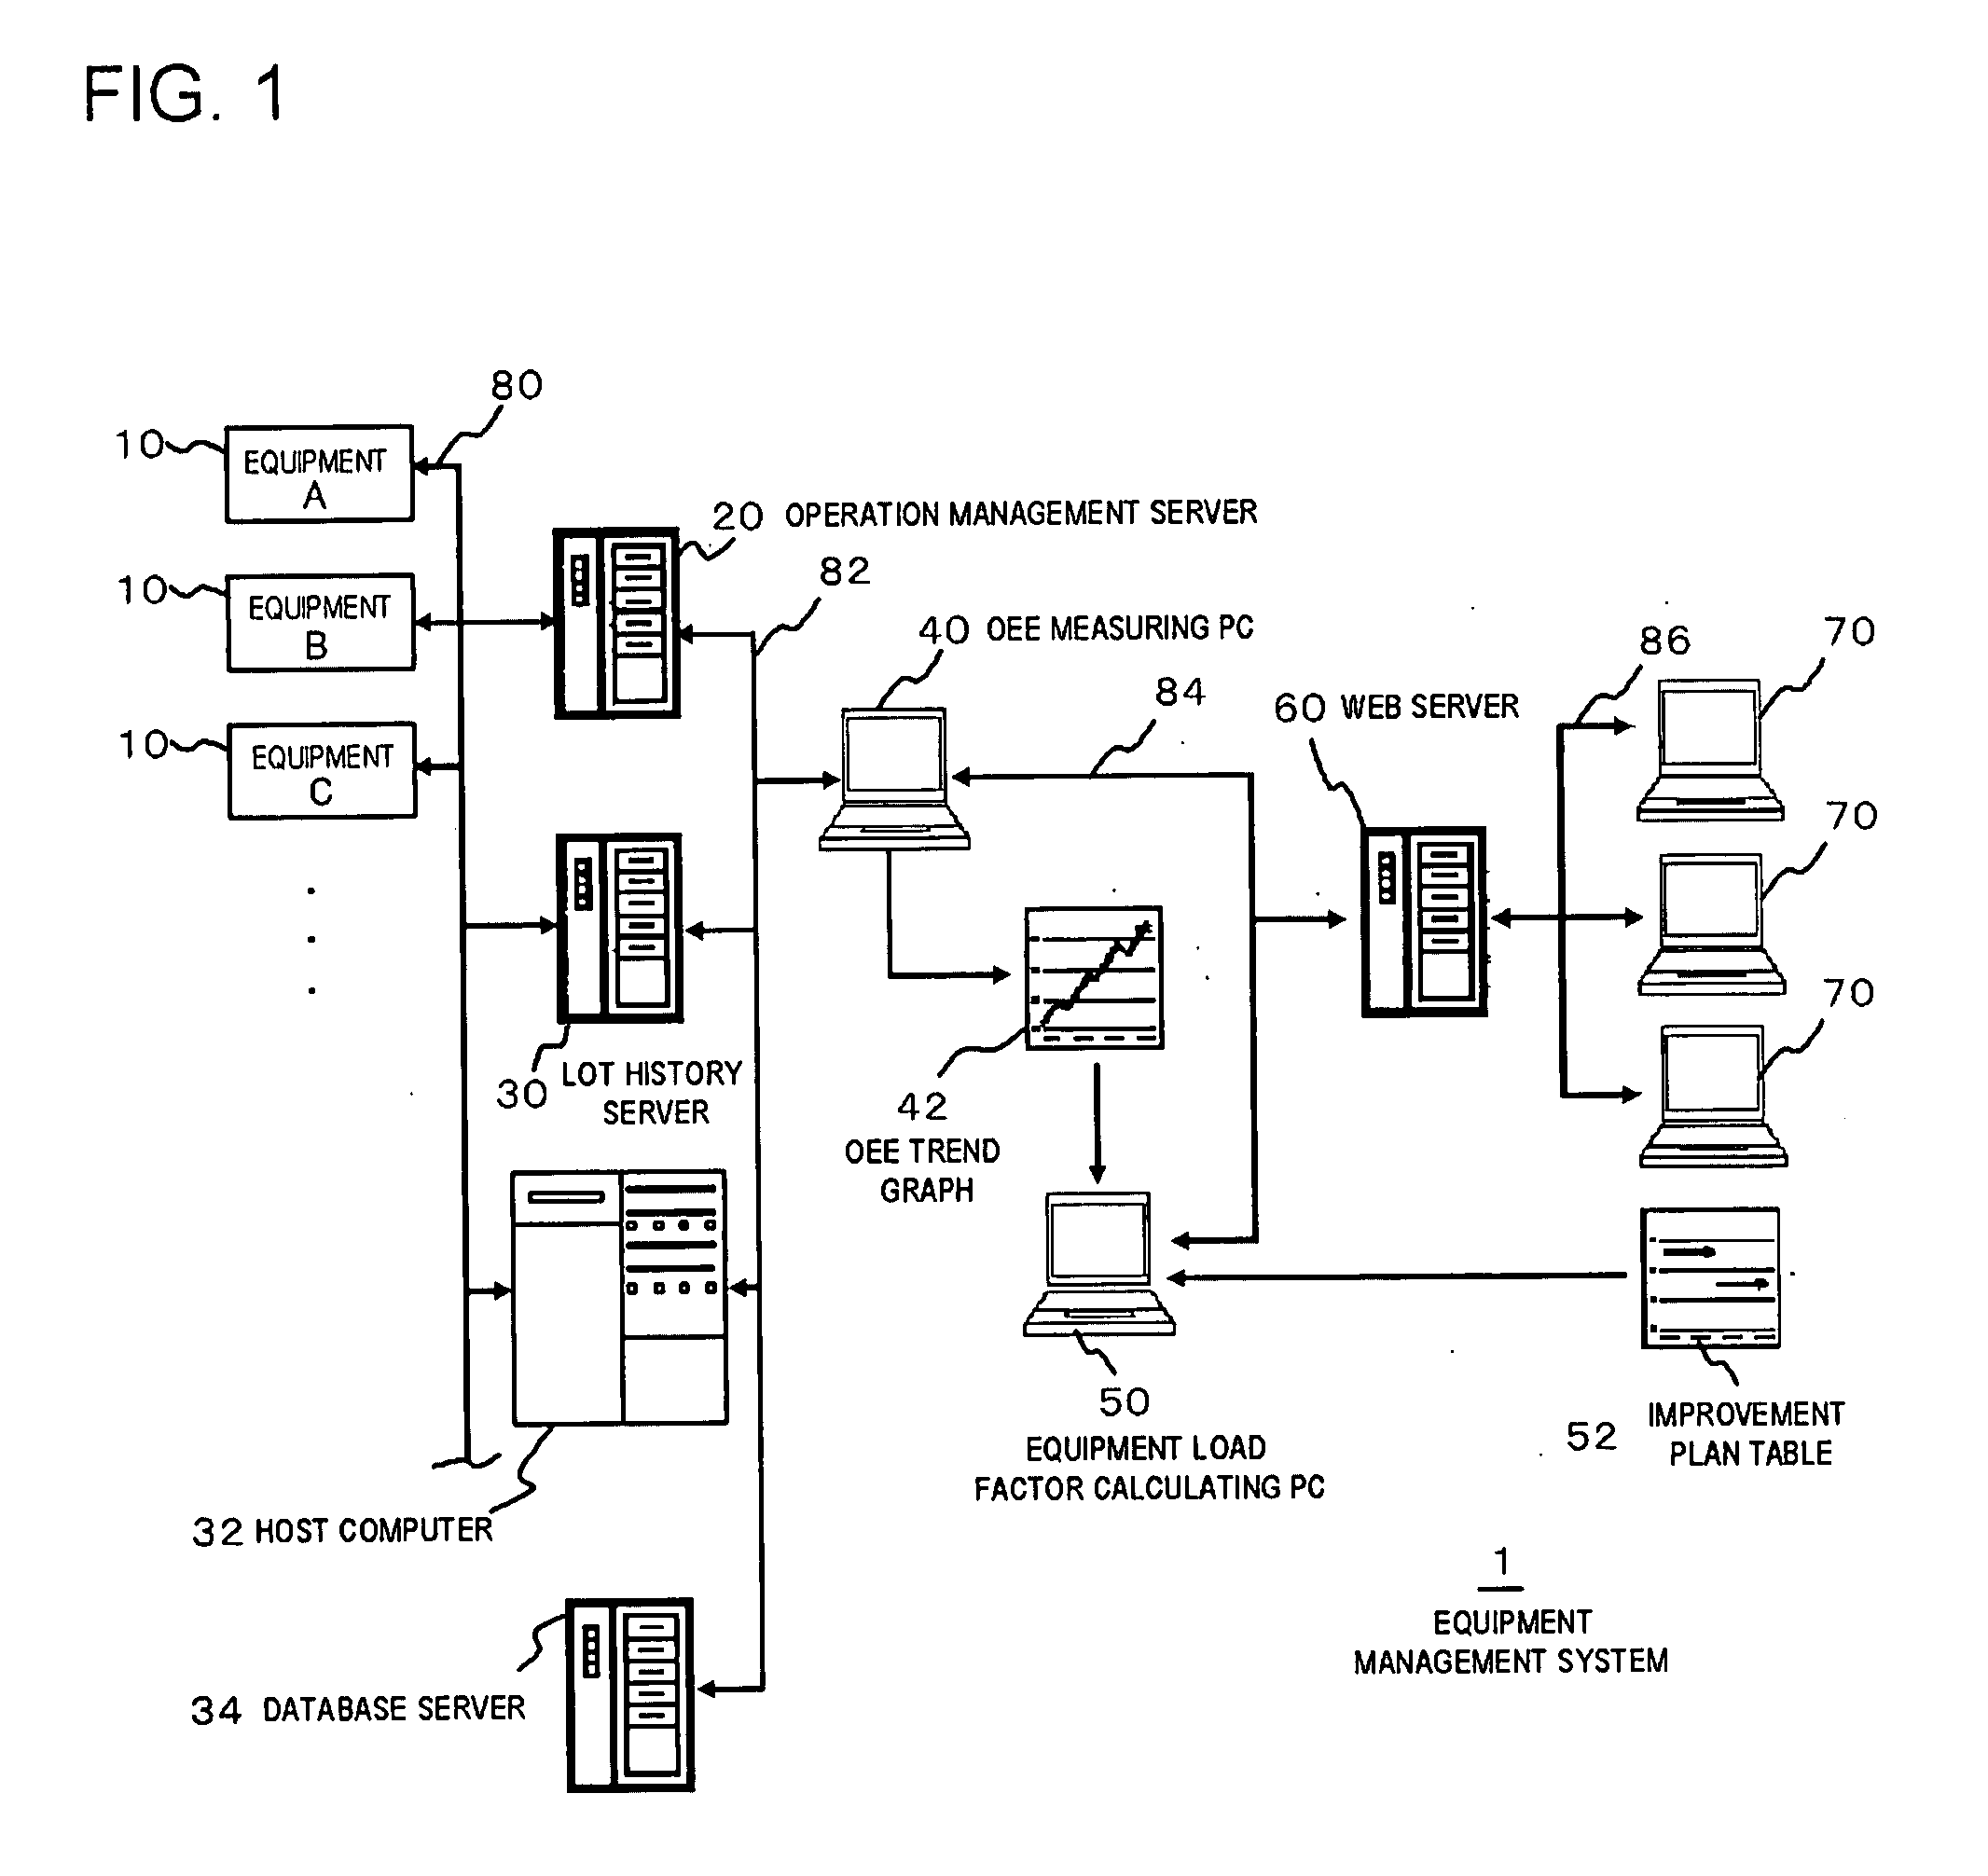
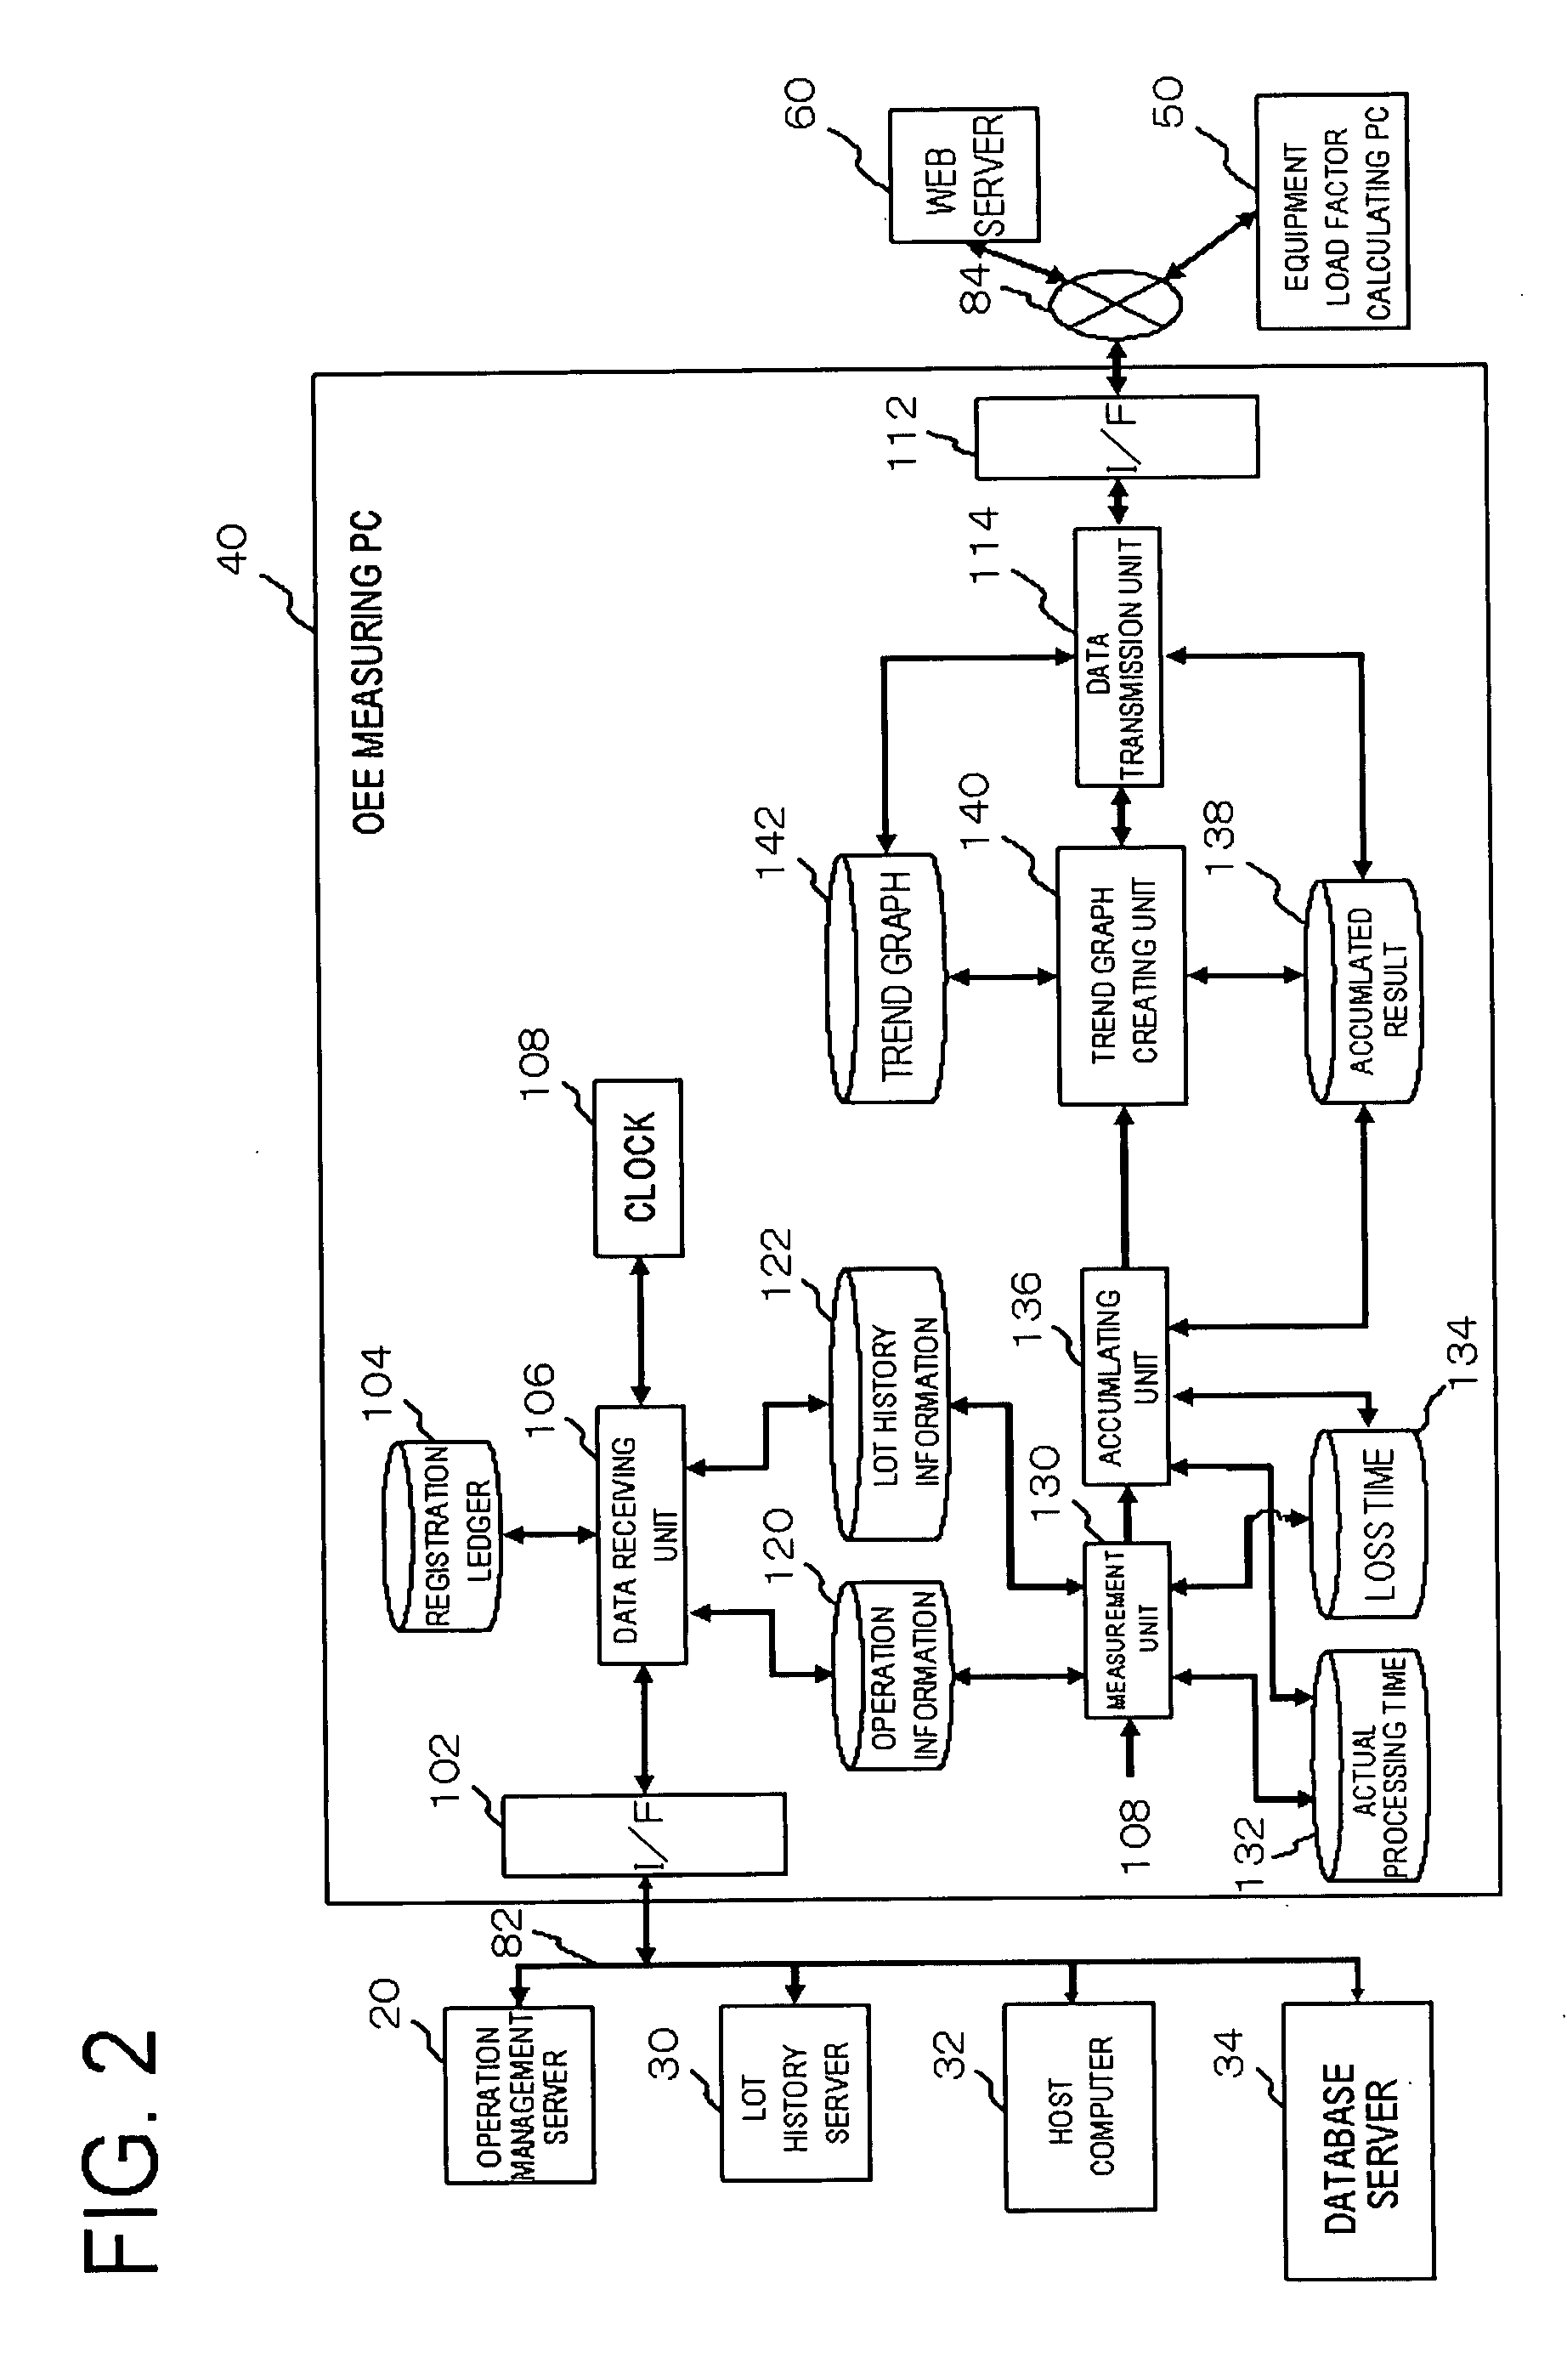
The system includes: an operation management server 20 and a lot history server 30, which collect operation status data showing operation statuses of a plurality of equipments 10; an OEE measuring PC 40 accumulating an actual processing time and a loss time from the operation status data of the plurality of equipments 10 on a predetermined period basis, and calculating overall equipment efficiencies for each predetermined period from the obtained accumulated-results; an equipment load factor calculating PC 50 accepting information on an improvement plan for the equipment, predicting a future overall equipment efficiency for each equipment according to the overall equipment efficiency and the information on the improvement plan, calculating the future group load factor based on the predicted future overall equipment efficiency; and a WEB server 60 storing equipment management information including the future overall equipment efficiency and the future equipment load factor for a plurality of equipments.

Description

[0001]This application is based on Japanese Patent application NO. 2006-185391, the content of which is incorporated hereinto by reference.BACKGROUND[0002]1. Technical Field[0003]The present invention relates to an equipment management system, and, more particularly, to an equipment management system capable of managing an equipment investment plan or the like, based on an overall equipment efficiency (OEE) and an equipment load factor of a production equipment.[0004]2. Related Art[0005]A conventional equipment capacity calculation system for a production equipment includes, the system disclosed in Japanese Laid-Open Patent Publication No. H05-020333. The equipment capacity calculation system described in the above patent document calculates processing performance of an equipment with a complex structure and many functions like a semiconductor production device. And the calculation system is provided with an equipment specification management unit for registering and managing data f...

Claims


Application Information

Patent Timeline
IPC IPC(8): G06F17/18G05B19/418G06Q50/00G06Q50/04
CPCG06Q10/0631H04L43/0817H04L43/045Y02P90/02
Inventor IDE, SHIGEAKI
Owner RENESAS ELECTRONICS CORP
Learn More