Hybrid contact lens with improved resistance to flexure and method for designing the same
- Summary
- Abstract
- Description
- Claims
- Application Information
AI Technical Summary
Benefits of technology
Problems solved by technology
Method used
Image
Examples
examples
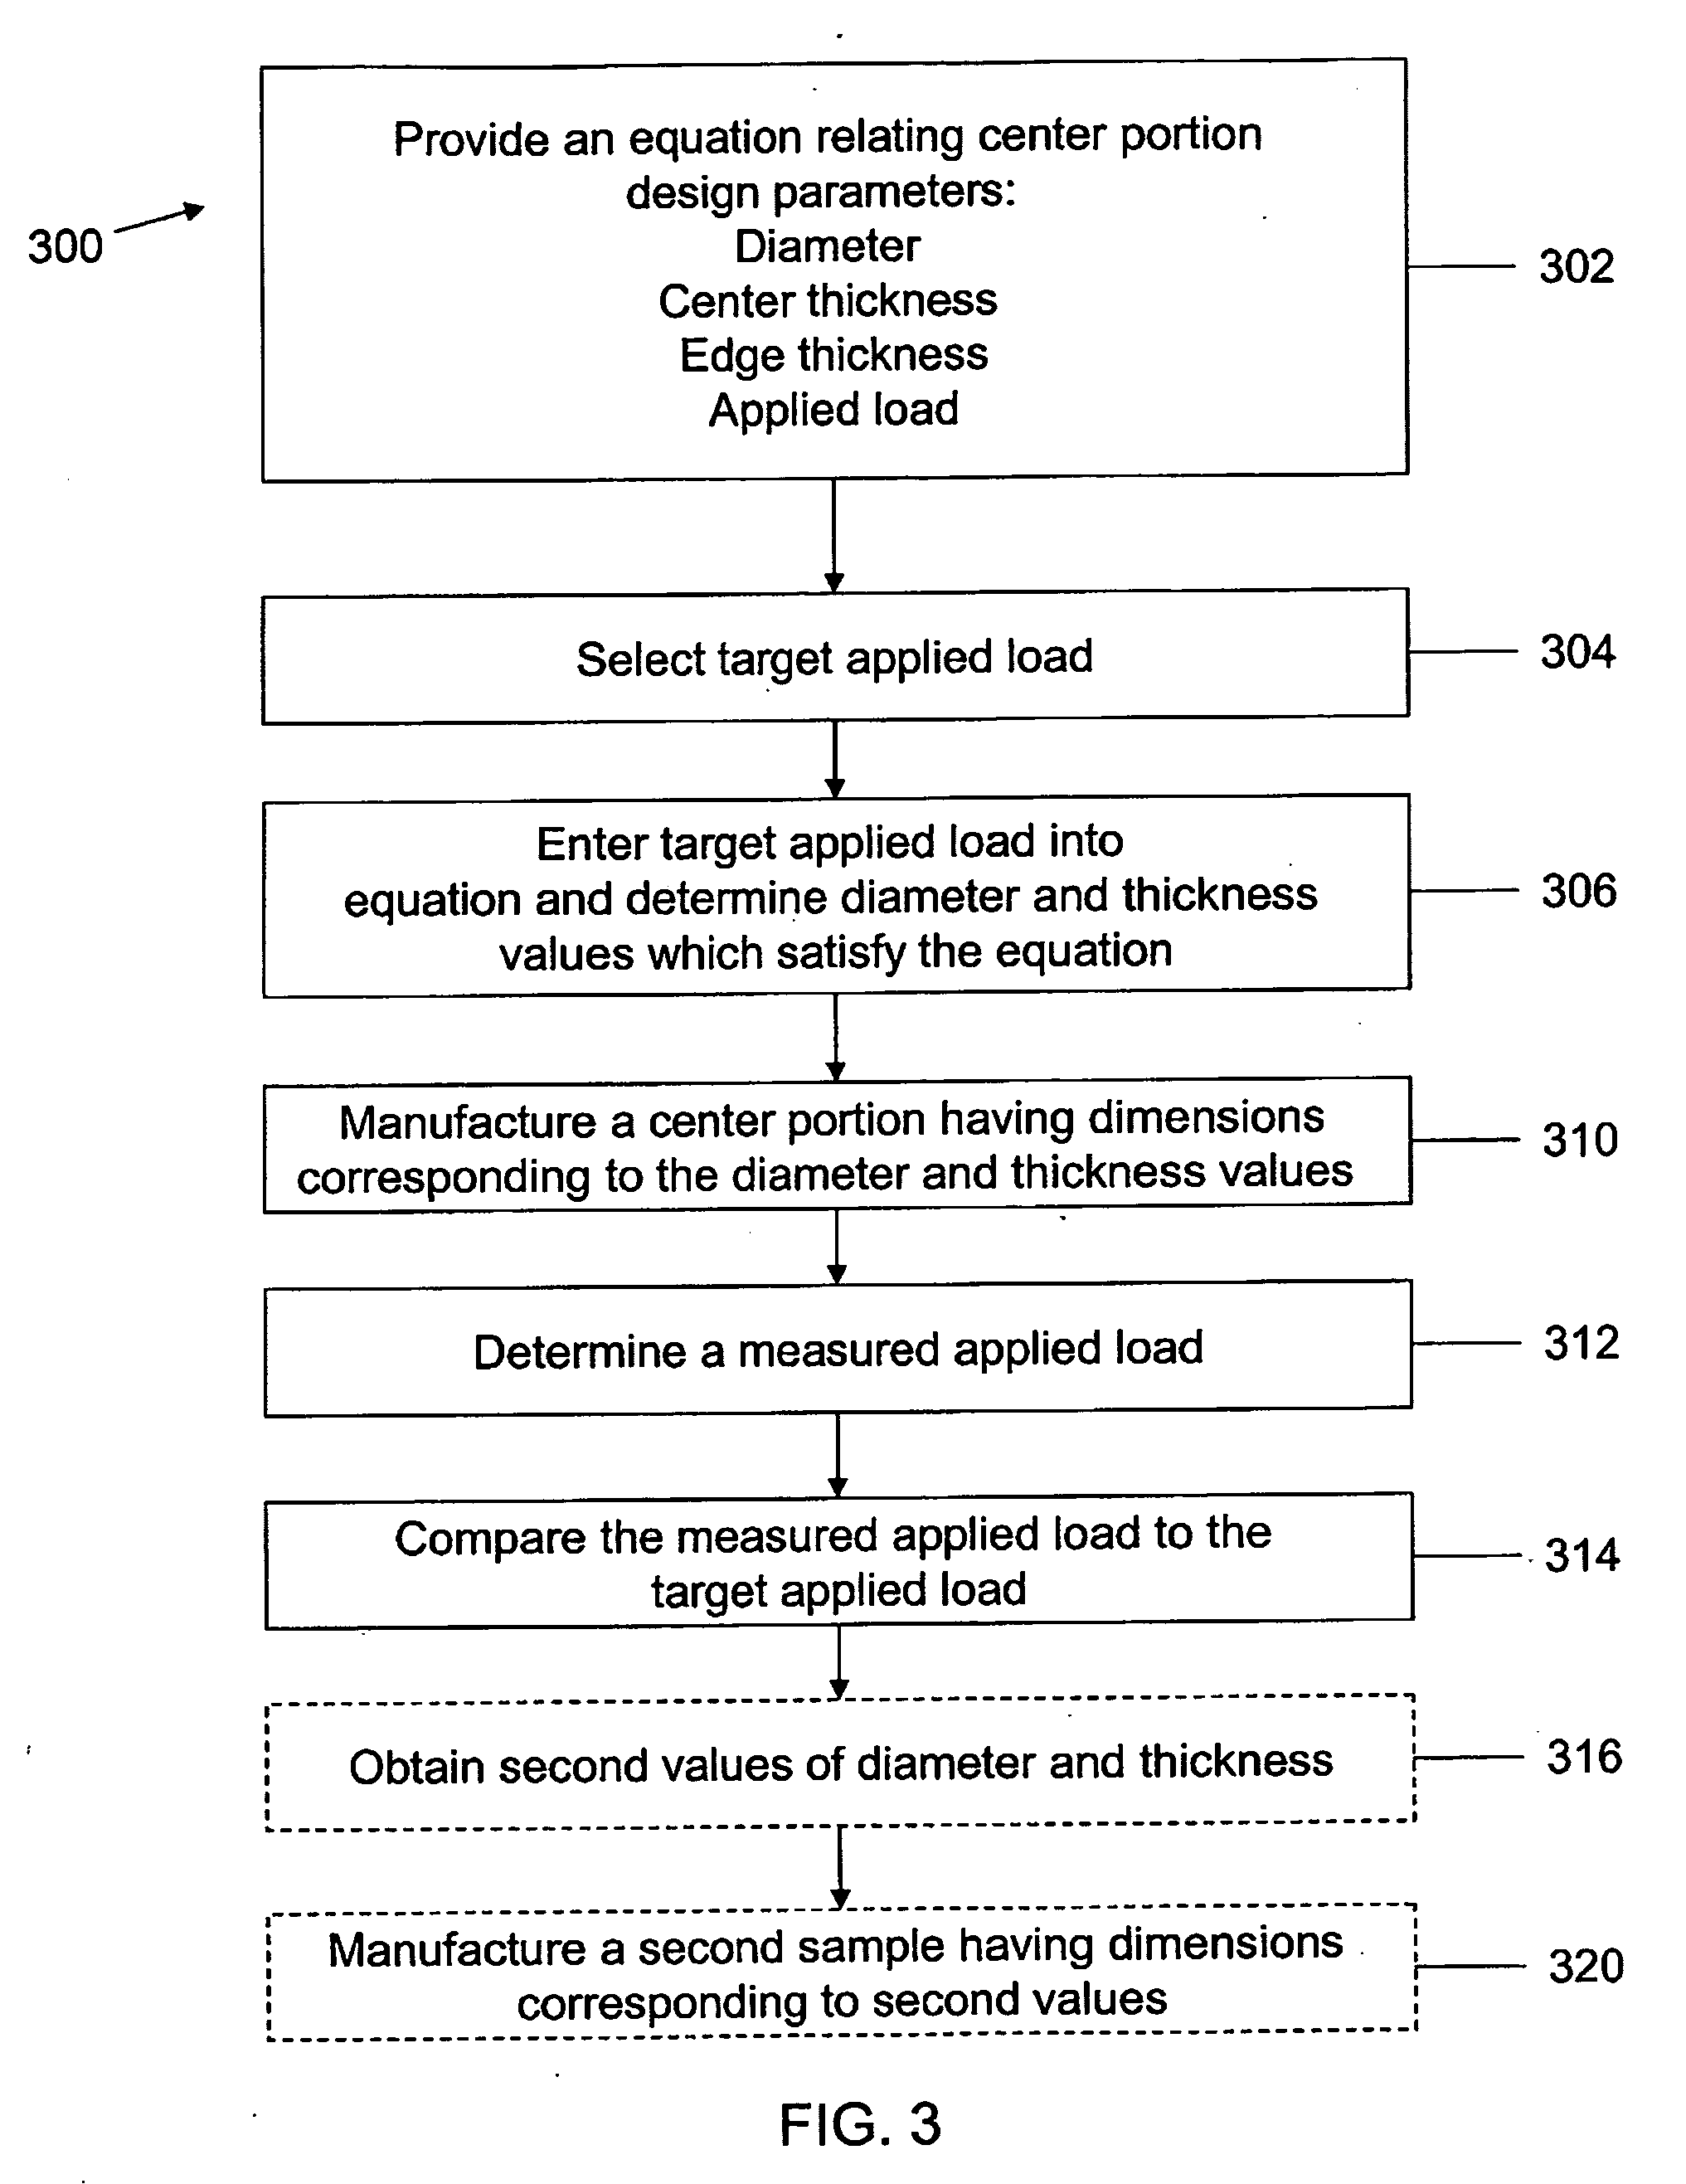
[0066]A series of center portions for hybrid contact lenses having varying design parameters are manufactured by the methods described above and evaluated as follows. Samples tested are in the as-machined condition (not after removal from a skirt portion) in order to determine the load required to achieve a selected flexural deformation in a lens possessing selected design parameters. Positive (+) and negative (−) dioptric power center portions are tested, having dioptric powers of 3±, 6±, 9±, and 0. The modulus of the material used to make the center portion is approximately 12,900 kgf / cm2. Flexural deformation values are determined in accordance with International Standard ISO 11984:1999(E) by measuring the applied load to cause 10%, 20%, and 30% deformation.
[0067]In the course of these investigations, parameters which may be used to predict the applied load that results in a selected level of flexural resistance of the center portions of hybrid contact lenses have been unexpected...
examples 1-3
(−) Dioptric Power Lenses
[0068]FIGS. 4A, 5A, and 6A present three-dimensional contour plots of the predicted applied loads, calculated according to Equation (1), that result in flexural deformations of approximately 10%, 20%, and 30% as a function of the edge and center thicknesses for a center portion of a (−) dioptric power hybrid lens. The approximate magnitude of the constants k1-k7 utilized in Equation (1) were determined as discussed above and are presented in Table 2 below.
TABLE 2Equation (1) constants for (−) dioptric power center portionsEx-%ampleDeformationk1k2k3k4k5k6k71106393570.8514.7207234851.522012776281.3122.1292647663.533015817741.525.5362457269.4
[0069]FIGS. 4A, 5B, and 6B illustrate that Equation (1) provides a generally smooth, continuous three-dimensional surface. In general, as the peak deformation is increased, the predicted applied load values also increase. To utilize this surface, the center and edge thickness parameter values are selected and their position...
examples 4-6
(+) Dioptric Power Lenses
[0071]The process described in Examples 1-3 is repeated in Examples 4-6, except that the lenses tested are (+) dioptric power lenses. FIGS. 7A, 8A, and 9A present three-dimensional contour plots of the estimated applied load, calculated according to Equation (1), resulting in flexural deformations of 10%, 20%, and 30% as a function of the diameter and edge thickness for a center portion of a (+) dioptric power hybrid lens. The approximate magnitude of the constants k1-k7 utilized in Equation (1) were determined as discussed above and are presented in Table 3 below.
TABLE 3Equation (1) constants for (+) dioptric power center portions%ExampleDeformationk1k2k3k4k5k6k7410639415027.511860535251052054566196.1913365.631463029467875.473709312112
Similar to FIGS. 4A, 5A, and 6A of Examples 1-3, FIGS. 7A, 8A, and 9A illustrate that Equation (1) provides a generally smooth, continuous three-dimensional surface. Likewise, as the peak deformation is increased, the predicte...
PUM
 Abstract
Description
Claims
Application Information
 - R&D
- Intellectual Property
- Life Sciences
- Materials
- Tech Scout
- Unparalleled Data Quality
- Higher Quality Content
- 60% Fewer Hallucinations
Browse by: Latest US Patents, China's latest patents, Technical Efficacy Thesaurus, Application Domain, Technology Topic, Popular Technical Reports.
© 2025 PatSnap. All rights reserved.Legal|Privacy policy|Modern Slavery Act Transparency Statement|Sitemap|About US| Contact US: help@patsnap.com


