
Method and System for Determining the Placement of RFID Antennas to Obtain A Readable Region for RFID Tags

Inactive Publication Date: 2009-01-15
THE HONG KONG UNIV OF SCI & TECH
View PDF13 Cites 17 Cited by
  • Summary
  • Abstract
  • Description
  • Claims
  • Application Information

AI Technical Summary

Benefits of technology

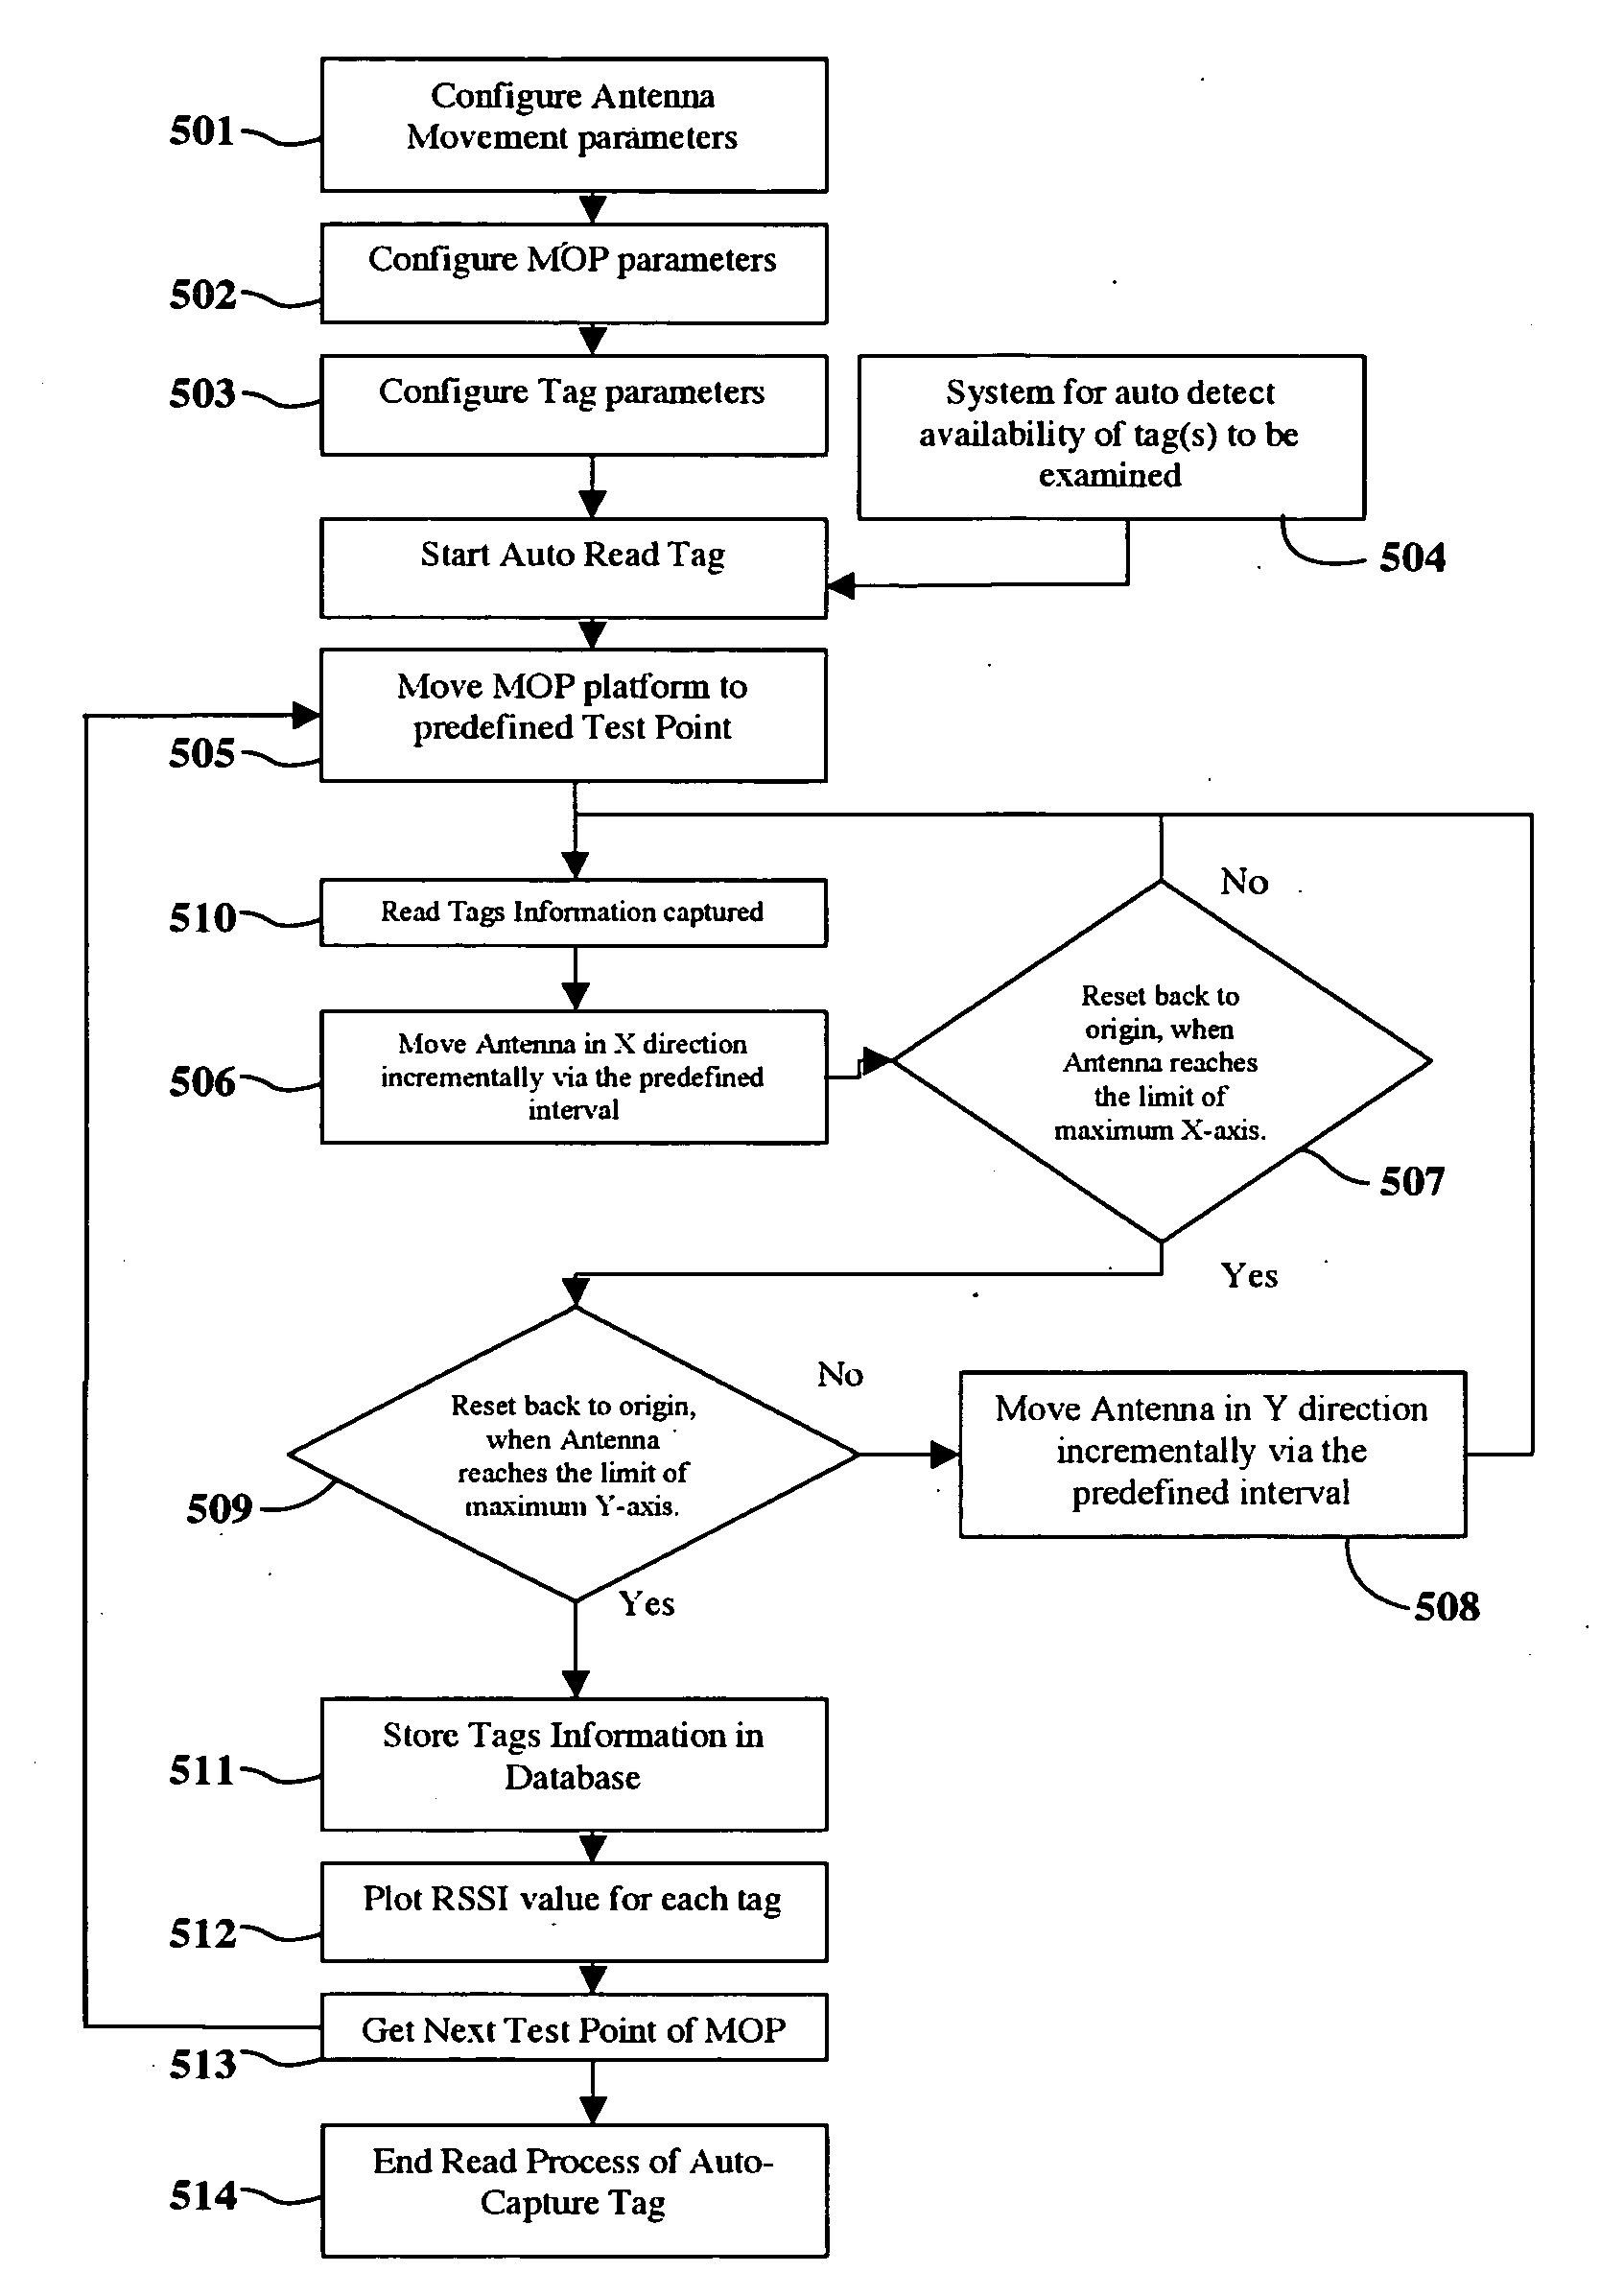
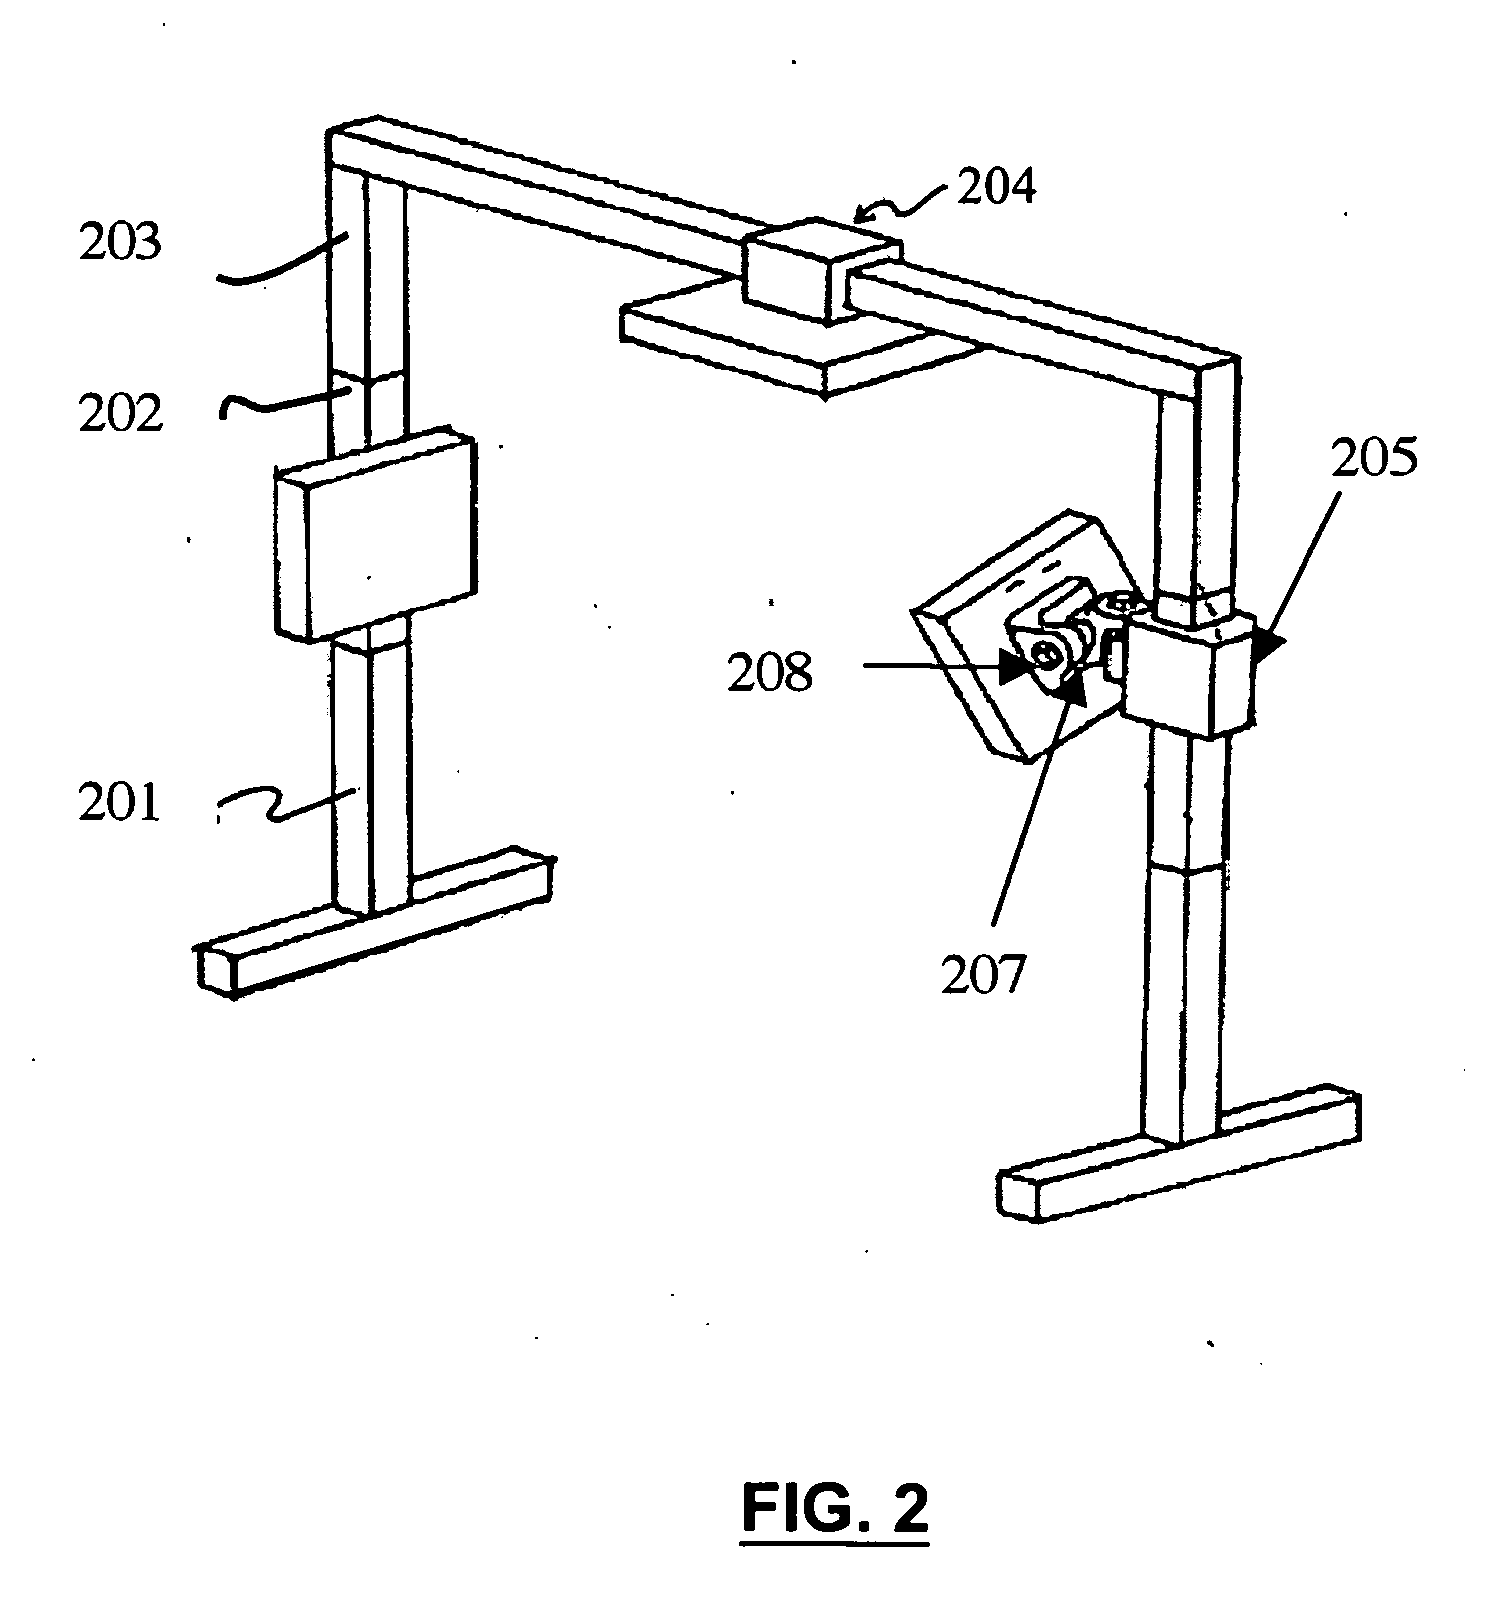
[0016]The RRA package is developed to analyze the input parameters and readings; the analyzed result is presented in both tabular and graphical format to show the readable region of the tags in order to aid users in setting up the RFID devices for their application. An RRA analytical method is used to visualize the compiled data by the CIS-GUI in “surface-plot” and “heat-map” graphical presentation. To precisely describe the STP under the testing environment, our invention uses different techniques to represent the 3-dimensional relationship between RFID antennas and the STP mounted on the MOP. Firstly, there is a scanning mesh formed by at least 2 antennas traveling at 2 orthogonal directions, named as x and y axis respectively, to capture the RSSI value of the tags examined. Secondly, a number of Test Points on the floor (named as z-plane) are assigned to MOP. Hence, the plane of x antenna, y antenna and the z-plan conceptually form a 3-dimensional orthogonal plane for better describing the relationship between RFID tags and antennas. The MOP will move to every Test Point and such series of Test Points generates a simple routing path for the MOP to travel.
[0023]This invention discloses a scientific analysis method, apparatus and system for performing a repeatable, reliable, and real-time measurements of the tag performance based on different combination of antennas positions. The APC, APH and extendable PAMF with built-in chain belt provide a flexible way to measure the tag performance in different scenes. RRA software with analytical tool supports multiple sampling data feature which can filter out the variance of tags' response against time such as behavior caused by frequency hopping for one of the EPC Gen2 Air Communication Protocol standards. Special effort on the graphical user interface (“GUI”) design provides a better understanding of tags performance against different antennas positions and indicates the consistency of the tags' performance in order to improve the reliability of the measurement.

Problems solved by technology

However, passive tags are cheaper and smaller than their active counterparts.
As such, it is a nontrivial task to locate precisely whether the causes of an unsatisfactory RFID deployment are due to the problems with tag reading distance, tag orientation, antenna geometry, read rate, detuned frequencies, multi-path effects, readers' emitting power, or other factors.
However, the exploration process is overly tedious, and the result is likely random.
In addition, a multidimensional metrics problem is generated due to the uniqueness of each tag.
The above mentioned surface-plots can be easily visualized by a 3-dimensional view, but it is hard to differentiate the changes on the surface.

Method used


Image

  • Method and System for Determining the Placement of RFID Antennas to Obtain A Readable Region for RFID Tags
  • Method and System for Determining the Placement of RFID Antennas to Obtain A Readable Region for RFID Tags
  • Method and System for Determining the Placement of RFID Antennas to Obtain A Readable Region for RFID Tags

Examples


Embodiment Construction

[0048]The presented invention is for acquiring the readability of a tag population from a provided reader. Readability of the tags depend on several factors, in our invention the following factors are focus:

[0049]a. Number of tags

[0050]b. Number of antennas

[0051]c. Orientation of antennas with respect to tags

[0052]d. Orientation of tags with respect to antennas

This invention allows the user visualize the relationships between each of the above mentioned factors in a scientific and graphical manner. The compiled results can be presented graphically to show the Readable Region of the examined tags by the provided readers, and the optimal antennas' position can be evaluated.

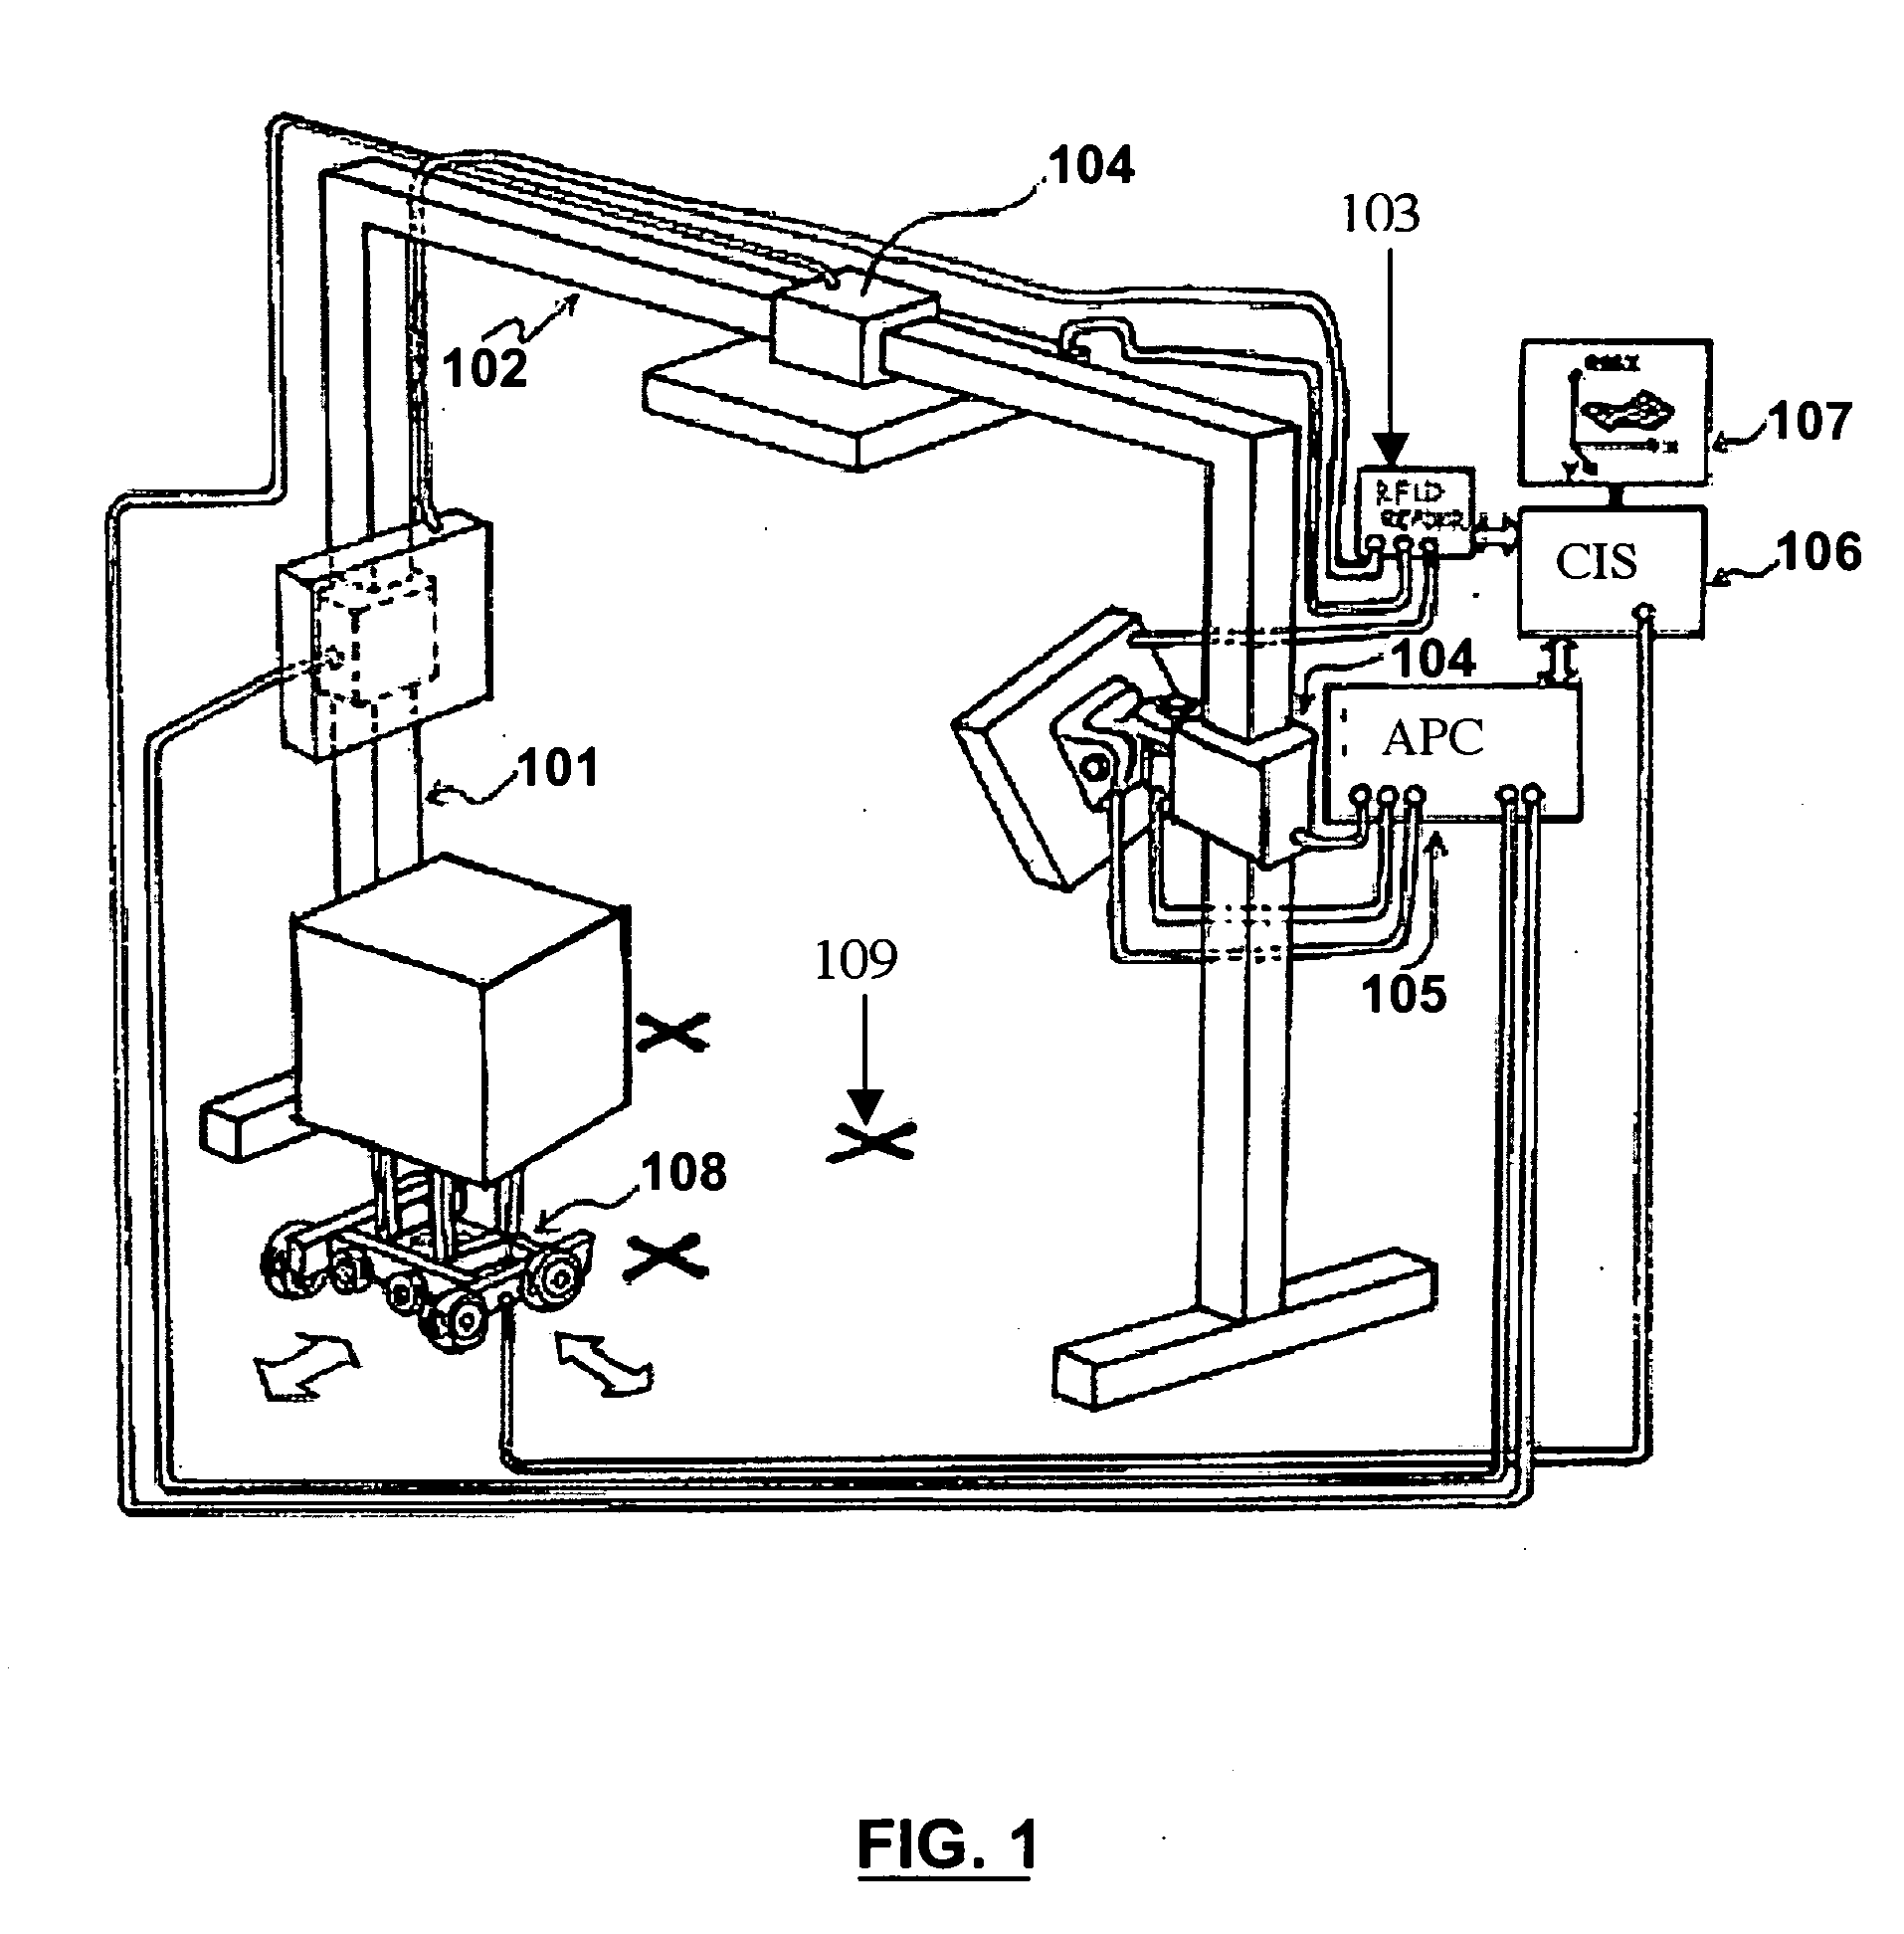
[0053]As shown in FIG. 1, the PAMF provides a support mechanism for the computerized APH 104, which provides the capability for continuously moving the antenna along the vertical 101 and horizontal 102 poles. The APC 105 controls the position of each mounted antenna. The RFID Reader 103 from the device manufacture c...


PUM


Abstract

This invention presents an apparatus and system and its accompanying method for automatically placing of RFID antennas and a method for obtaining a readable region for passive RFID Tags are disclosed. The apparatus and system include a Portable and Adjustable Mounting Framework (PAMF) with built in chain belt for holding the RFID antennas, an Antenna Position Controller (APC) and Antenna Position Holders (APH) for control the movement of the antennas, a Moveable Object Platform (MOP) for carrying a number of RFID tags and a Computer Integrated System (CIS) with Readable Region Analysis (RRA) software to capture the transmitted and received RF signal from / to the RFID readers.

Description

CROSS-REFERENCE TO RELATED APPLICATIONS[0001]This application claims priority of provisional application entitled “Apparatus and System for Determining the Placement of RFID Antennas to Obtain a Readable Region for Passive RFID Tags and Method Thereof,” filed on Jun. 20, 2007, with Ser. No. 60 / 936,293, and the entire disclosure of which is herein incorporated by reference.BACKGROUND[0002]1. Field of the Invention[0003]This invention relates to techniques relating to successful RFID deployment. In particular, it relates to an apparatus and its accompanying system for automatic placement of RFID antennas and a method for obtaining a readable region for passive RFID Tags.[0004]2. Description of Related Art[0005]Radio-Frequency Identification (“RFID”) is an automatic identification method that relies on small electronic devices to transmit and receive radio frequency signal for the purpose of identification.[0006]RFID devices are mainly grouped into readers and tags. An RFID reader is a...

Claims


Application Information

Patent Timeline
IPC IPC(8): G08B13/14
CPCG06K7/10346G06K7/10336
Inventor CHEUNG, SHING CHINI, LIONEL MING SHUAN
Owner THE HONG KONG UNIV OF SCI & TECH
Learn More