

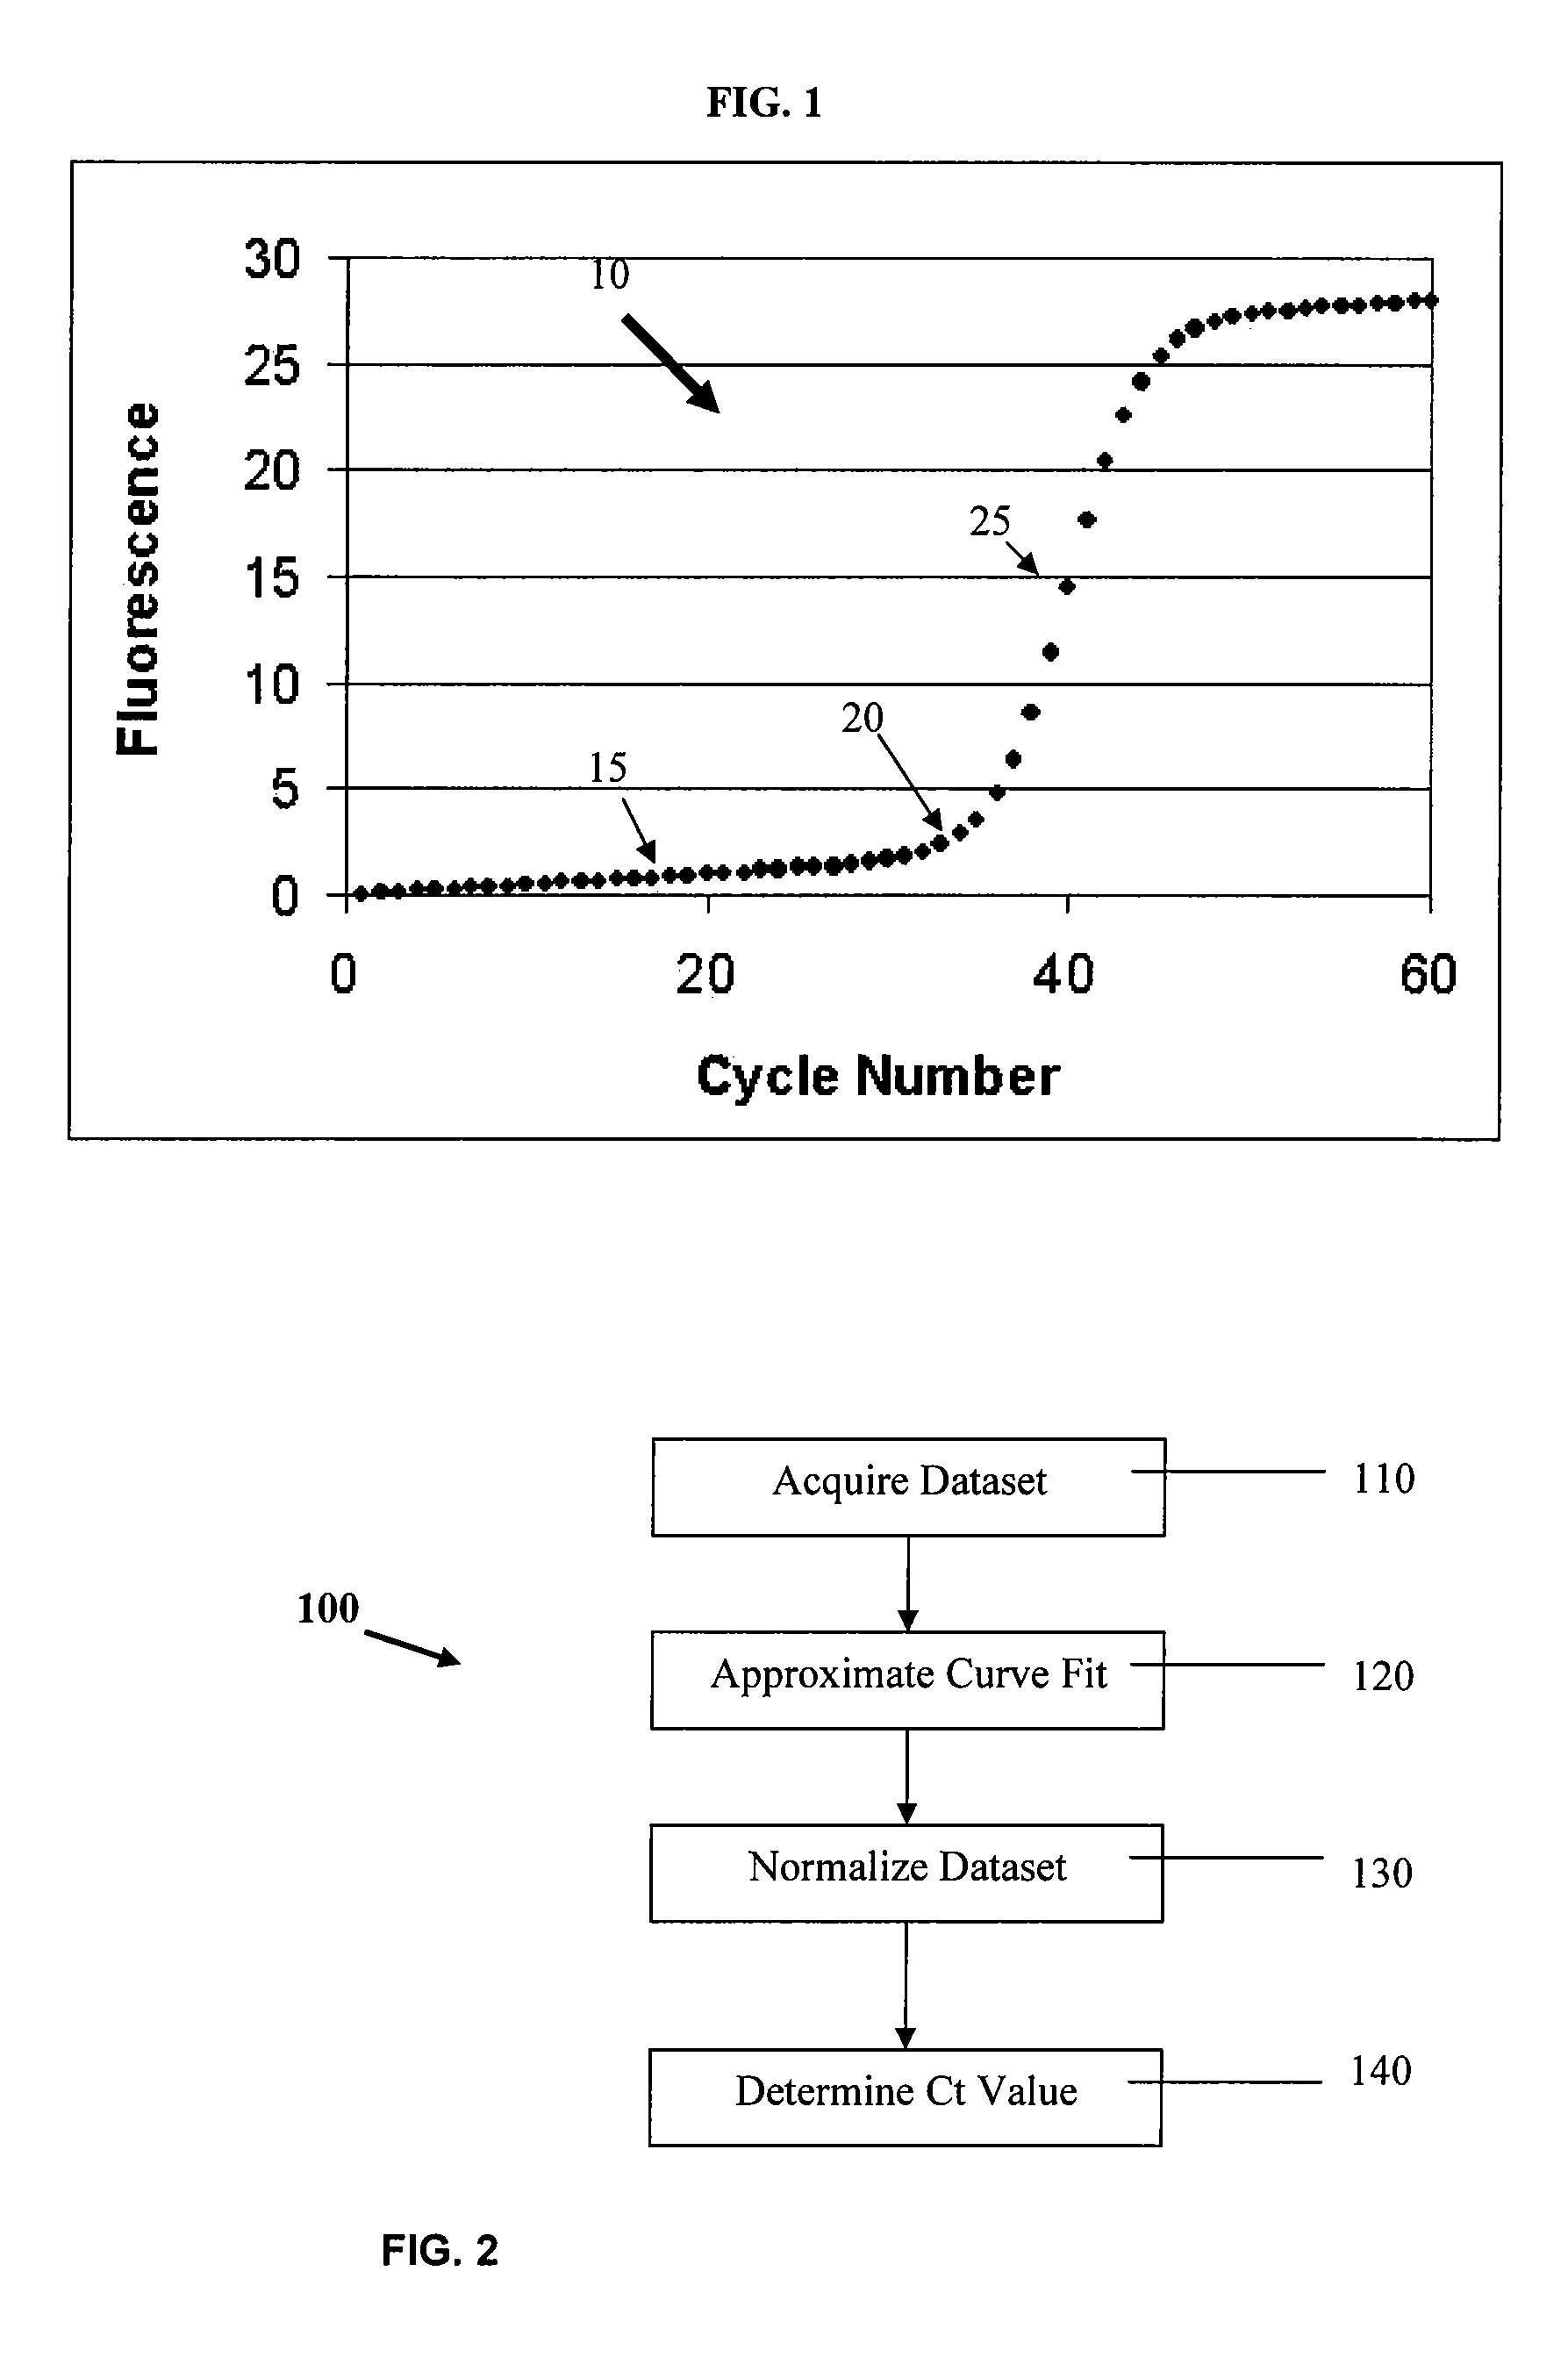
PCR elbow determination using quadratic test for curvature analysis of a double sigmoid
a curvature analysis and quadratic test technology, applied in the field of systems and methods for processing data representing sigmoid or growth curves, can solve the problems of inability to work satisfactorily, inability to accurately determine the baseline stop (or end of the baseline) of the growth curve shown in fig. 1 and other problems, to achieve the effect of satisfying the needs of the user, and reducing the difficulty of the user
- Summary
- Abstract
- Description
- Claims
- Application Information
AI Technical Summary
Problems solved by technology
Method used
Image

Examples
examples
[0108]FIG. 21 shows a real-time PCR data signal that does not contain a target, and which has a baseline intercept, slope and an AFI value within acceptable ranges. The curvature algorithm of equations (10), (12), and (13) indicates that the Ct value is 12.94 and that the (maximum) radius of curvature (ROC) is 481. When the growth validity test is applied, the data is determined to have insufficient growth or insufficient curvature, meaning that the signal fits a first or second order quadratic function with a statistical significance value exceeding the threshold, e.g., R2>0.90.
[0109]FIG. 22 shows another real-time PCR data signal that also has an ROC of 481; in this case, the R2 value was much less than the threshold, e.g., 0.99, so the process continued to calculate the Ct value. The curvature algorithm of equations (10), (12), and (13) correctly indicates that the maximum radius of curvature, and thus the Ct value, occurs at cycle 38.7. Comparing FIG. 21 with FIG. 22, it is appa...
PUM
| Property | Measurement | Unit |
|---|---|---|
| threshold | aaaaa | aaaaa |
| cycle threshold | aaaaa | aaaaa |
| Ct | aaaaa | aaaaa |
Abstract
Description
Claims
Application Information