Method for visualization of point cloud data

a point cloud data and data visualization technology, applied in the field of point cloud data visualization, can solve the problems of limiting the ability of a system to properly image the target, preventing the sensor from properly illuminating, and difficult interpretation of point cloud data, so as to improve visualization and interpretation.

Inactive Publication Date: 2009-09-17
HARRIS CORP
View PDF64 Cites 36 Cited by
  • Summary
  • Abstract
  • Description
  • Claims
  • Application Information

AI Technical Summary

Benefits of technology

The invention is a method for displaying three-dimensional range data using a color space defined by hue, saturation, and intensity. The method includes selectively determining values for hue, saturation, and intensity based on a color map that maps the values to an altitude coordinate of the range data. The color map is designed to have a first peak value at a predetermined altitude corresponding to an upper height limit of a target range. The method also includes selectively determining values for saturation and intensity based on a second peak value at a predetermined altitude corresponding to an anticipated height of tree tops within a scene. The technical effect of this invention is to provide a more intuitive and visually appealing representation of three-dimensional range data for improved visualization and interpretation.

Problems solved by technology

The technical problem addressed in this patent text is the difficulty of properly imaging targets that are partially obscured by other objects, such as foliage or camouflage netting. While it is known to use 3D sensing systems to reconstruct images of such targets, the resulting point-cloud data can be difficult to interpret. This patent proposes a solution to improve the interpretation of 3D point cloud data by using color maps to selectively vary the color of each point in the data.

Method used


Image

  • Method for visualization of point cloud data
  • Method for visualization of point cloud data
  • Method for visualization of point cloud data

Examples


Embodiment Construction

[0021]The invention will now be described more fully hereinafter with reference to accompanying drawings, in which illustrative embodiments of the invention are shown. This invention, may however, be embodied in many different forms and should not be construed as limited to the embodiments set forth herein. For example, the present invention can be embodied as a method, a data processing system, or a computer program product. Accordingly, the present invention can take the form as an entirely hardware embodiment, an entirely software embodiment, or a hardware / software embodiment.

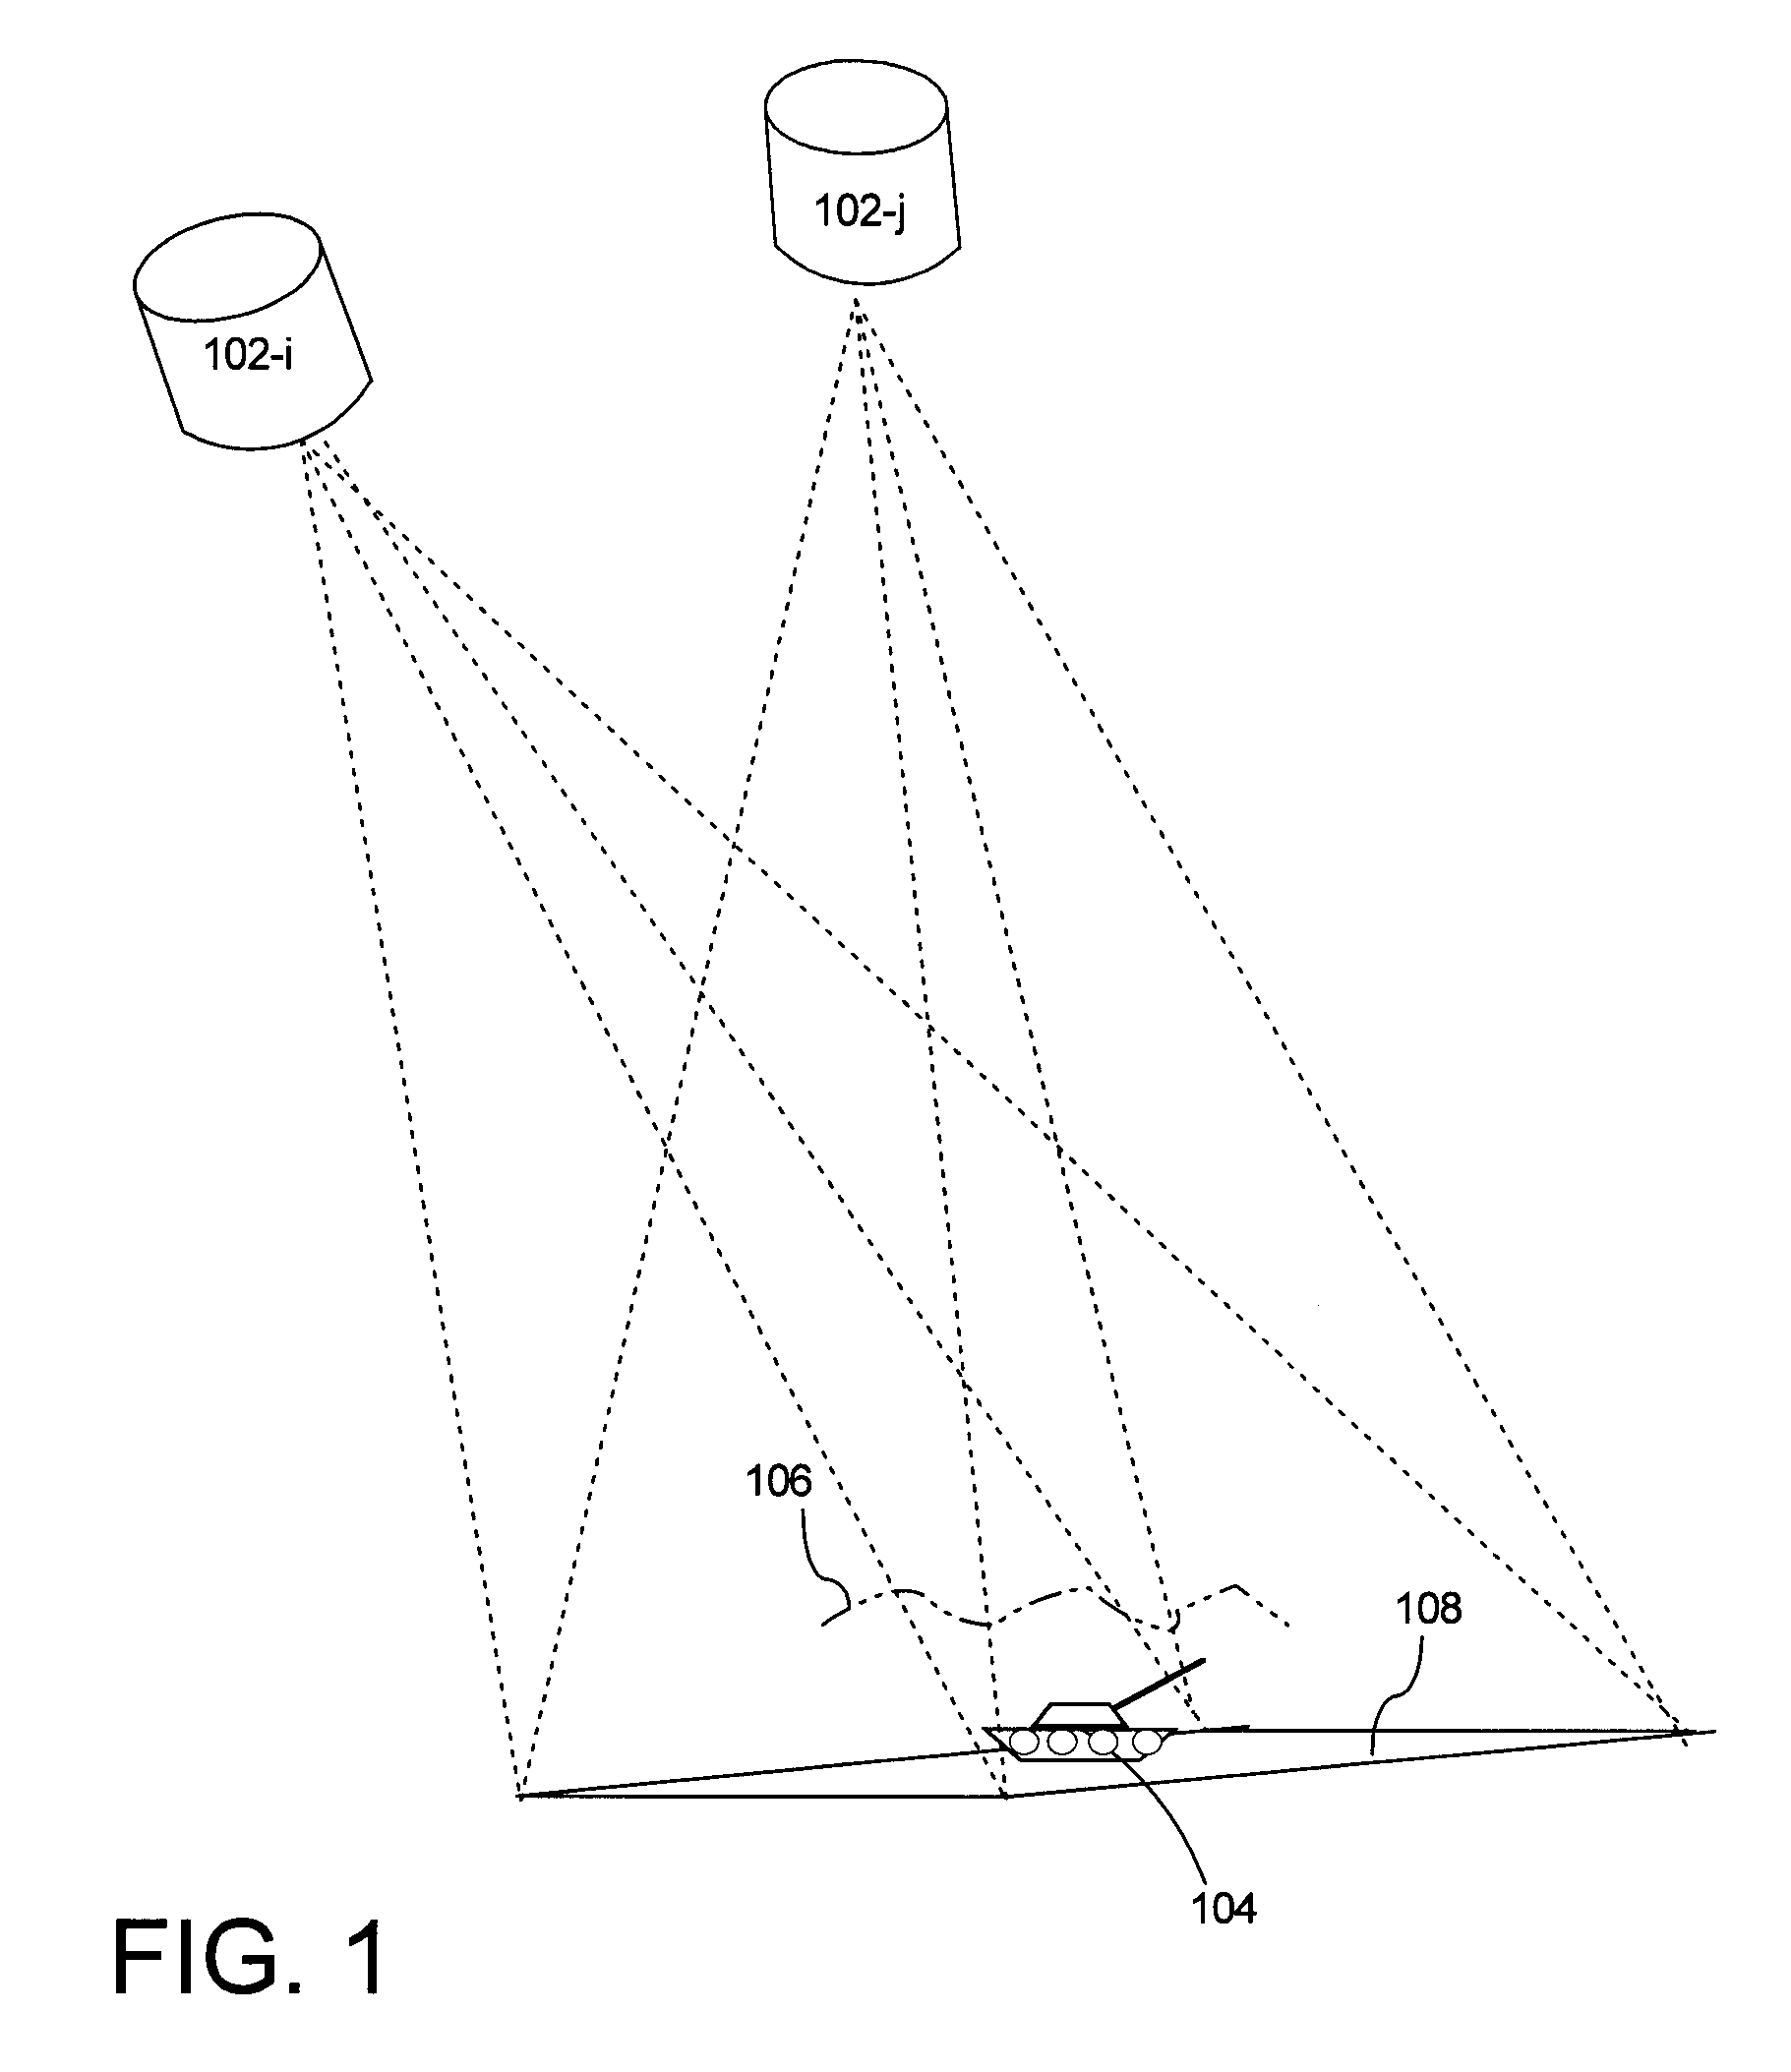
[0022]A 3D imaging system generates one or more frames of 3D point cloud data. One example of such a 3D imaging system is a conventional LIDAR imaging system. In general, such LIDAR systems use a high-energy laser, optical detector, and timing circuitry to determine the distance to a target. In a conventional LIDAR system one or more laser pulses is used to illuminate a scene. Each pulse triggers a timing ci...


PUM


Abstract

Method for providing a color representation of three-dimensional range data (200) for improved visualization and interpretation. The method also includes selectively determining respective values of the hue (402), saturation (404), and intensity (406) in accordance with a color map (FIG. 5, 6) for mapping the hue, saturation, and intensity to an altitude coordinate of the three-dimensional range data. The color map is defined so that values for the saturation and the intensity have a first peak value at a first predetermined altitude approximately corresponding to an upper height limit (308) of a predetermined target height range (306). Values defined for the saturation and the intensity have a second peak at a second predetermined altitude (310) corresponding to an approximate anticipated height of tree tops within a natural scene.

Description


Claims


Application Information

Patent Timeline
Owner HARRIS CORP
Why Eureka
Try Eureka