
Personalized traffic reports

a technology of traffic reports and personalization, applied in the field of providing traffic information, can solve the problem that users do not always have access to web sites

Active Publication Date: 2010-04-15
HERE GLOBAL BV
View PDF5 Cites 62 Cited by
  • Summary
  • Abstract
  • Description
  • Claims
  • Application Information

AI Technical Summary

Benefits of technology

[0005]To address these and other objectives, the present invention includes a method for providing personalized traffic reports. A personalized traffic report is a relatively short, audio-visual presentation that includes an audio narrative by an announcer describing the traffic conditions along a user's selected route, synchronized with a video presentation that includes maps with animations showing the traffic conditions and a visual representation of the announcer. In one embodiment, a traffic data services provider determines traffic conditions that pertain to a user's

Problems solved by technology

However, radio and television traffic broadcasts are intended for general audiences and may not be relevant to the user's specific location or route.
Moreover, users may have to wait through a long broadcast traffic report while traffic information is provided about areas that are not relevant to the user's travel plans.
However, users do not always have access to the web sites.
Further, when users access web sites with mobile devices, such as smart phones, the information may be presented in only a limited fashion, with brief video or audio descriptions of the traffic conditions on specific portions of roads.

Method used


Image

  • Personalized traffic reports
  • Personalized traffic reports
  • Personalized traffic reports

Examples


first embodiment

I. First Embodiment

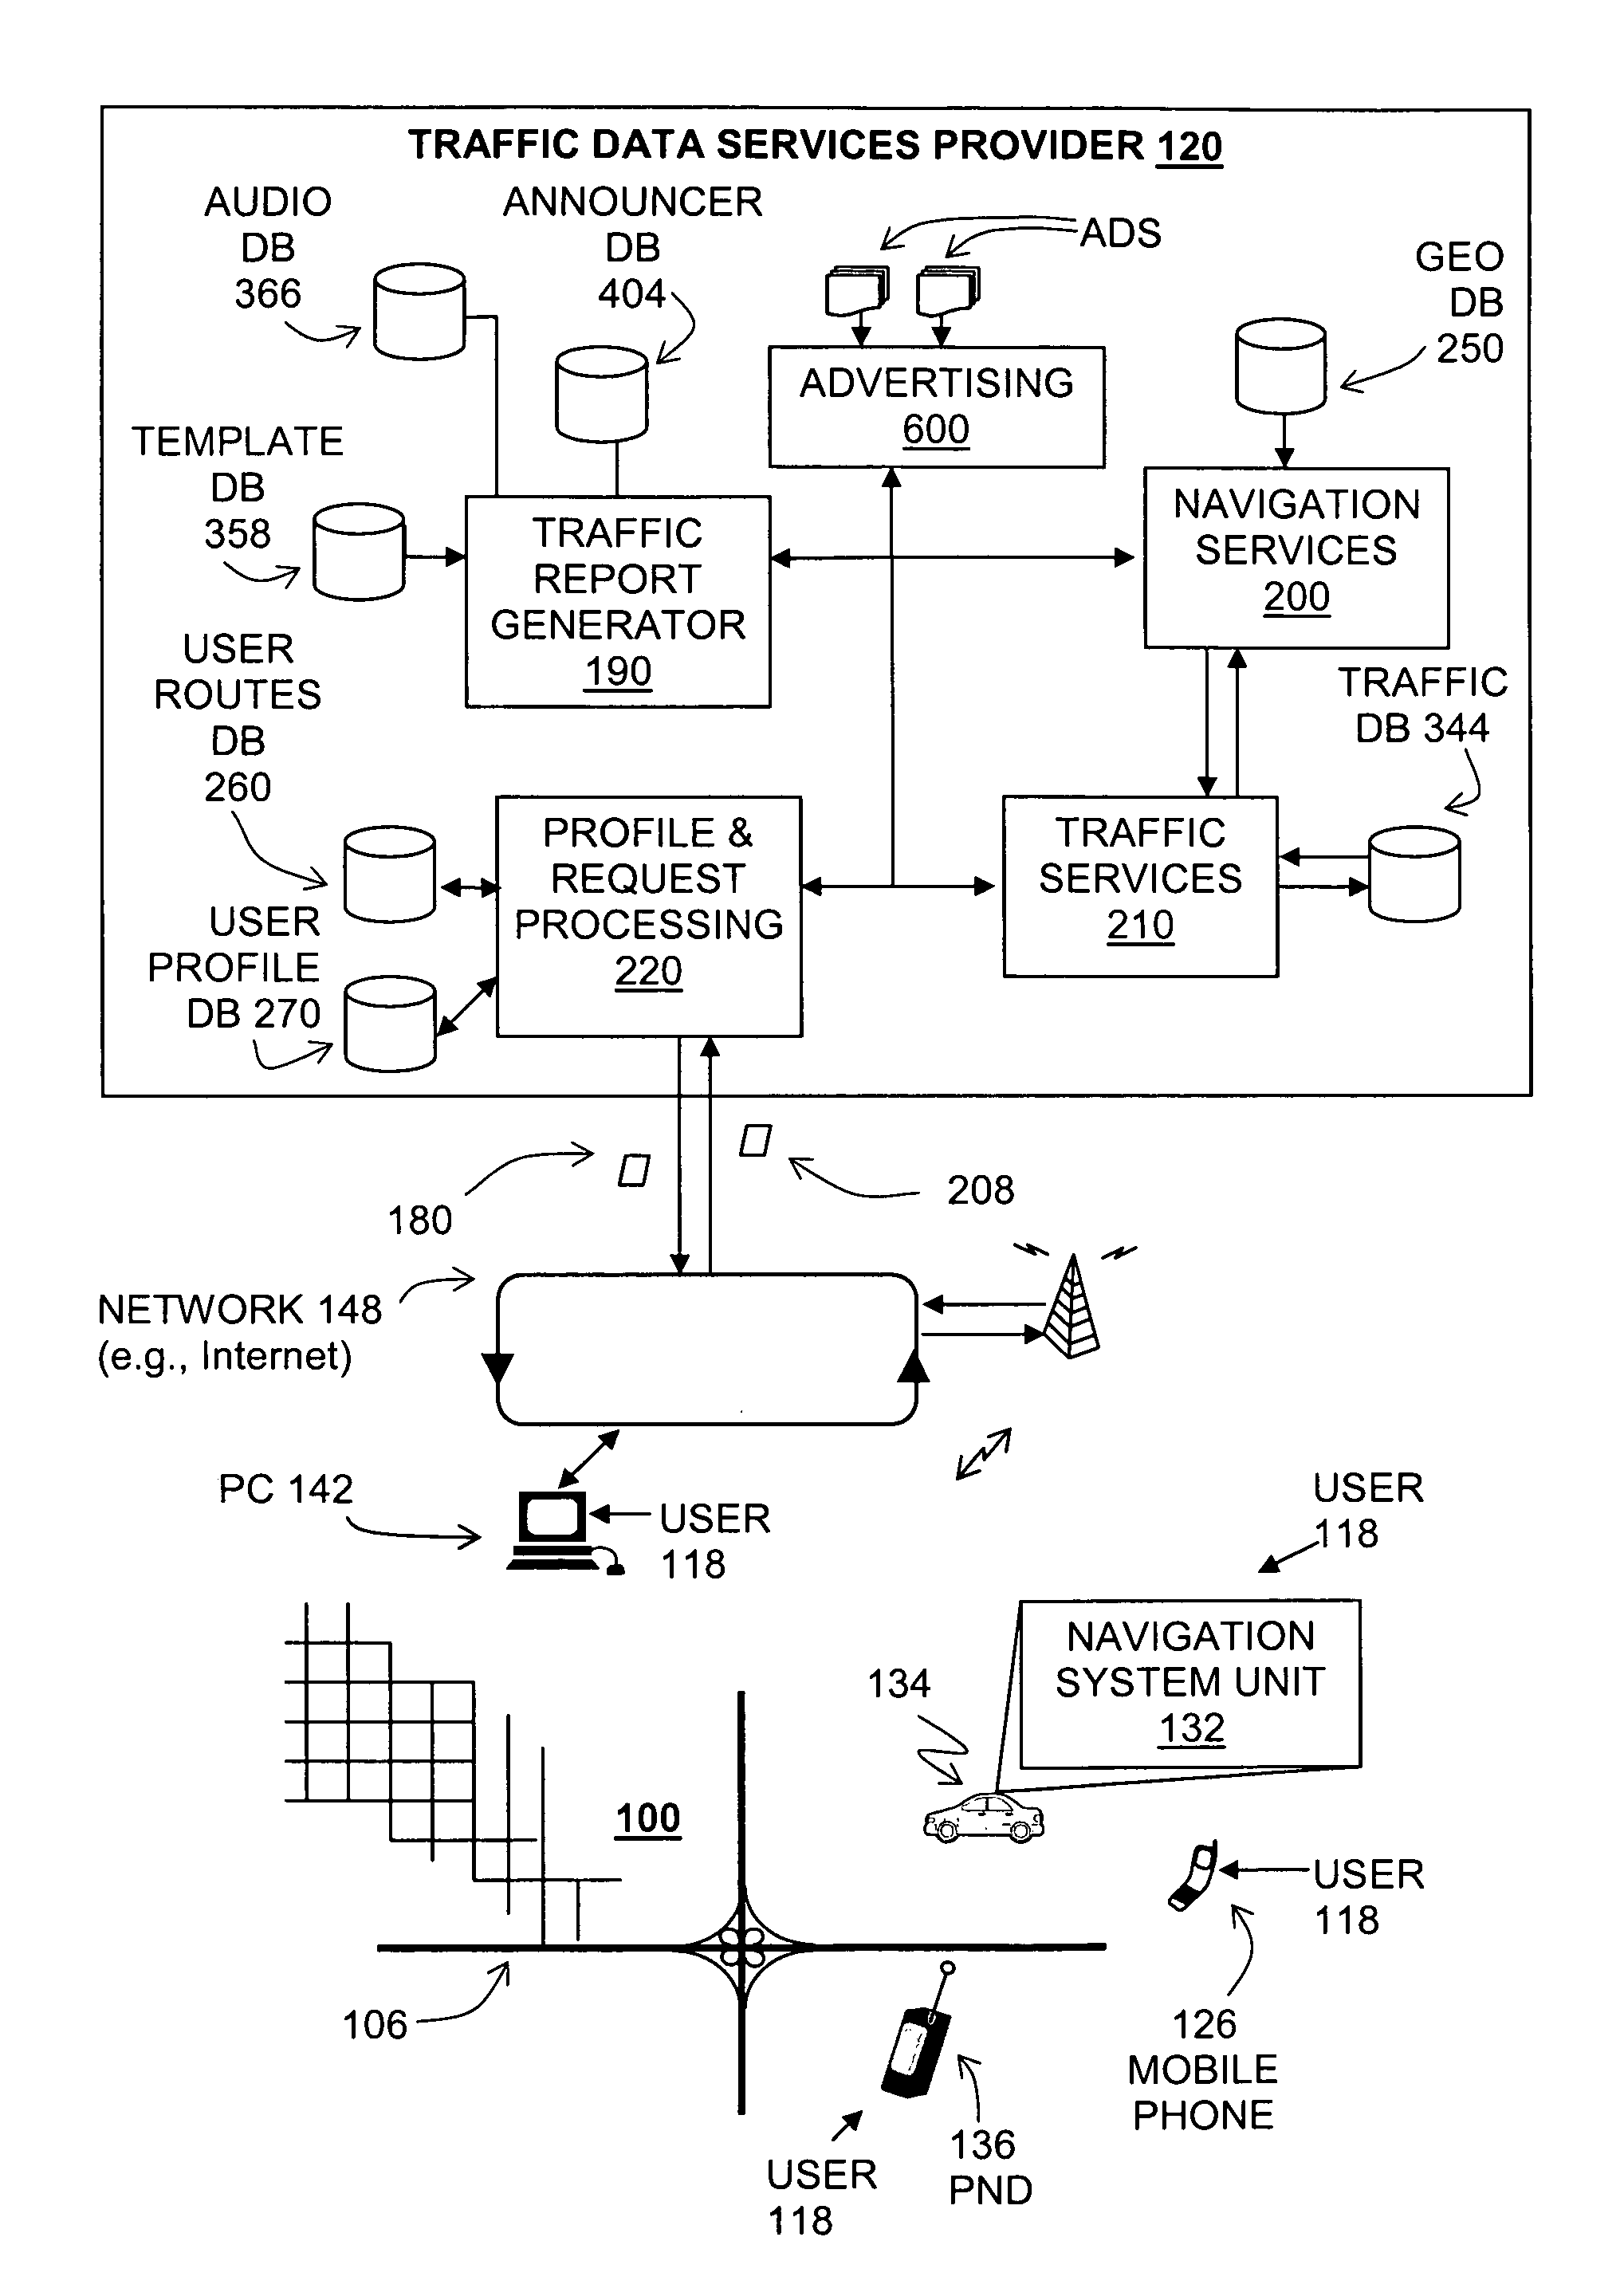
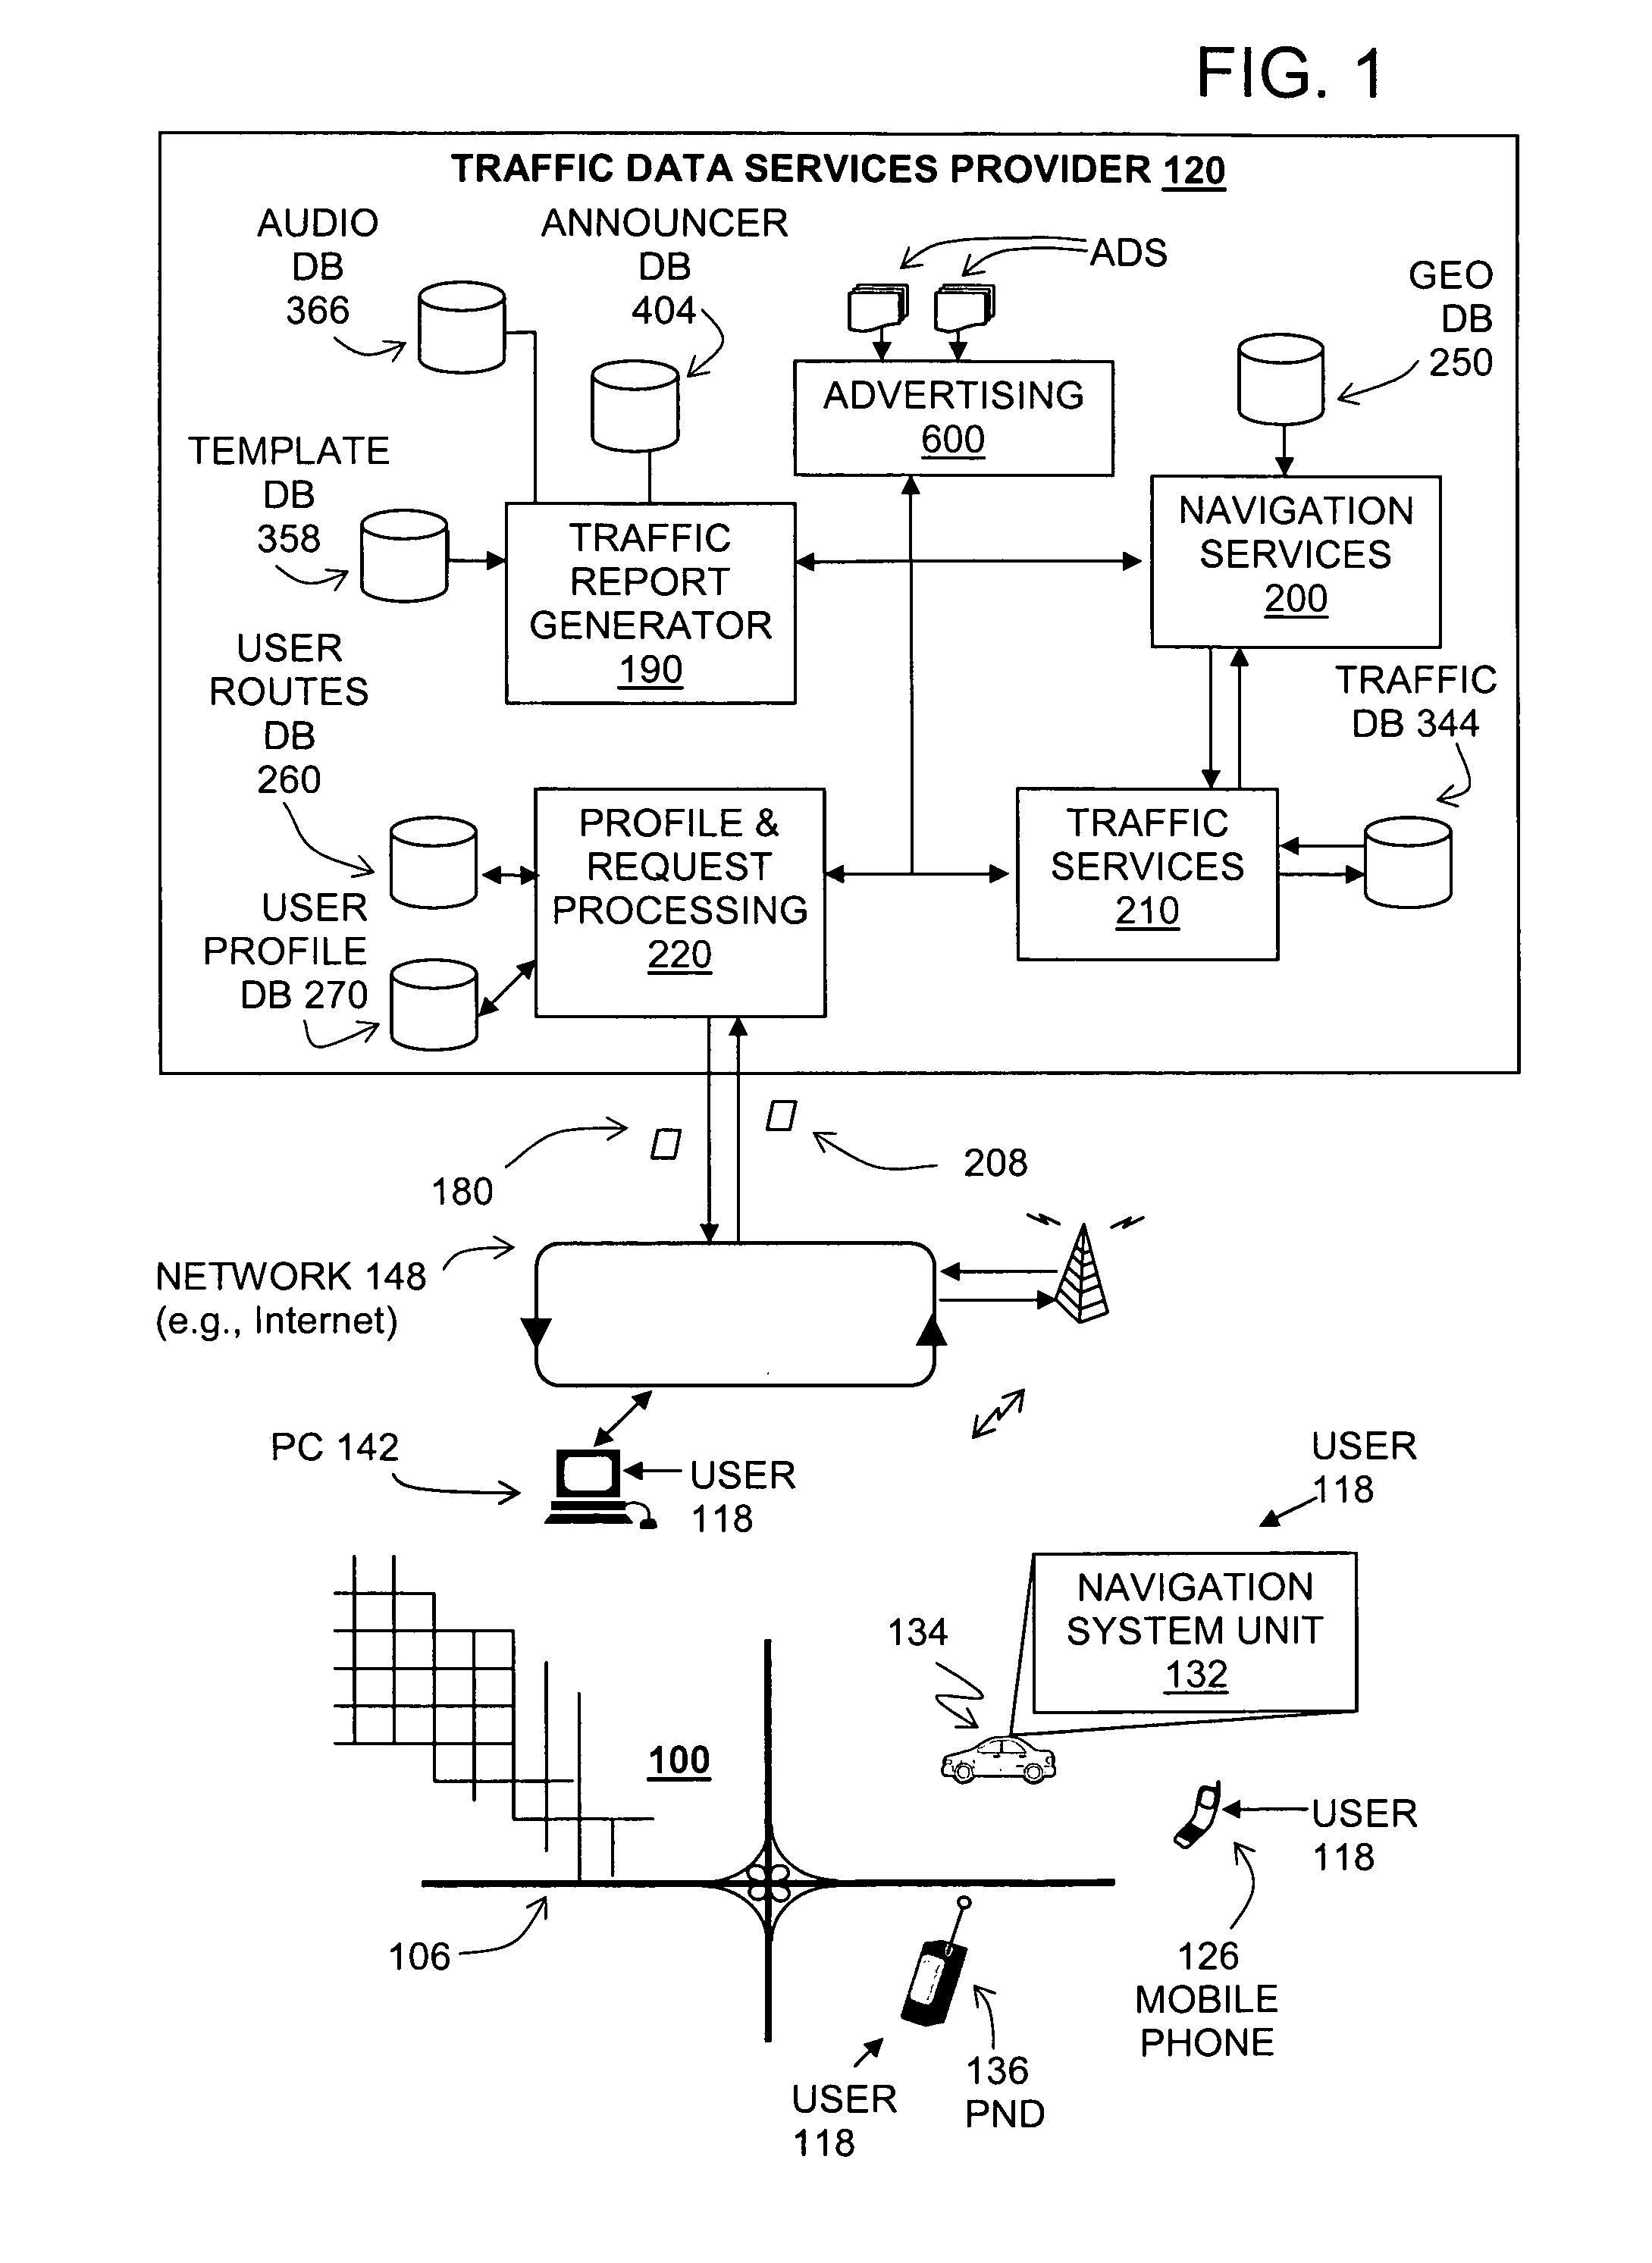
[0010]FIG. 1 is a diagram of system for providing personalized traffic reports to users. FIG. 1 shows a geographic region 100. The geographic region 100 may correspond to a metropolitan area, a state, a province or a country or combinations of portions thereof. A road network 106 is located in the geographic area 100.

[0011]Users 118 operate various computer platforms to access a traffic data services provider 120. The various computer platforms may include mobile phones 126, vehicle navigation systems 132 (located in vehicles 134) with wireless network access, personal navigation devices (“PNDs”) 136, or personal computers (“PC”) 142. The various computer platforms may include other types of devices. The various computer platforms may be located in the geographic area 100 or may be located elsewhere. The various computer platforms have the appropriate hardware and software to send and receive data. The various computer platforms use one or more data networks 148, ...

examples

[0054]FIG. 4 shows an example of a display screen 500 of an end user's computing device, such as a mobile phone. On the display screen is a scene 502 from a personalized traffic report formed by the process of FIGS. 3A and 3B. The scene 502 shows an animation 504 of traffic conditions along a users' route 506. The scene is synchronized with an audio narrative composed of audio clips. The audio narrative is presented during display of the scene 502 on the end user's computing device. The audio narrative is presented as a “voice over,” i.e., without the announcer being visually present in the scene. In FIG. 4, the audio narrative includes a description 508 of the traffic conditions being displayed.

[0055]FIG. 5 shows another example of a scene 514 from a personalized traffic report formed by the process of FIGS. 3A and 3B. The scene 514 is being shown on the display screen 500 of the end user's computing device. The scene 514 shows an animation 516 of traffic conditions along a users' ...


PUM


Abstract

A method and system are disclosed for providing personalized traffic reports. A personalized traffic report is a relatively short, audio-visual presentation that includes an audio narrative by an announcer describing the traffic conditions along a user's selected route, synchronized with a video presentation that includes maps with animations showing the traffic conditions and a visual representation of the announcer. A traffic data services provider determines traffic conditions that pertain to a user's identified particular route, i.e. from an origin to a destination. Then, the traffic data services provider forms an audio-video file that includes an audio narrative in the voice of an announcer that describes the traffic conditions along the user's route, along with a visual map representation of the user's route, a graphical indication of the traffic conditions along the route, and a visual representation of the announcer. The traffic data services provider transmits the audio-video file of the personalized traffic report to the user, who then plays it back on a computing device.

Description

BACKGROUND OF THE INVENTION[0001]The present invention relates to providing traffic information to users.[0002]Traffic information is available to vehicle drivers, travelers, commuters, pedestrians, as well as others, from a variety of sources. For example, drivers and others can obtain traffic information from radio or television broadcasts. These sources may have timely, detailed and rich information. These sources may also be presented using narrative explanations provided by professional announcers that add clarity. However, radio and television traffic broadcasts are intended for general audiences and may not be relevant to the user's specific location or route. Moreover, users may have to wait through a long broadcast traffic report while traffic information is provided about areas that are not relevant to the user's travel plans.[0003]Traffic information is also available from various web sites. Traffic information web sites allow users to find traffic information that is rel...

Claims


Application Information

Patent Timeline
IPC IPC(8): G08G1/123G08G1/09G06T15/00G06F15/16G06T13/00G01C21/00G06Q30/00G06F40/00
CPCG01C21/3694G06T13/00G08G1/096775G08G1/096741G08G1/096716
Inventor MACLEOD, JOHN
Owner HERE GLOBAL BV
Learn More