Code Execution Visualization Using Software Fingerprinting

a fingerprinting and code technology, applied in the field of software performance analysis, can solve the problem of not providing any indication of the function call during program execution, and achieve the effect of rapid and easy identification, dramatic performance gains, and optimized performan

Active Publication Date: 2010-08-05
APPLE INC
View PDF10 Cites 12 Cited by
  • Summary
  • Abstract
  • Description
  • Claims
  • Application Information

AI Technical Summary

Benefits of technology

[0009]A need therefore exists for a system, method, and tool for analyzing software performance characteristics that overcomes the limitations of the prior art. The present invention improves upon the prior art by presenting code execution information in such a way that conveys information pertaining to function usage. The present invention provides for the visual display of code execution data such that repetitive patterns and excessively deep function calls can be readily identified as areas in need of improvement (i.e., areas having suspect performance). Thus, the present invention allows for quick and efficient analysis of code execution by quickly finding areas of code that can be improved in order to optimize software performance.
[0011]By graphically displaying code execution chronologically, certain patterns in the code execution paths may be quickly and easily identified. Such patterns represent specific call patterns through the code. For example, repeated patterns in a graph in accordance with the invention indicates loops that walk through the same functions. Once recognized as an area in need of improvement, such areas may be optimized by, for example, removing invariant calculations from within a loop. Furthermore, areas of code having excessively deep function calls can be readily spotted. Such areas generally represent inefficient call sequences which can likely be improved to optimize performance. Oftentimes, dramatic performance gains may be achieved by optimizing only a small number of key functions which are responsible for the vast majority of CPU time used by a program.

Problems solved by technology

While prior art tools provide information about where time is being spent and how often functions are called, they do not provide any indication of how the function was called during program execution.

Method used


Image

  • Code Execution Visualization Using Software Fingerprinting
  • Code Execution Visualization Using Software Fingerprinting
  • Code Execution Visualization Using Software Fingerprinting

Examples


Embodiment Construction

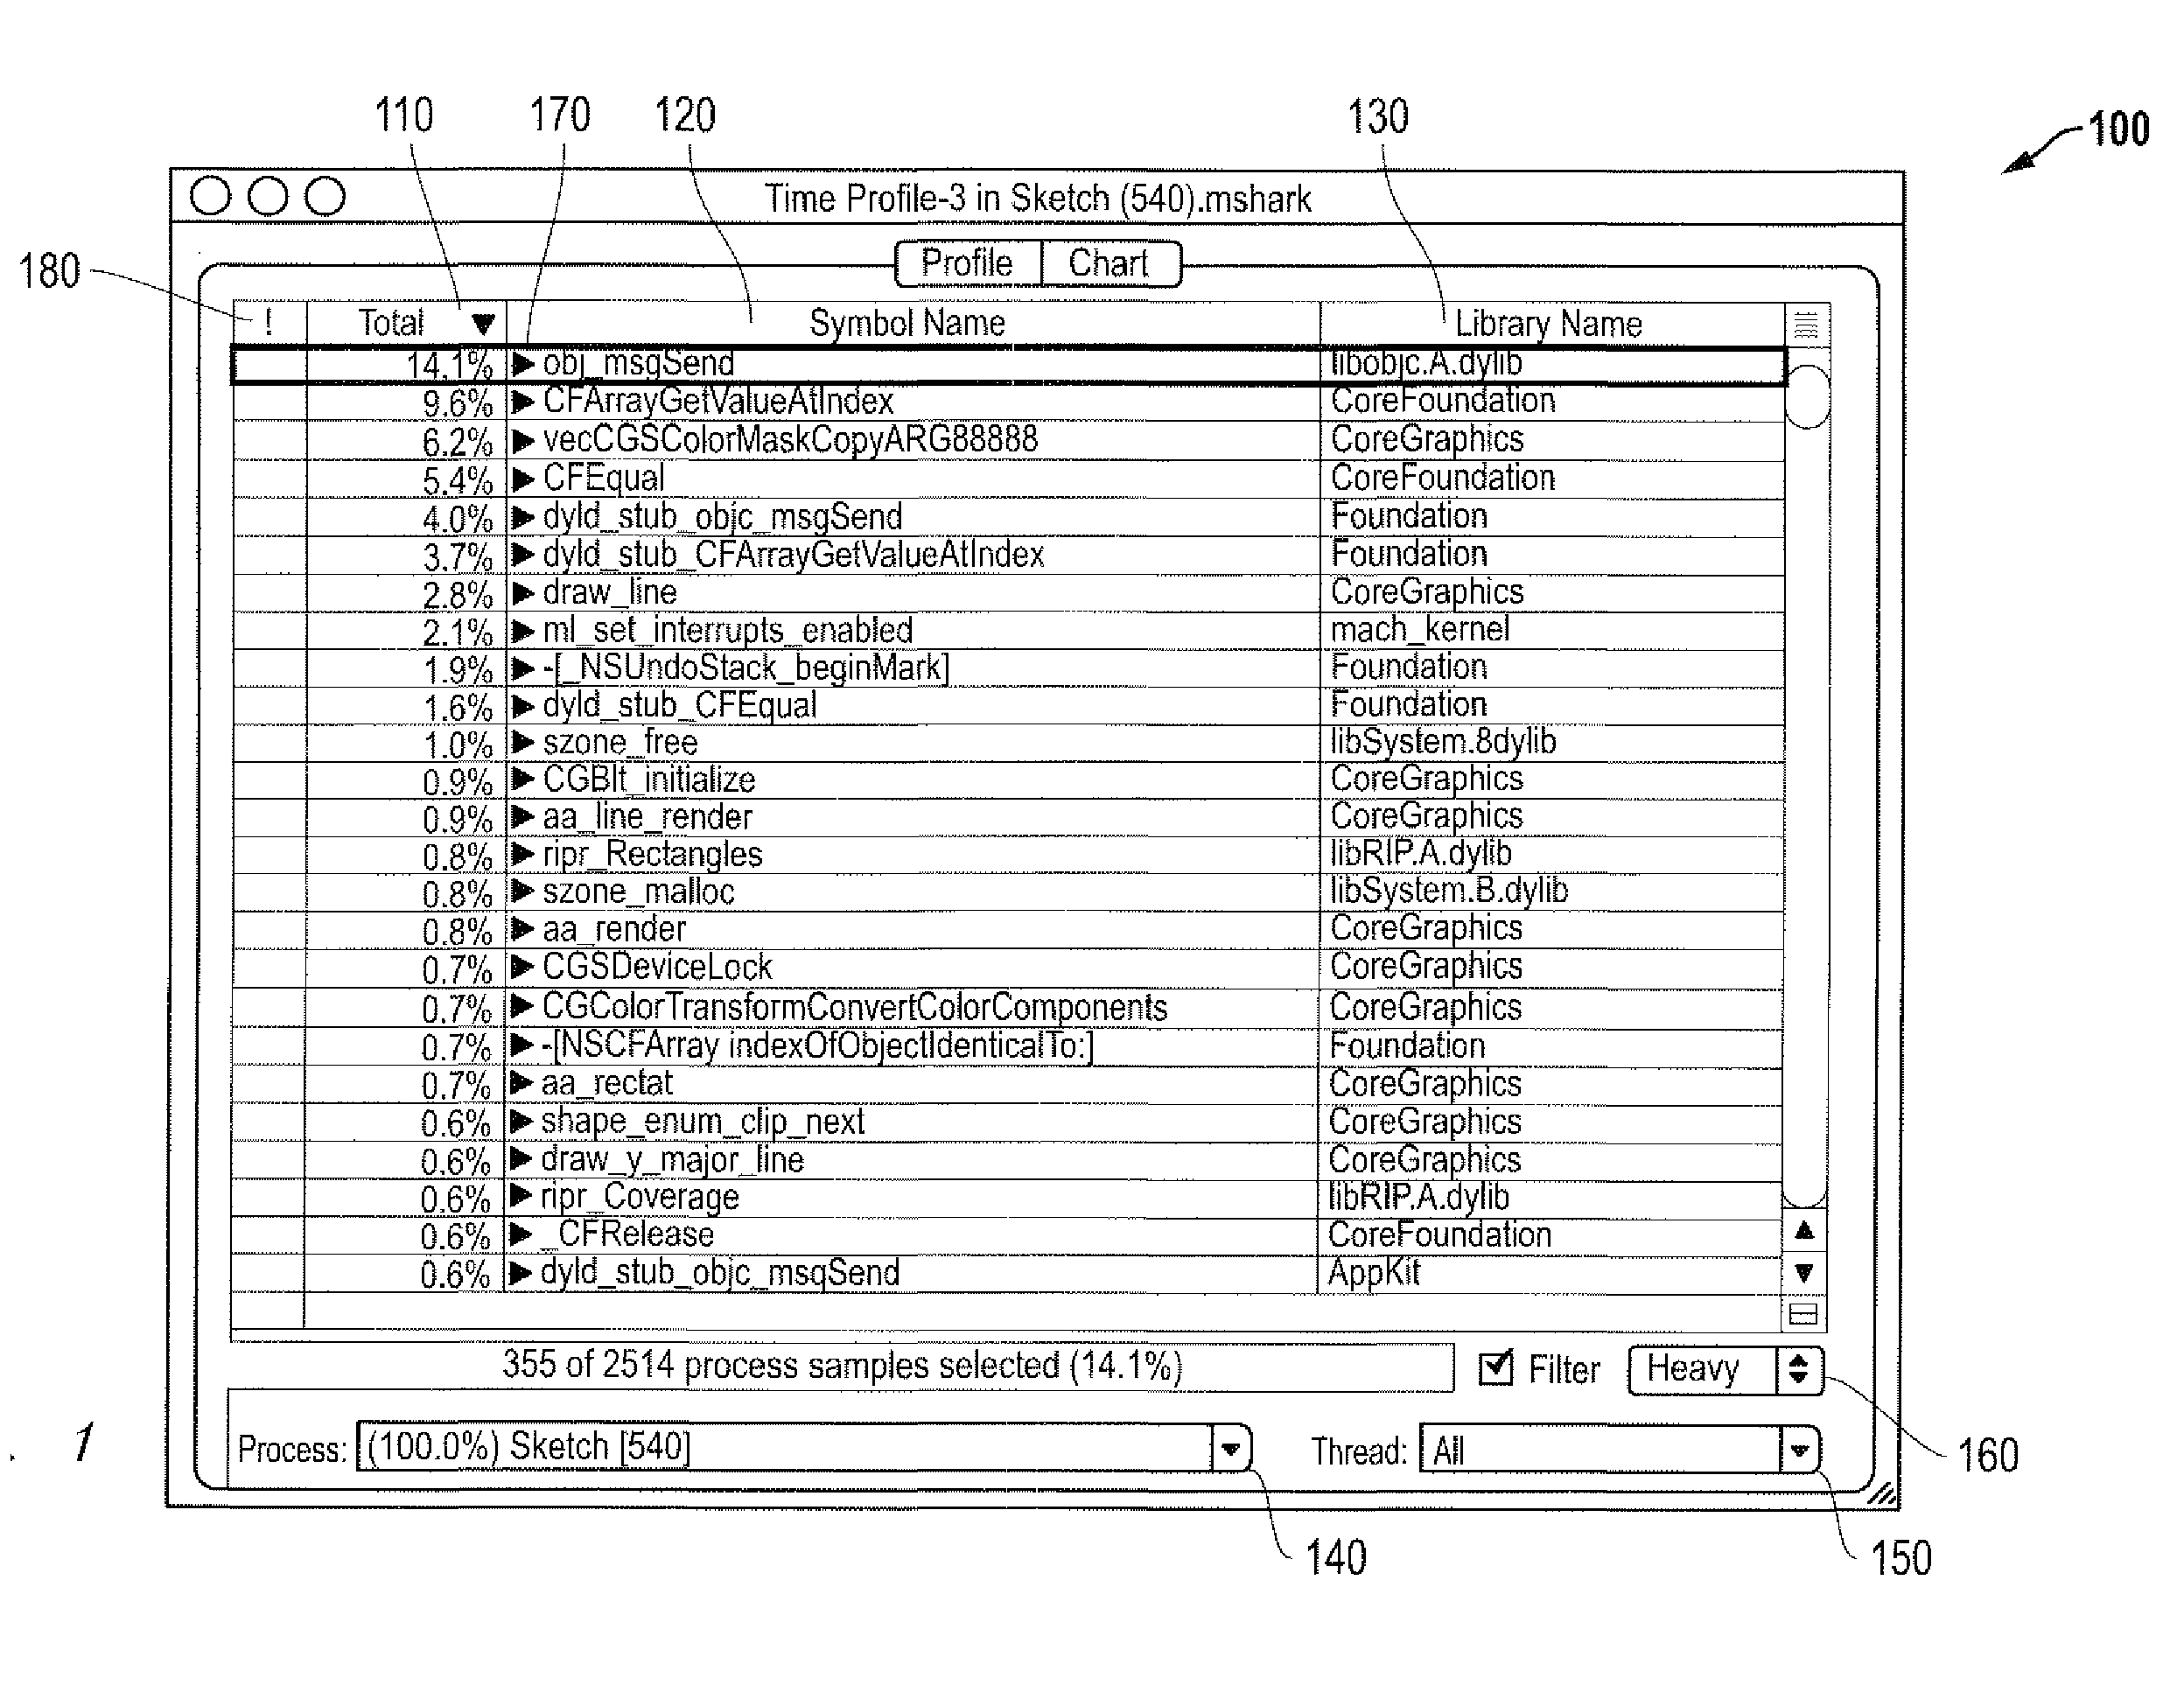
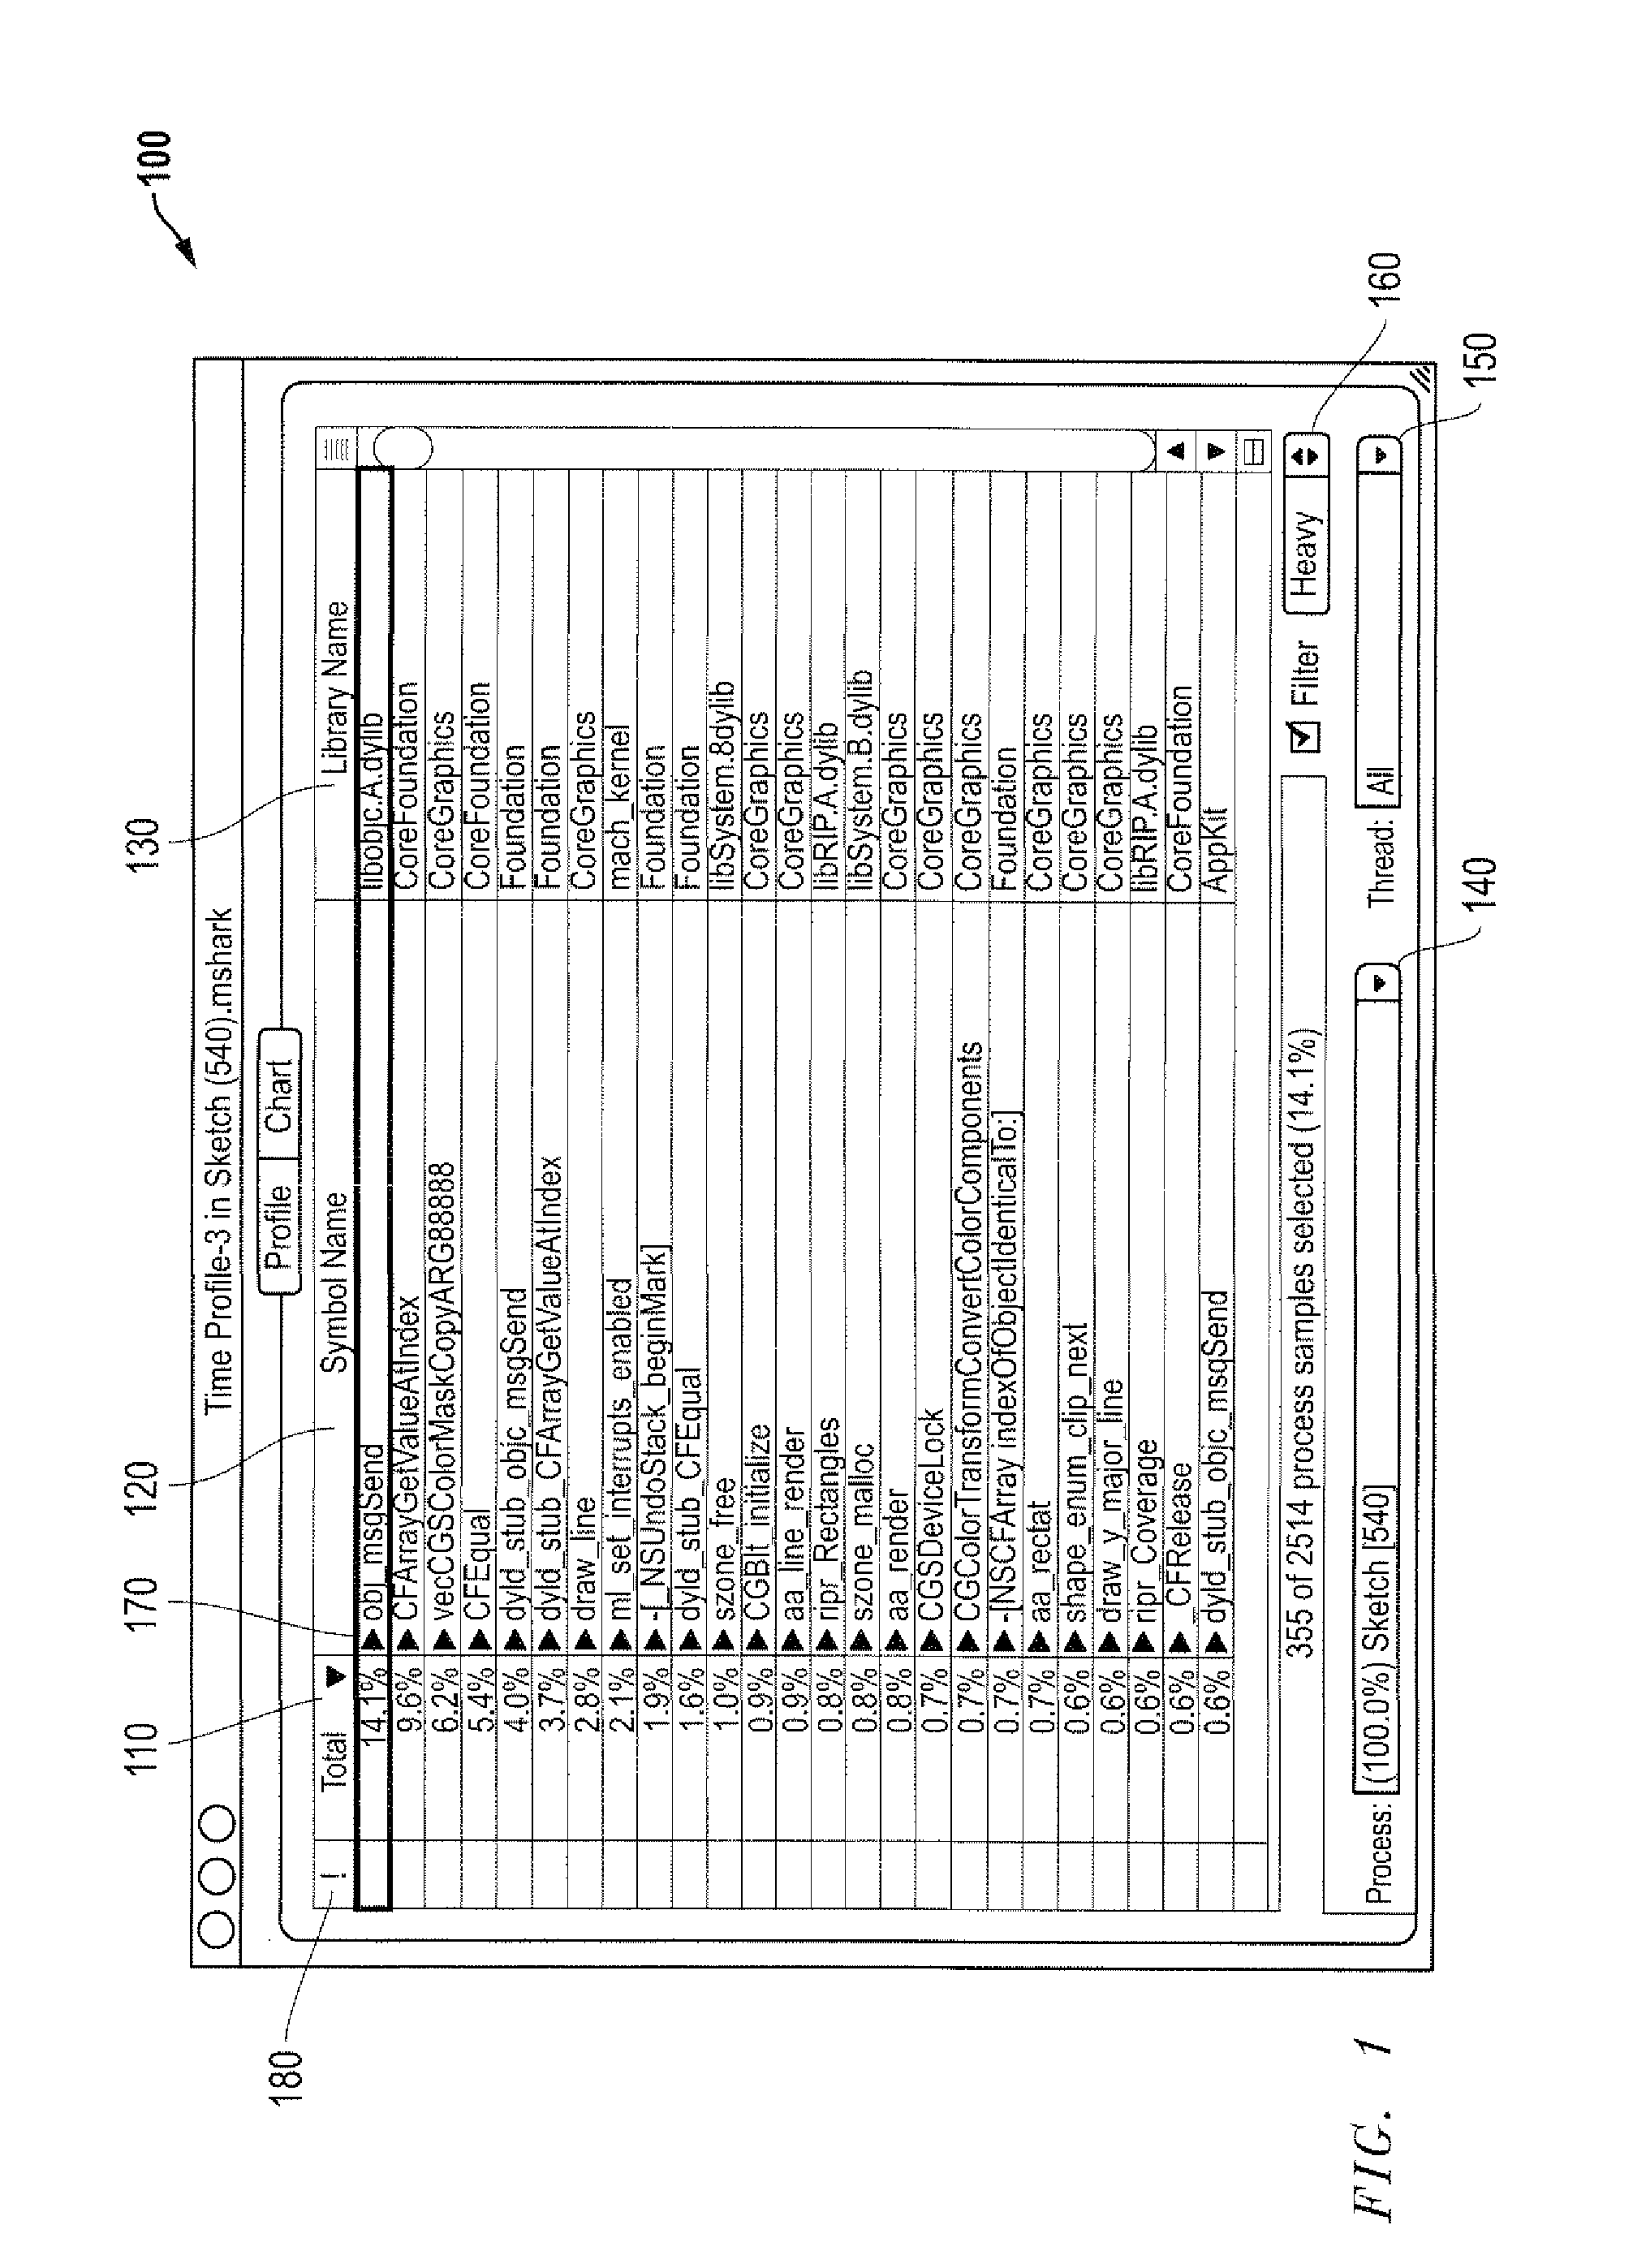
[0024]When processes are running on a computer system, the processes and the system CPU and memory can be “sampled” at runtime. Samples may be taken continuously, for example, during a particular time period while the software is running Samples may also be taken periodically, for example, at specified time intervals (time-based sampling). Programs can also be sampled when various events occur at runtime. The samples provide a statistical representation of how much CPU time is spent in each function. Samples may be taken, for example, based on a specified function call (function call sampling), memory allocation calls (memory allocation sampling), or on a specified hardware or OS event such as an application crash, page fault, cache miss, instruction stall, or other event of interest (event sampling). Various other sampling configurations may provide interesting termination events.

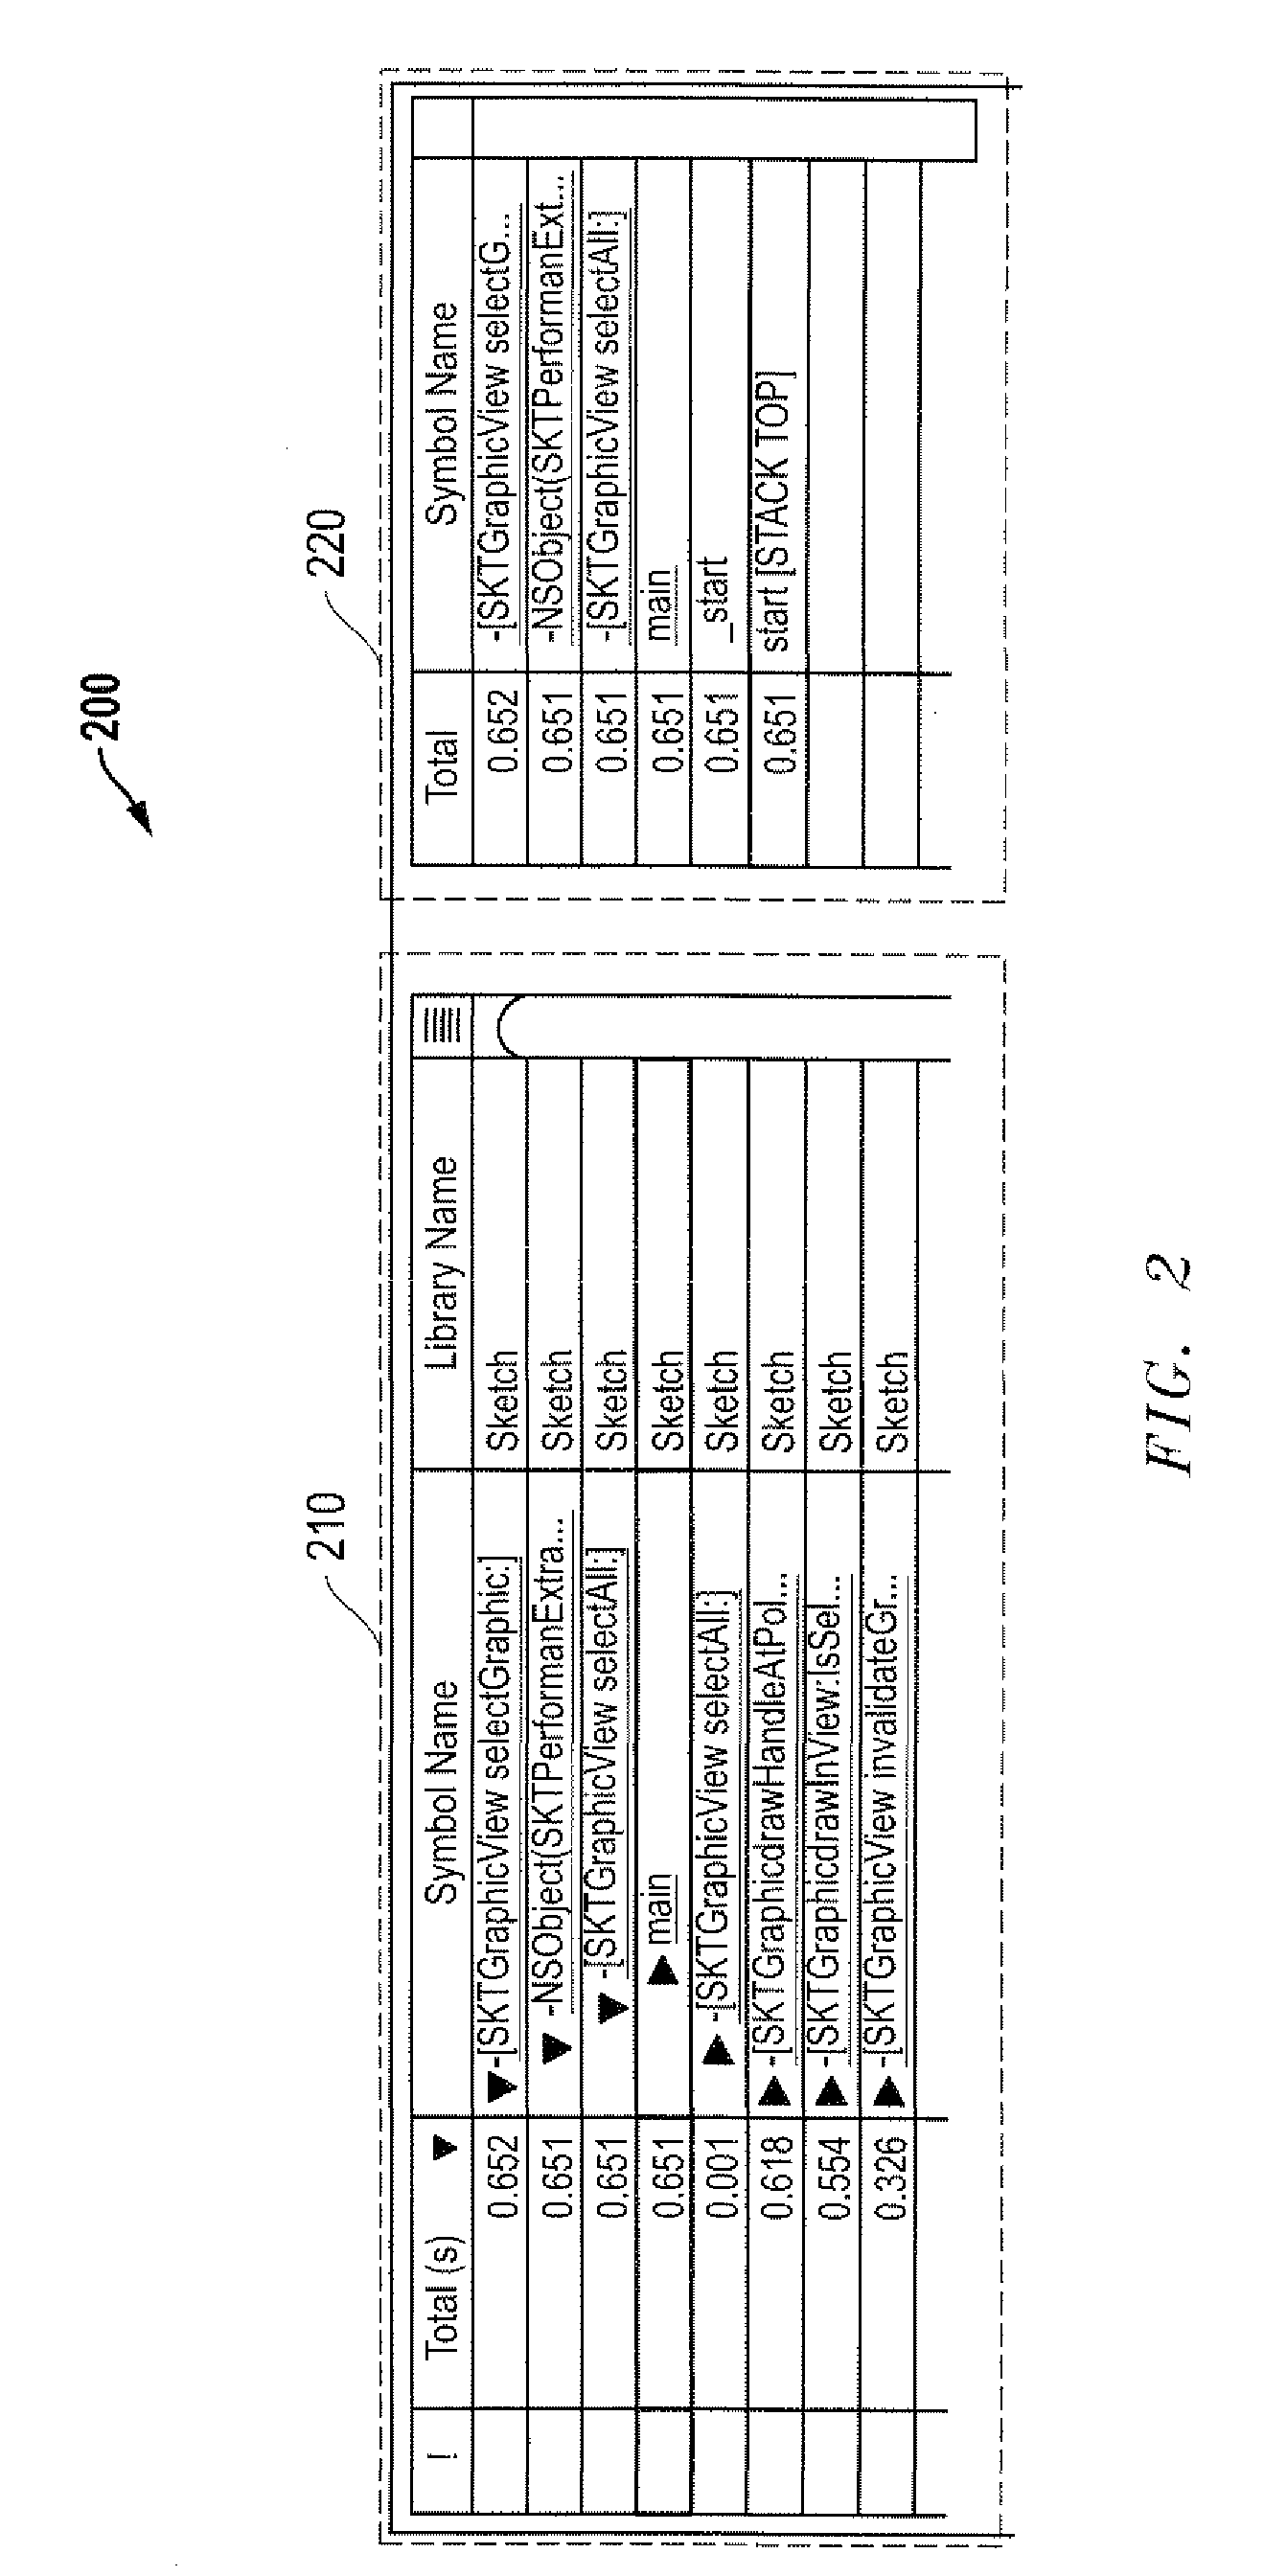
[0025]When a sampling run is complete, the trace table can be analyzed to build a single (“top-down”) f...


PUM


Abstract

A system, method, and computer program for analyzing code execution and software performance characteristics are disclosed. Samples of executing code may be taken based on any of a number of various triggers. For example, samples may be triggered based on function calls, such as malloc calls. Alternatively, samples may be triggered based on occurrence of a specified event. Code execution is graphically displayed such that certain patterns may be easily identified. Multiple redundant function calls and areas of code having excessively deep function calls can be readily spotted. Such areas represent opportunities for performance optimization.

Description

BACKGROUND OF THE INVENTION[0001]1. Field of the Invention[0002]The present invention relates generally to analyzing software performance, and more particularly, to a system, method, and program for graphically presenting code execution data in order to quickly identify of areas of code which may represent opportunities for optimization.[0003]2. Related Application Information[0004]This application is a continuation of application Ser. No. 10 / 871,487 filed 18 Jun. 2004, entitled “Code Execution Visualization Using Software Fingerprinting” by Christina E. Warren et al. which is incorporated by reference herein in its entirety and to which priority is claimed.RELATED ART[0005]Performance is an important aspect of software design. If an application does not perform well, users will not likely want to use that application. Performance is a subjective term referring to the general way in which something operates. Performance may include how efficiently system resources (e.g., CPU, memory...

Claims


Application Information

Patent Timeline
Patent Type & Authority Applications(United States)
IPC IPC(8): G06F9/44
CPCG06F11/323G06F11/3409G06F11/3471G06F2201/885G06F2201/86G06F2201/88G06F11/3664
Inventor WARREN, CHRISTINA E.PATEL, SANJAY K.SLINGERLAND, NATHAN
Owner APPLE INC
Why Eureka
Try Eureka