Ultrasonic diagnostic apparatus, ultrasonic image processing method, and ultrasonic image processing program
a diagnostic apparatus and ultrasonic technology, applied in diagnostics, medical science, instruments, etc., can solve the problem that the image of proper elasticity cannot be obtained, and achieve the effect of high precision
- Summary
- Abstract
- Description
- Claims
- Application Information
AI Technical Summary
Benefits of technology
Problems solved by technology
Method used
Image

Examples
first embodiment
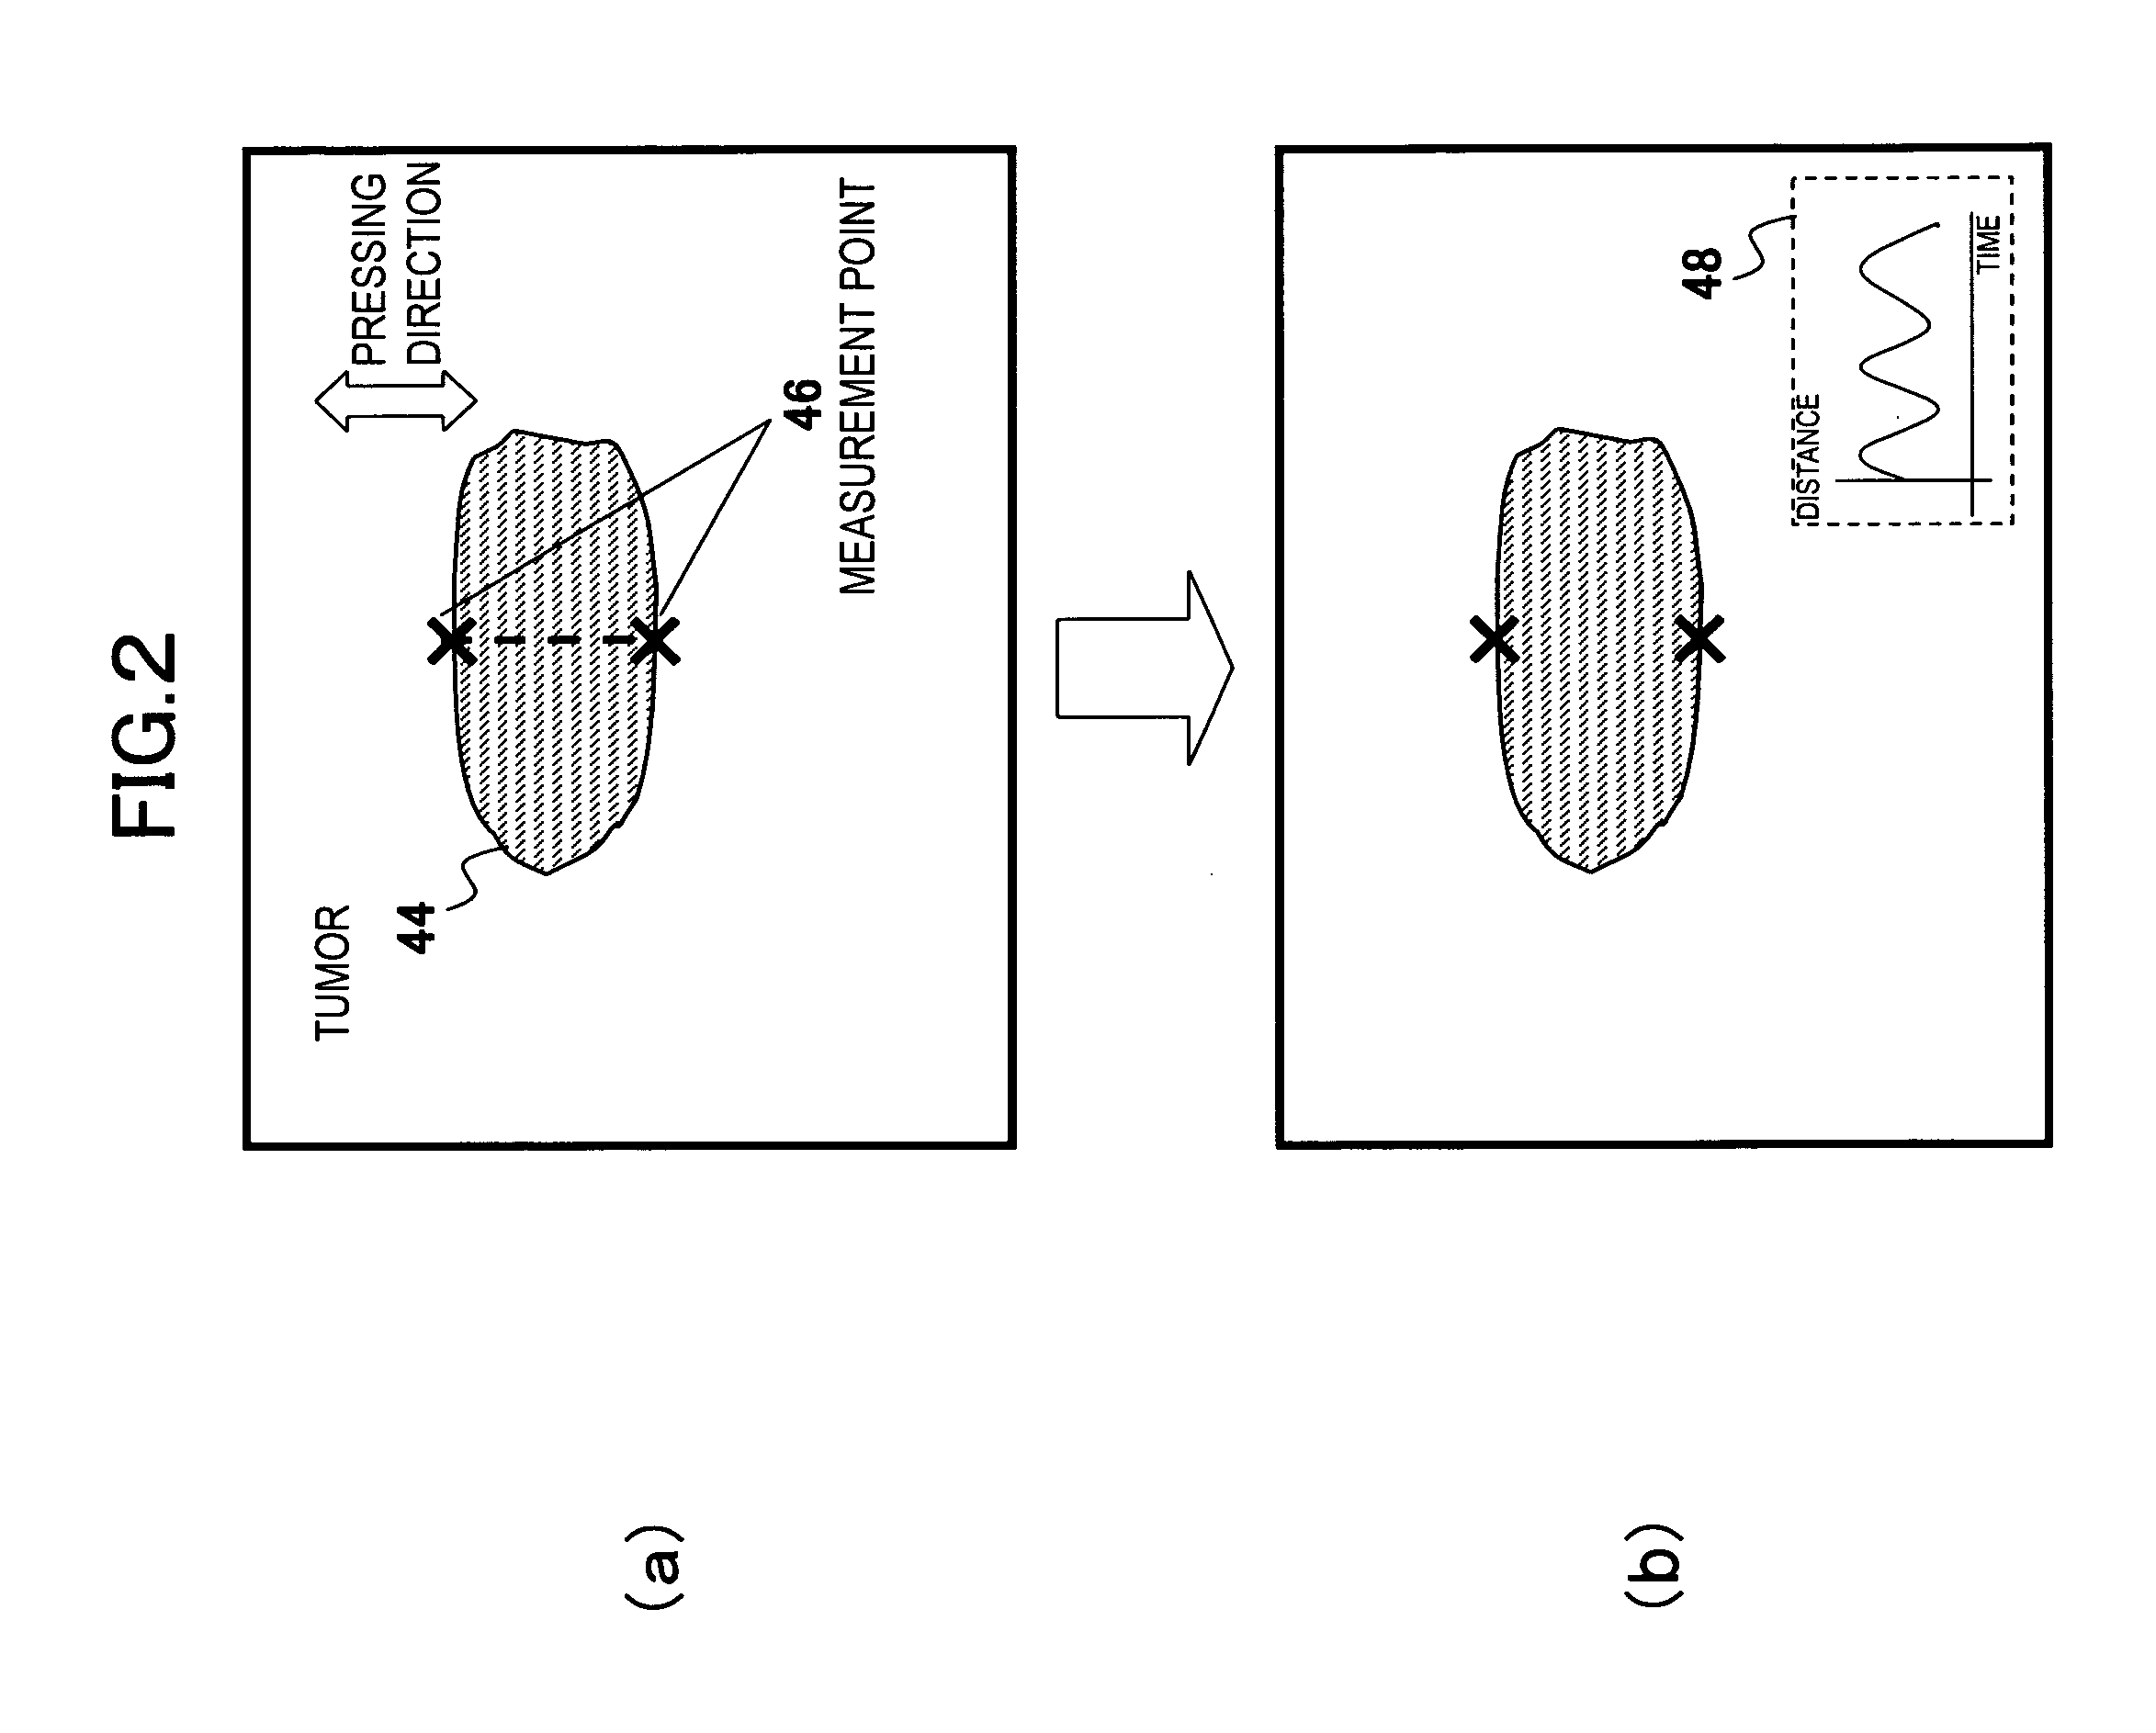
[0051]FIG. 2 is a diagram showing a first embodiment of a feature portion of an ultrasonic diagnostic apparatus according to this embodiment, and schematically shows a setting example of the measurement point and a graph generated in this case. FIG. 3 is a flowchart showing the processing of the first embodiment.
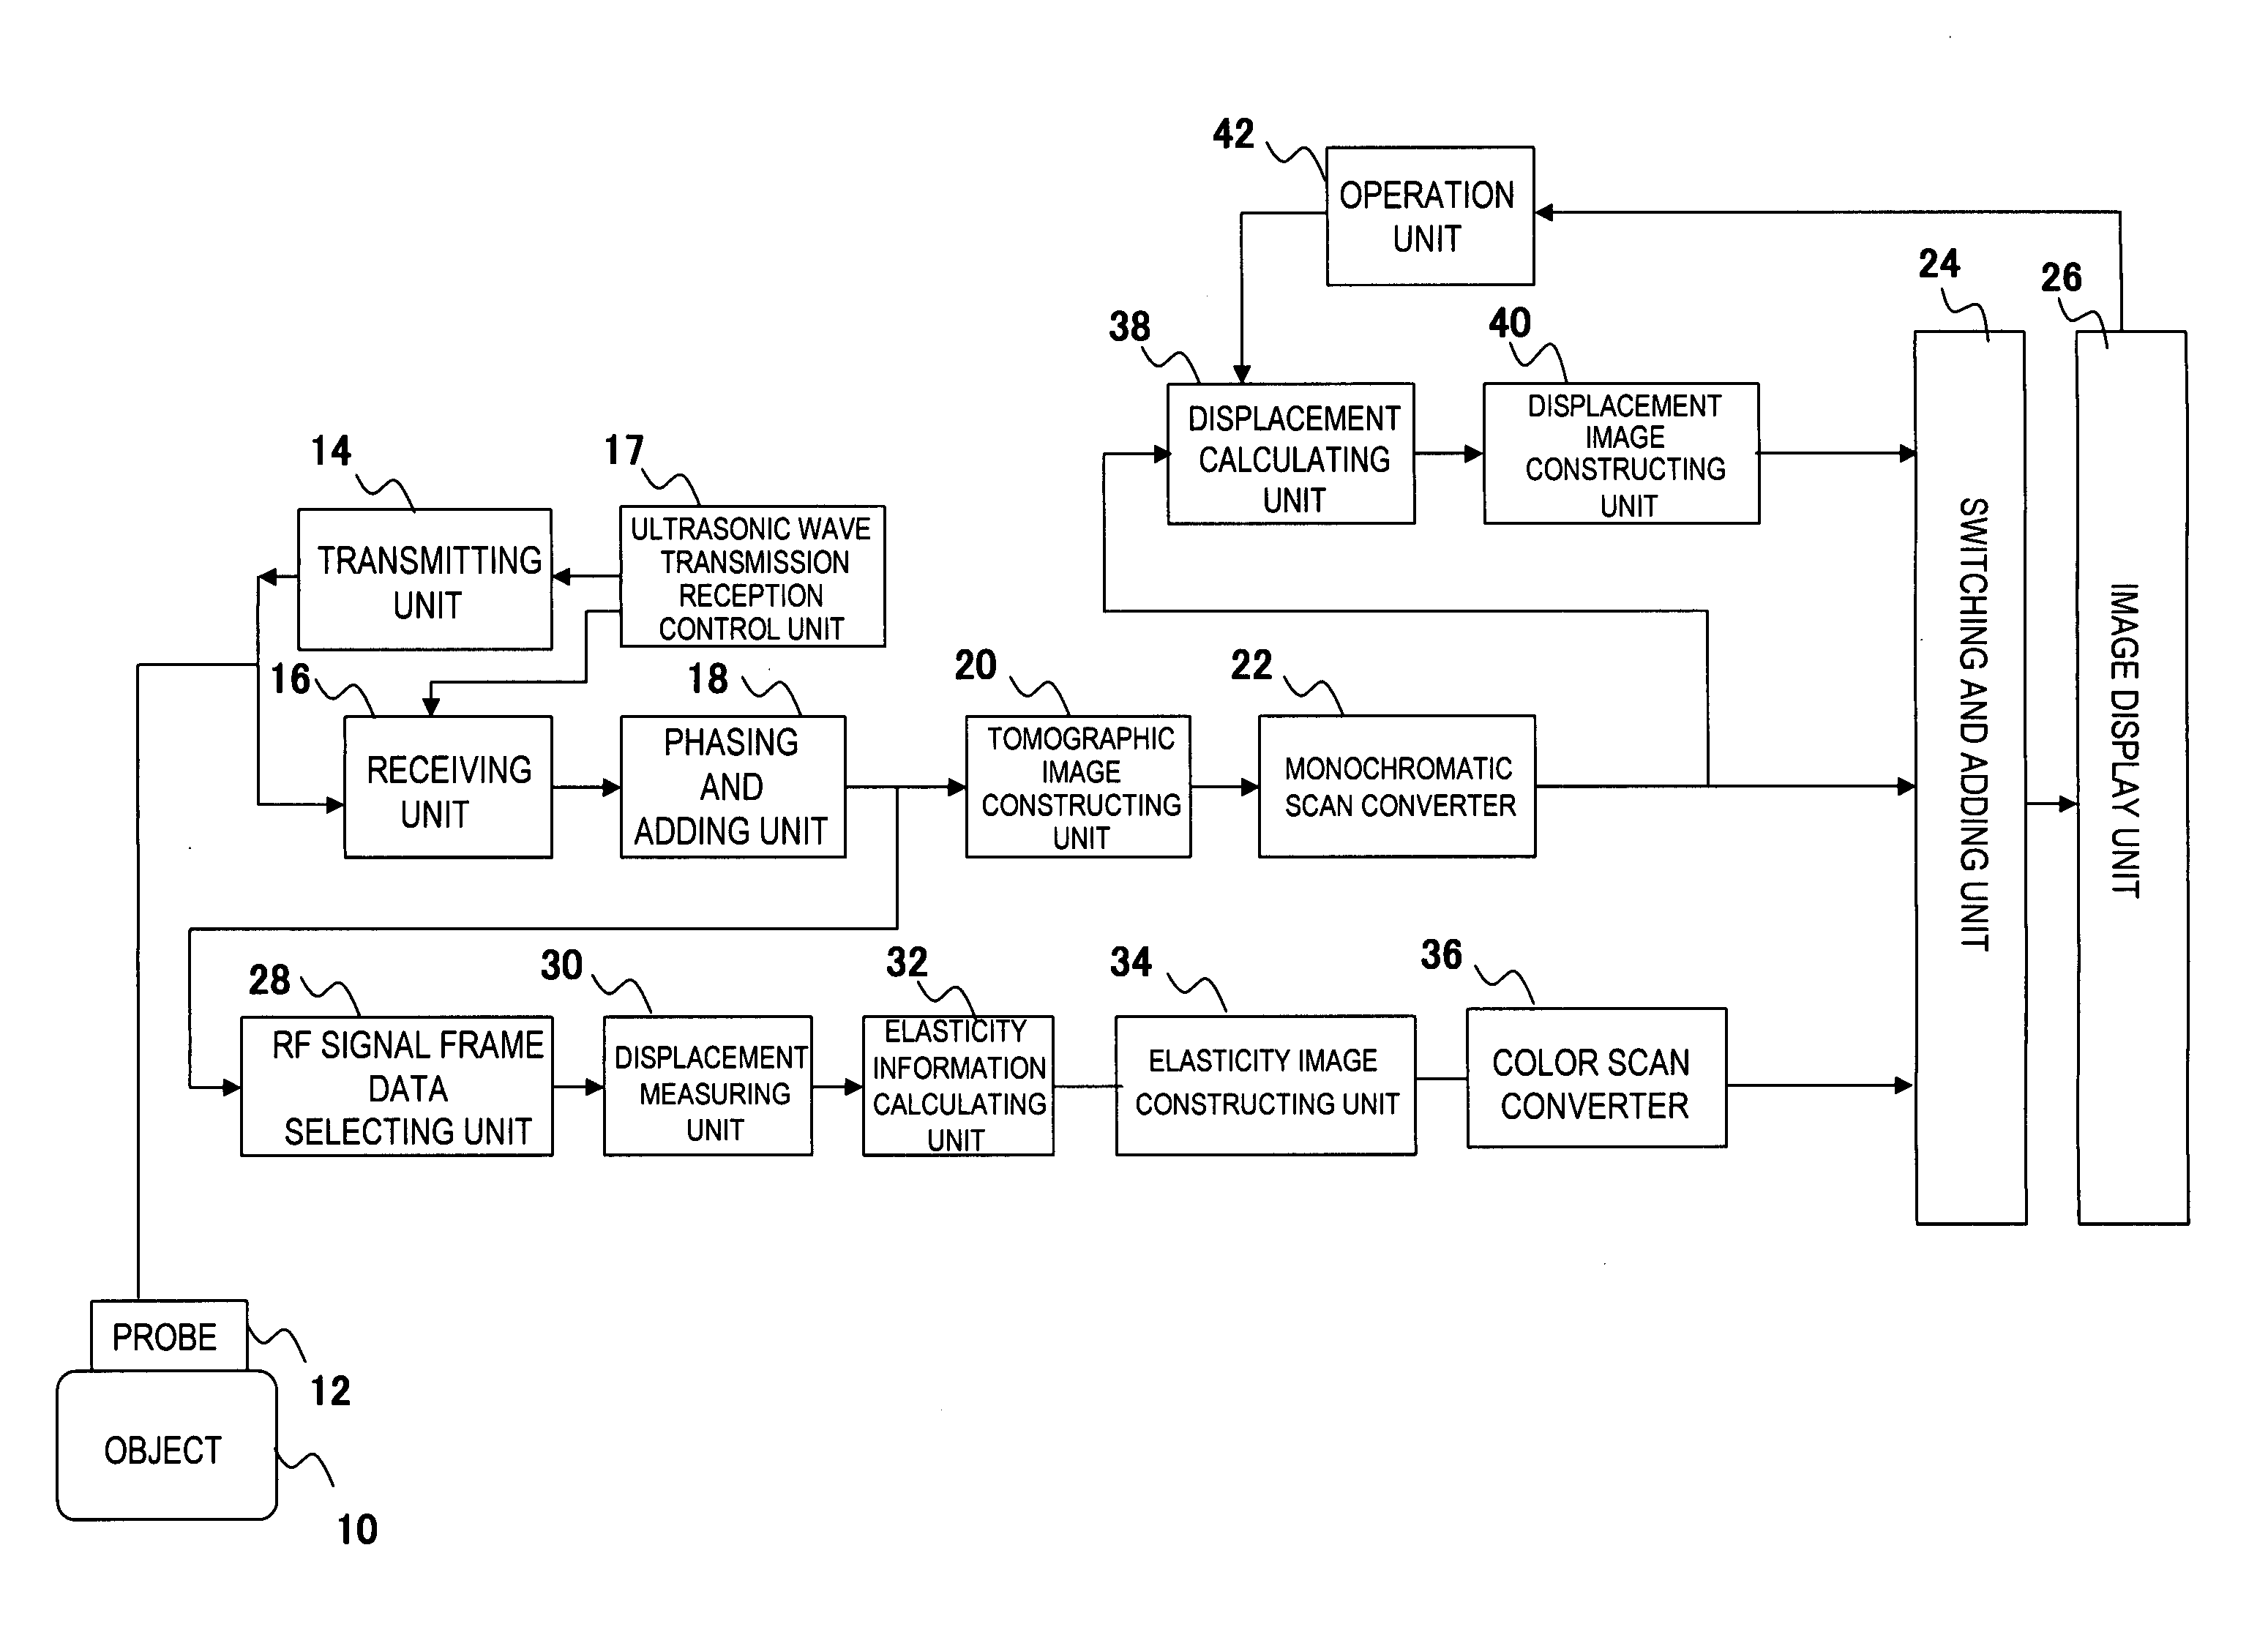
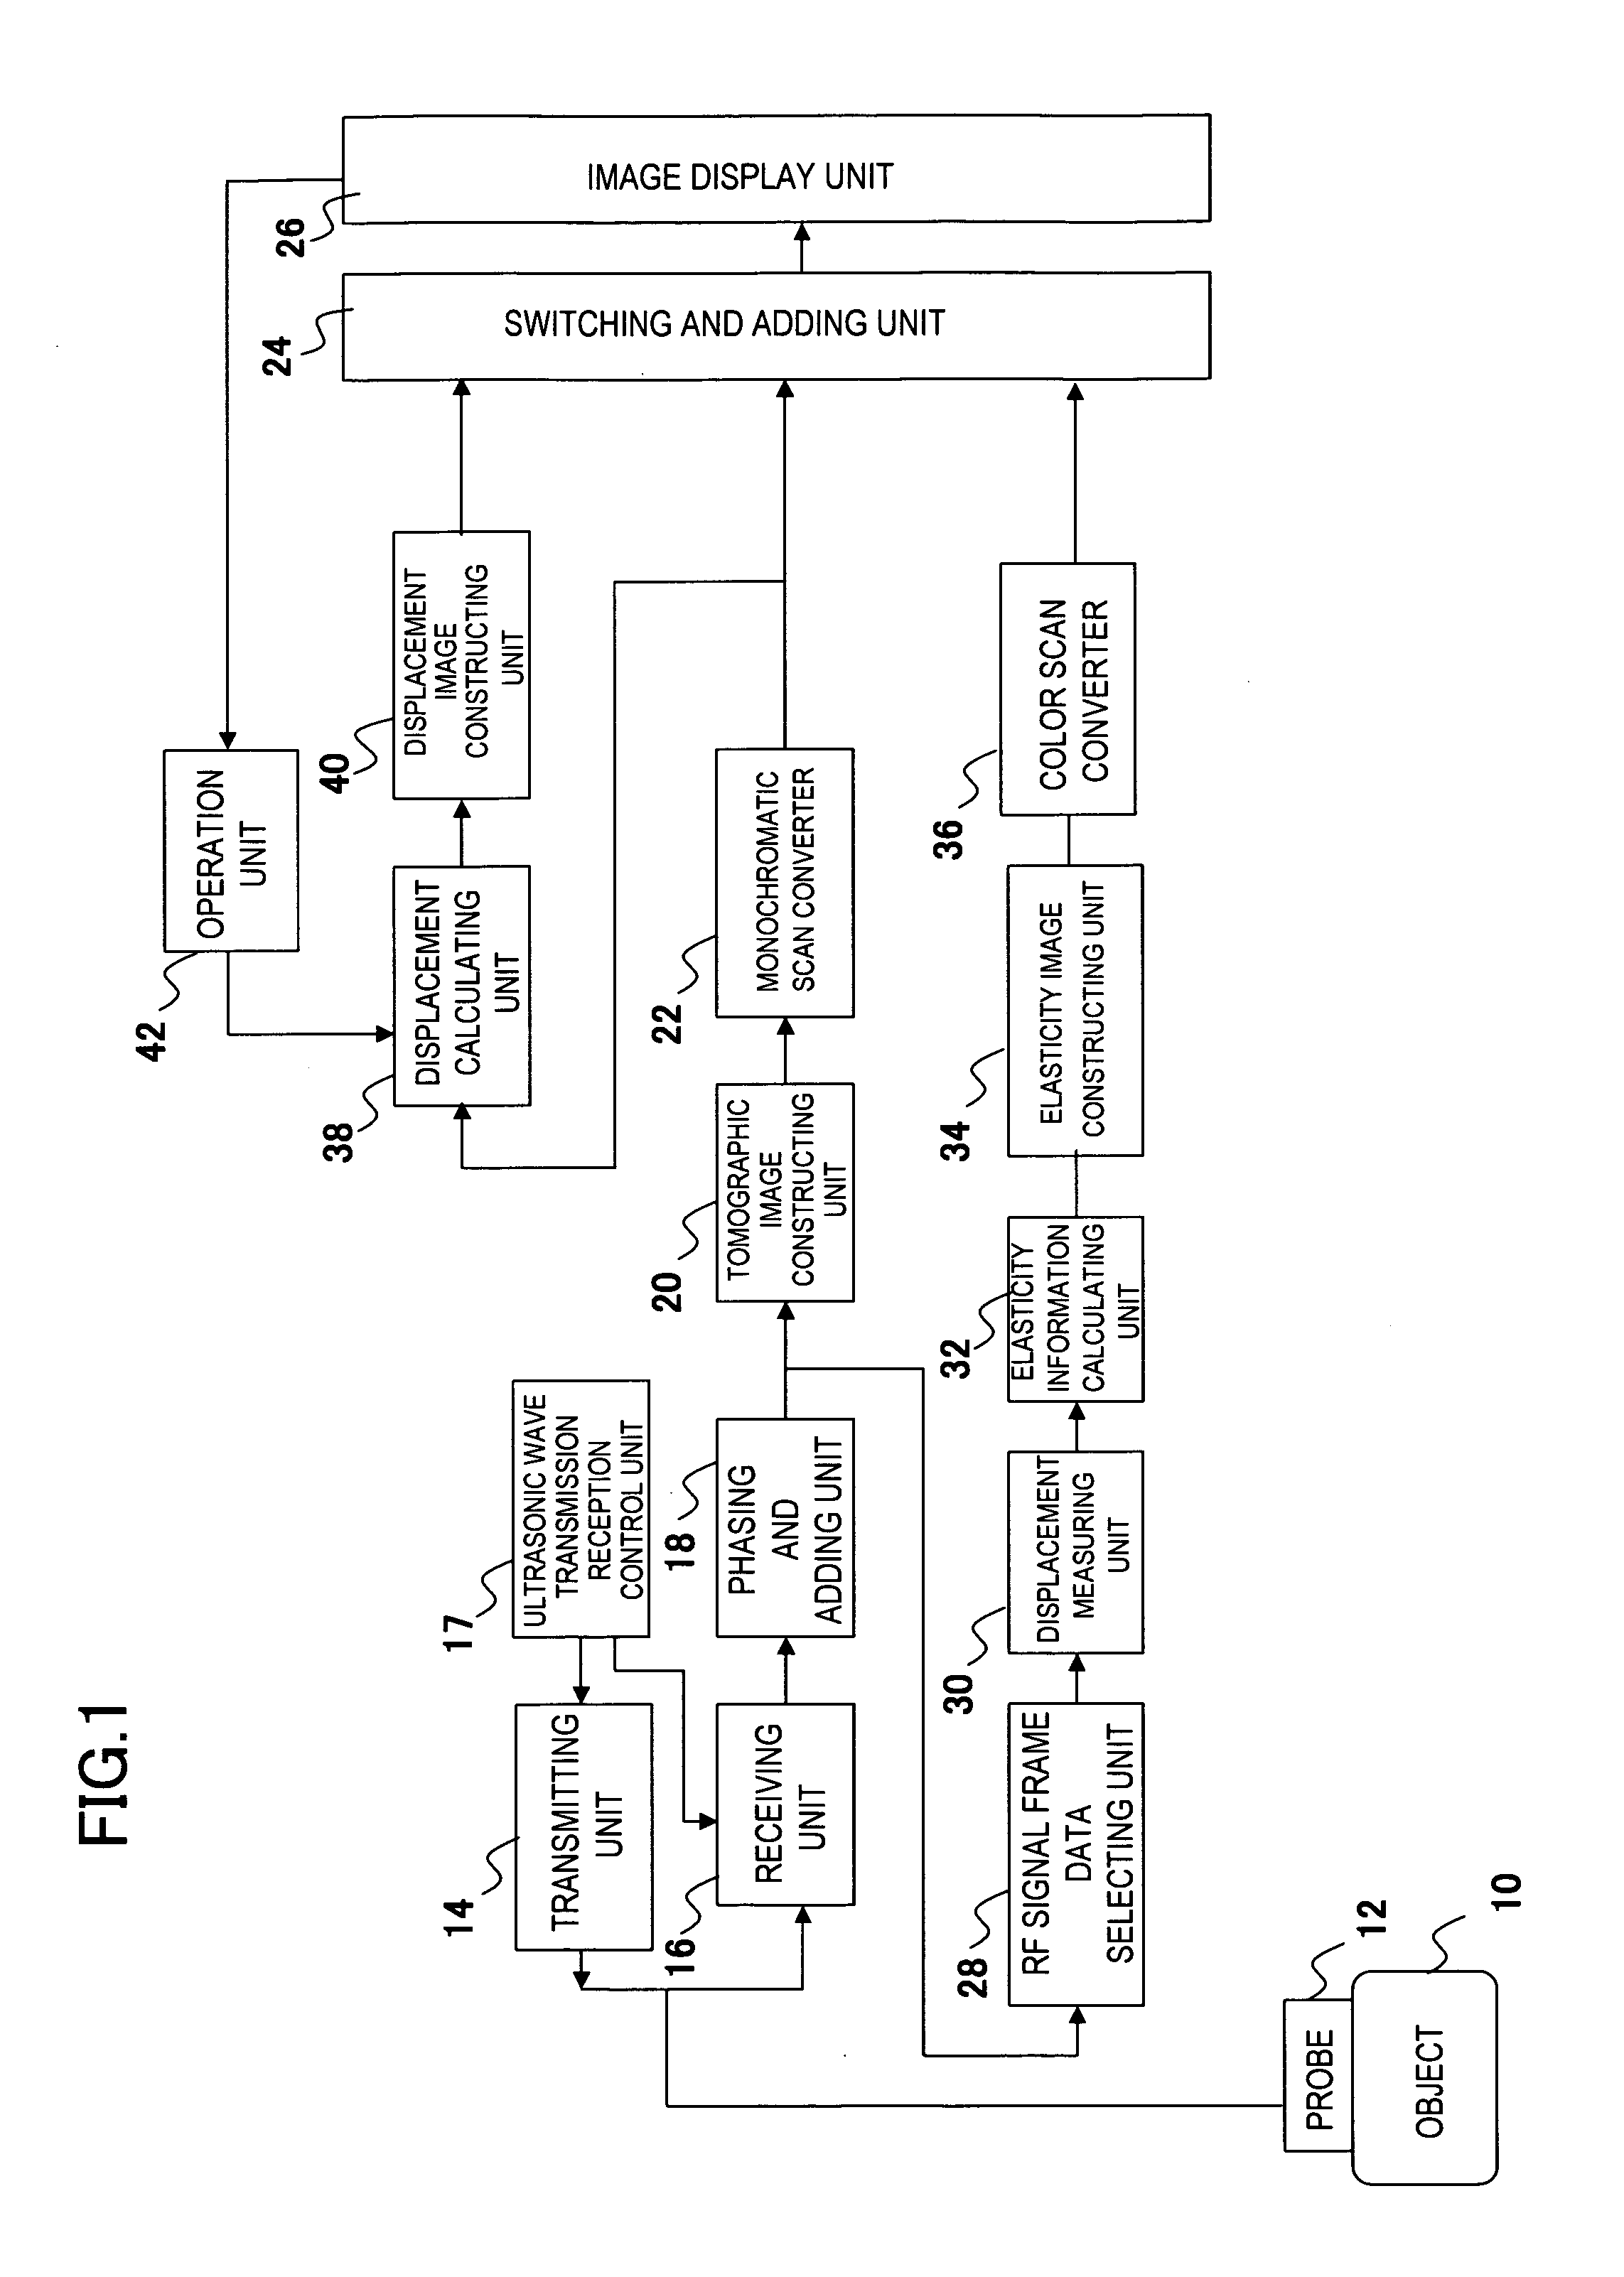
[0052]As shown in FIG. 2(a), two measurement points 46 are set along a pressing direction at a boundary portion of tumor 44. The displacement calculator 38 traces the two measurement points every frame by tracking or the like, and it calculates the distance between the two measurement points with respect to all frame memory data, and successively the result to the displacement image constructing unit 40. The displacement image constructing unit 40 generates transition of the distance variation between the two measurement points in the form of a graph 48.
[0053]The graph 48 output from the displacement image constructing unit 40 is added and combined by the switching and addin...
second embodiment
[0057]FIG. 4 is a diagram showing a second embodiment of the feature portion of the ultrasonic diagnostic apparatus according to this embodiment, and shows an image generated to support the operator's proper pressing operation. FIG. 5 is a flowchart showing the processing of the second embodiment.
[0058]In this embodiment, the center position of the graph is determined on the basis of plural local maximum points and local minimum points appearing on the graph 48, an amplitude threshold value line is superimposed and displayed at a predetermined amplitude position from the center position of the graph 48, and also a preset period line is superimposed and displayed on the graph 48.
[0059]Furthermore, the display style of a place at which at least one of the period line and the amplitude threshold value line on the graph 48 is deviated is changed to promote a proper pressing operation to the operator.
[0060]Specifically, as shown in FIG. 4(a), preset period lines 52 are superimposed and d...
third embodiment
[0067]FIG. 6 is a diagram showing a third embodiment of the feature portion of the ultrasonic diagnostic apparatus according to this embodiment, and schematically shows a setting example of the measurement point and a graph generated in this case. FIG. 7 is a flowchart showing the processing of the third embodiment.
[0068]As shown in FIG. 6(a), plural pairs of two measurement points along the pressing direction at the boundary portion of the tumor 44 are set at different positions in a direction perpendicular to the pressing direction. The displacement calculator 38 traces each measurement point every frame by tracking or the like, calculates the distance between the paired measurement points for all the frame memory data every pair of two measurement points, and successively outputs the calculation result to the displacement image constructing unit 40. The displacement image constructing unit 40 generates the transition of the distance variation between the measurement points in the...
PUM
 Abstract
Description
Claims
Application Information
 - R&D Engineer
- R&D Manager
- IP Professional
- Industry Leading Data Capabilities
- Powerful AI technology
- Patent DNA Extraction
Browse by: Latest US Patents, China's latest patents, Technical Efficacy Thesaurus, Application Domain, Technology Topic.
© 2024 PatSnap. All rights reserved.Legal|Privacy policy|Modern Slavery Act Transparency Statement|Sitemap