Gene expression signature for classification of kidney tumors

a gene expression and tumor technology, applied in the field of microorganisms, can solve the problems of generating a more difficult diagnostic challenge, limiting the accuracy of histological classification, and underlying biological mechanisms playing important roles in these tumors are yet to be elucidated

Inactive Publication Date: 2011-06-30
ROSETTA GENOMICS +1
View PDF4 Cites 1 Cited by
  • Summary
  • Abstract
  • Description
  • Claims
  • Application Information

AI Technical Summary

Benefits of technology

[0034]The invention further provides a method for distinguishing between papillary RCC and oncocytoma, the method comprising: obtaining a biological sample from a subject; determining in said sample an expression profile of nucleic acid sequences selected from the group consisting of SEQ ID NOS: 4, 5, 8-13, 25-27, 41-42, 45-47, a fragment thereof or a sequence having at least 80% identity thereto; and comparing said expression profile to a reference value; whereby a relative abundance of said nucleic acid sequences allows the detection of said papillary RCC or oncocytoma.

Problems solved by technology

The term “conventional cell” is used to replace the name “clear cell”, because some types have eosinophilic cytoplasm, generating a more difficult diagnostic challenge.
Such features as described above are characteristic of the histological subtypes, but inter-observer variations limit the accuracy of histological classification, with some types identified with a sensitivity of 70% or lower.
Furthermore, underlying biological mechanisms playing important roles in these tumors are yet to be elucidated.
However, the increasing number of smaller tumors and needle-biopsy procedures places a strain on immunohistochemical methods.

Method used


Image

  • Gene expression signature for classification of kidney tumors
  • Gene expression signature for classification of kidney tumors
  • Gene expression signature for classification of kidney tumors

Examples


example 1

Specific microRNAs are Differentially Expressed Between Different Histological Subtypes of Kidney Tumors

[0238]127 formalin-fixed, paraffin-embedded (FFPE) samples of renal tumors were collected, including 40 oncocytoma samples, 27 chromophobe samples, 34 conventional (clear) cell samples, and 26 papillary tumor samples. The initial sample set used for biomarker identification and for training a classifier included 71 samples. Total RNA was extracted from these samples, and microRNA expression was profiled using microarrays.

[0239]We first looked for microRNAs that are differentially expressed between different histological subtypes of kidney tumors. We compared the expression of microRNAs between oncocytoma samples (n=21), chromophobe tumors (n=13), conventional cell tumors (n=17), and papillary tumors (n=20). More than 900 microRNAs were compared using statistical tests. MicroRNAs were considered differentially expressed between any two histological types if their t-test significanc...

example 2

Specific MicroRNAs are Able to Distinguish Between Oncocytoma Renal Tumor Samples and Chromophobe RCC Samples

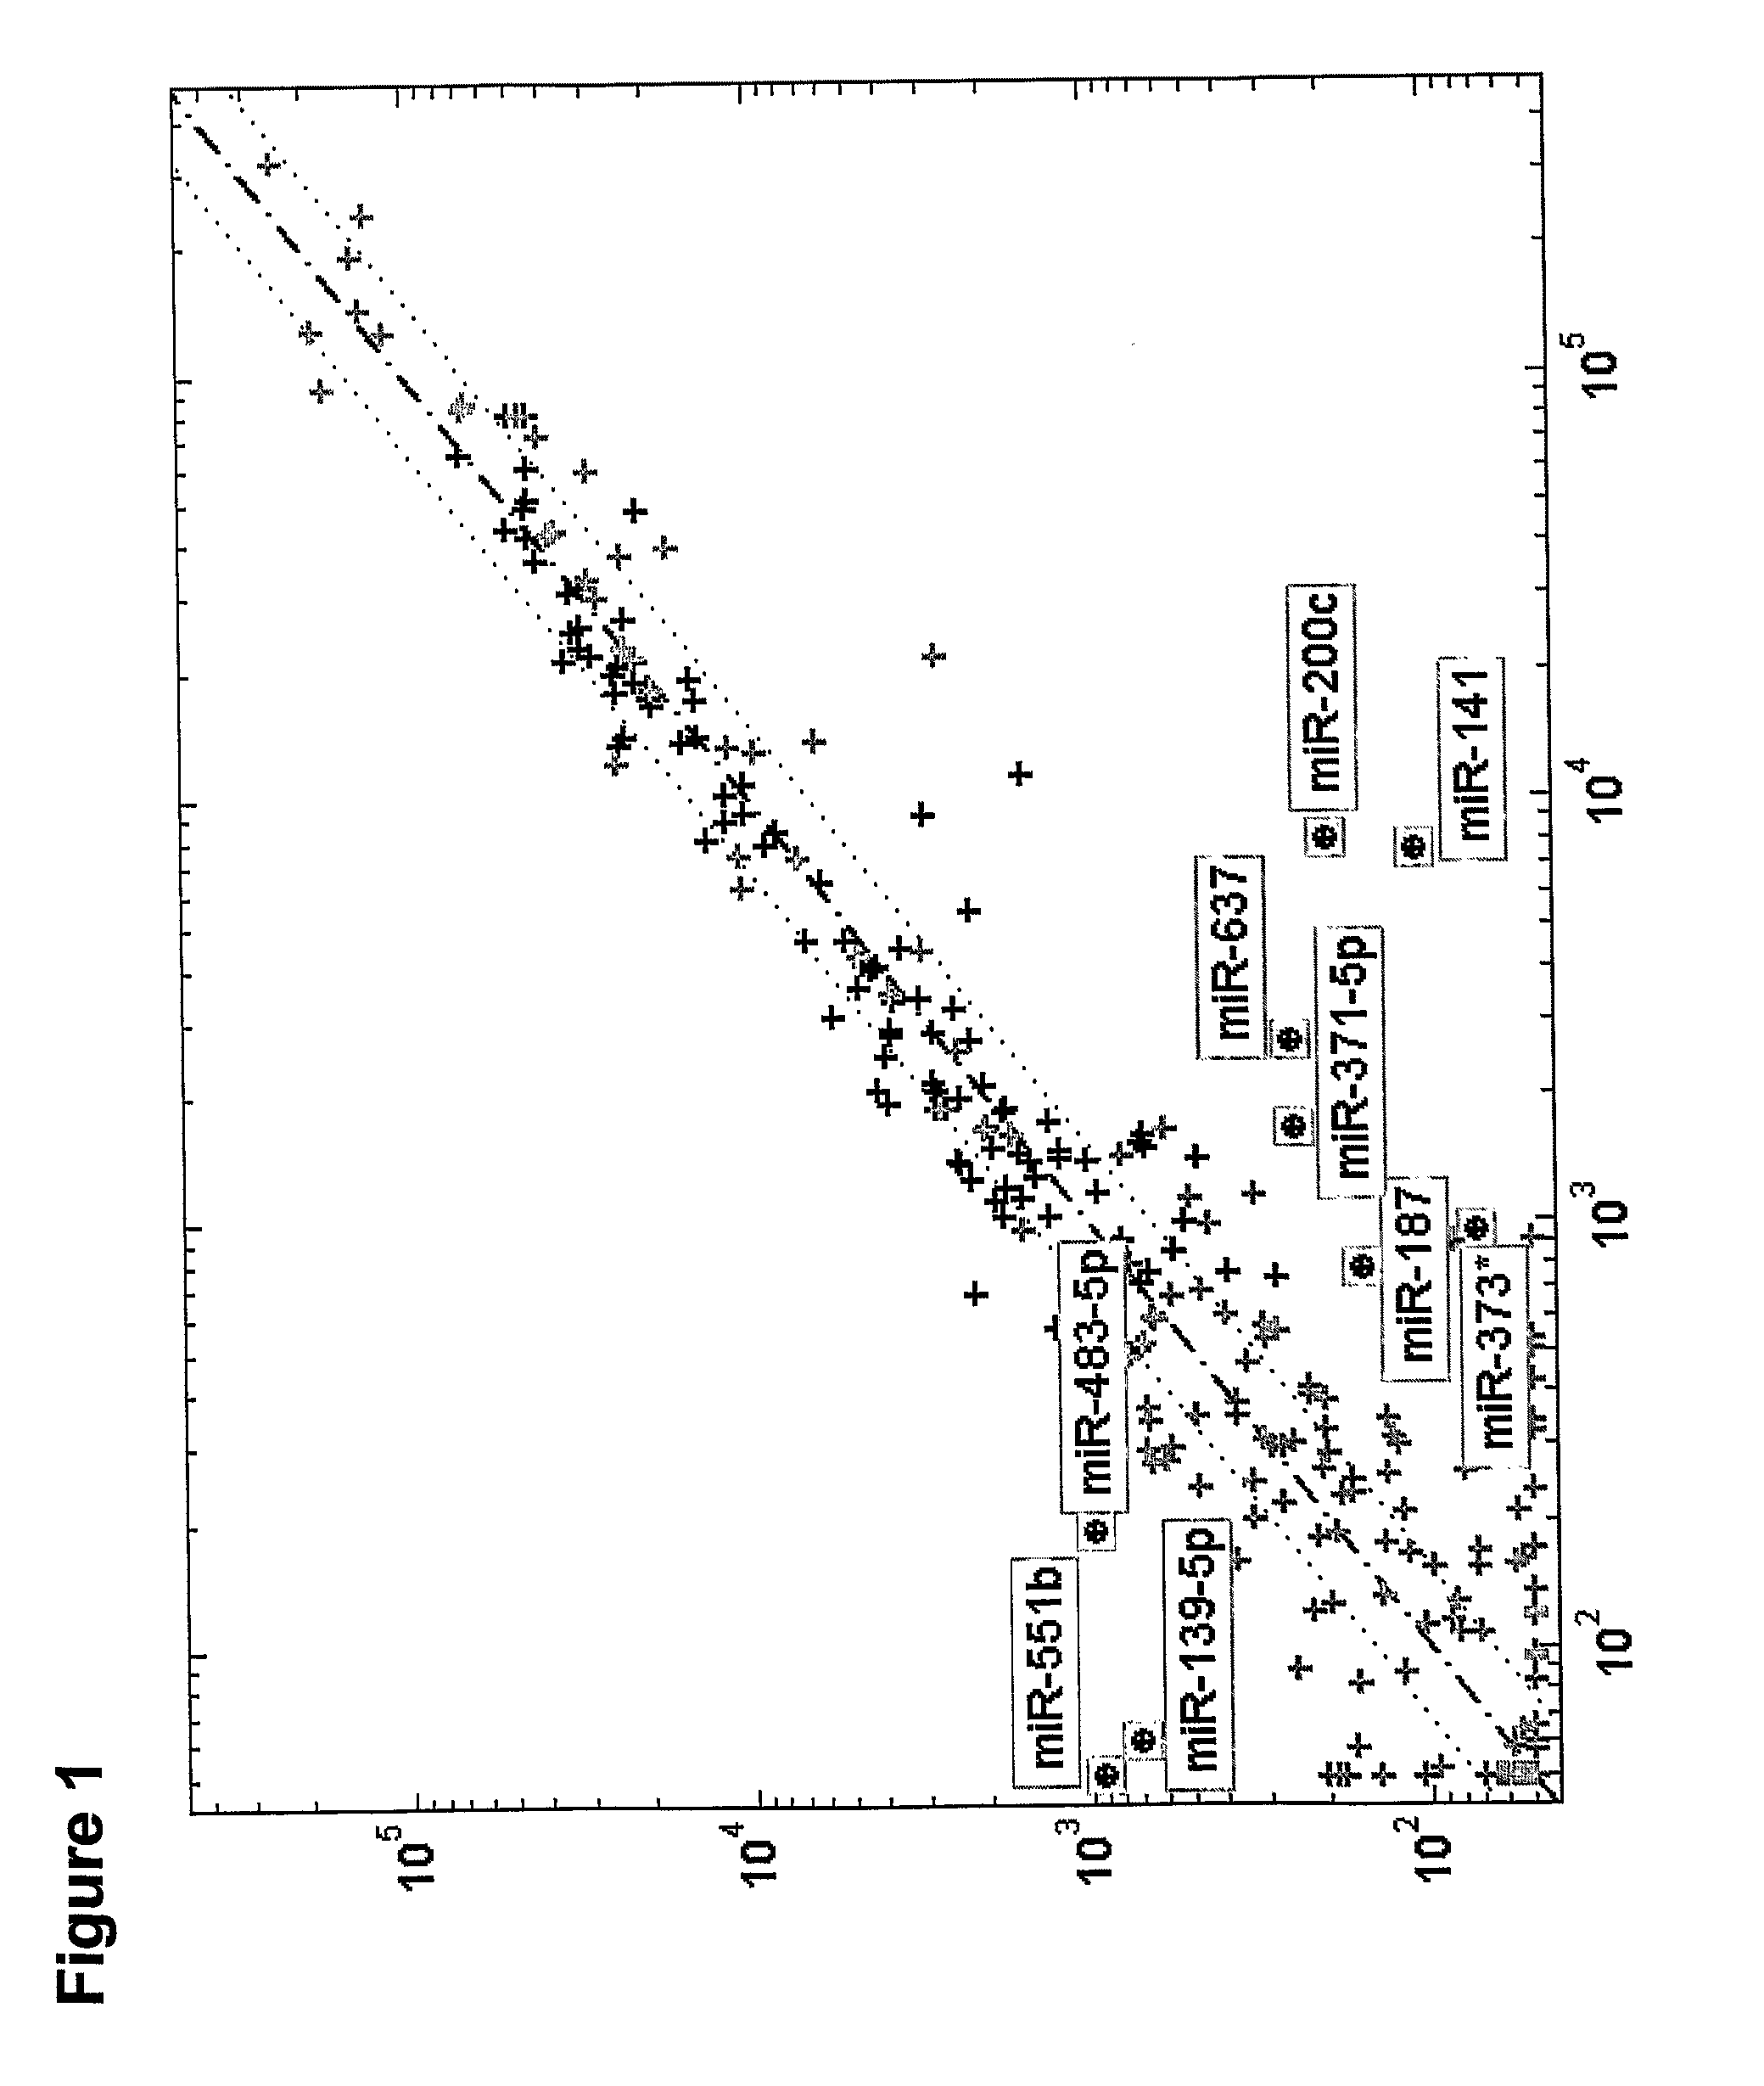
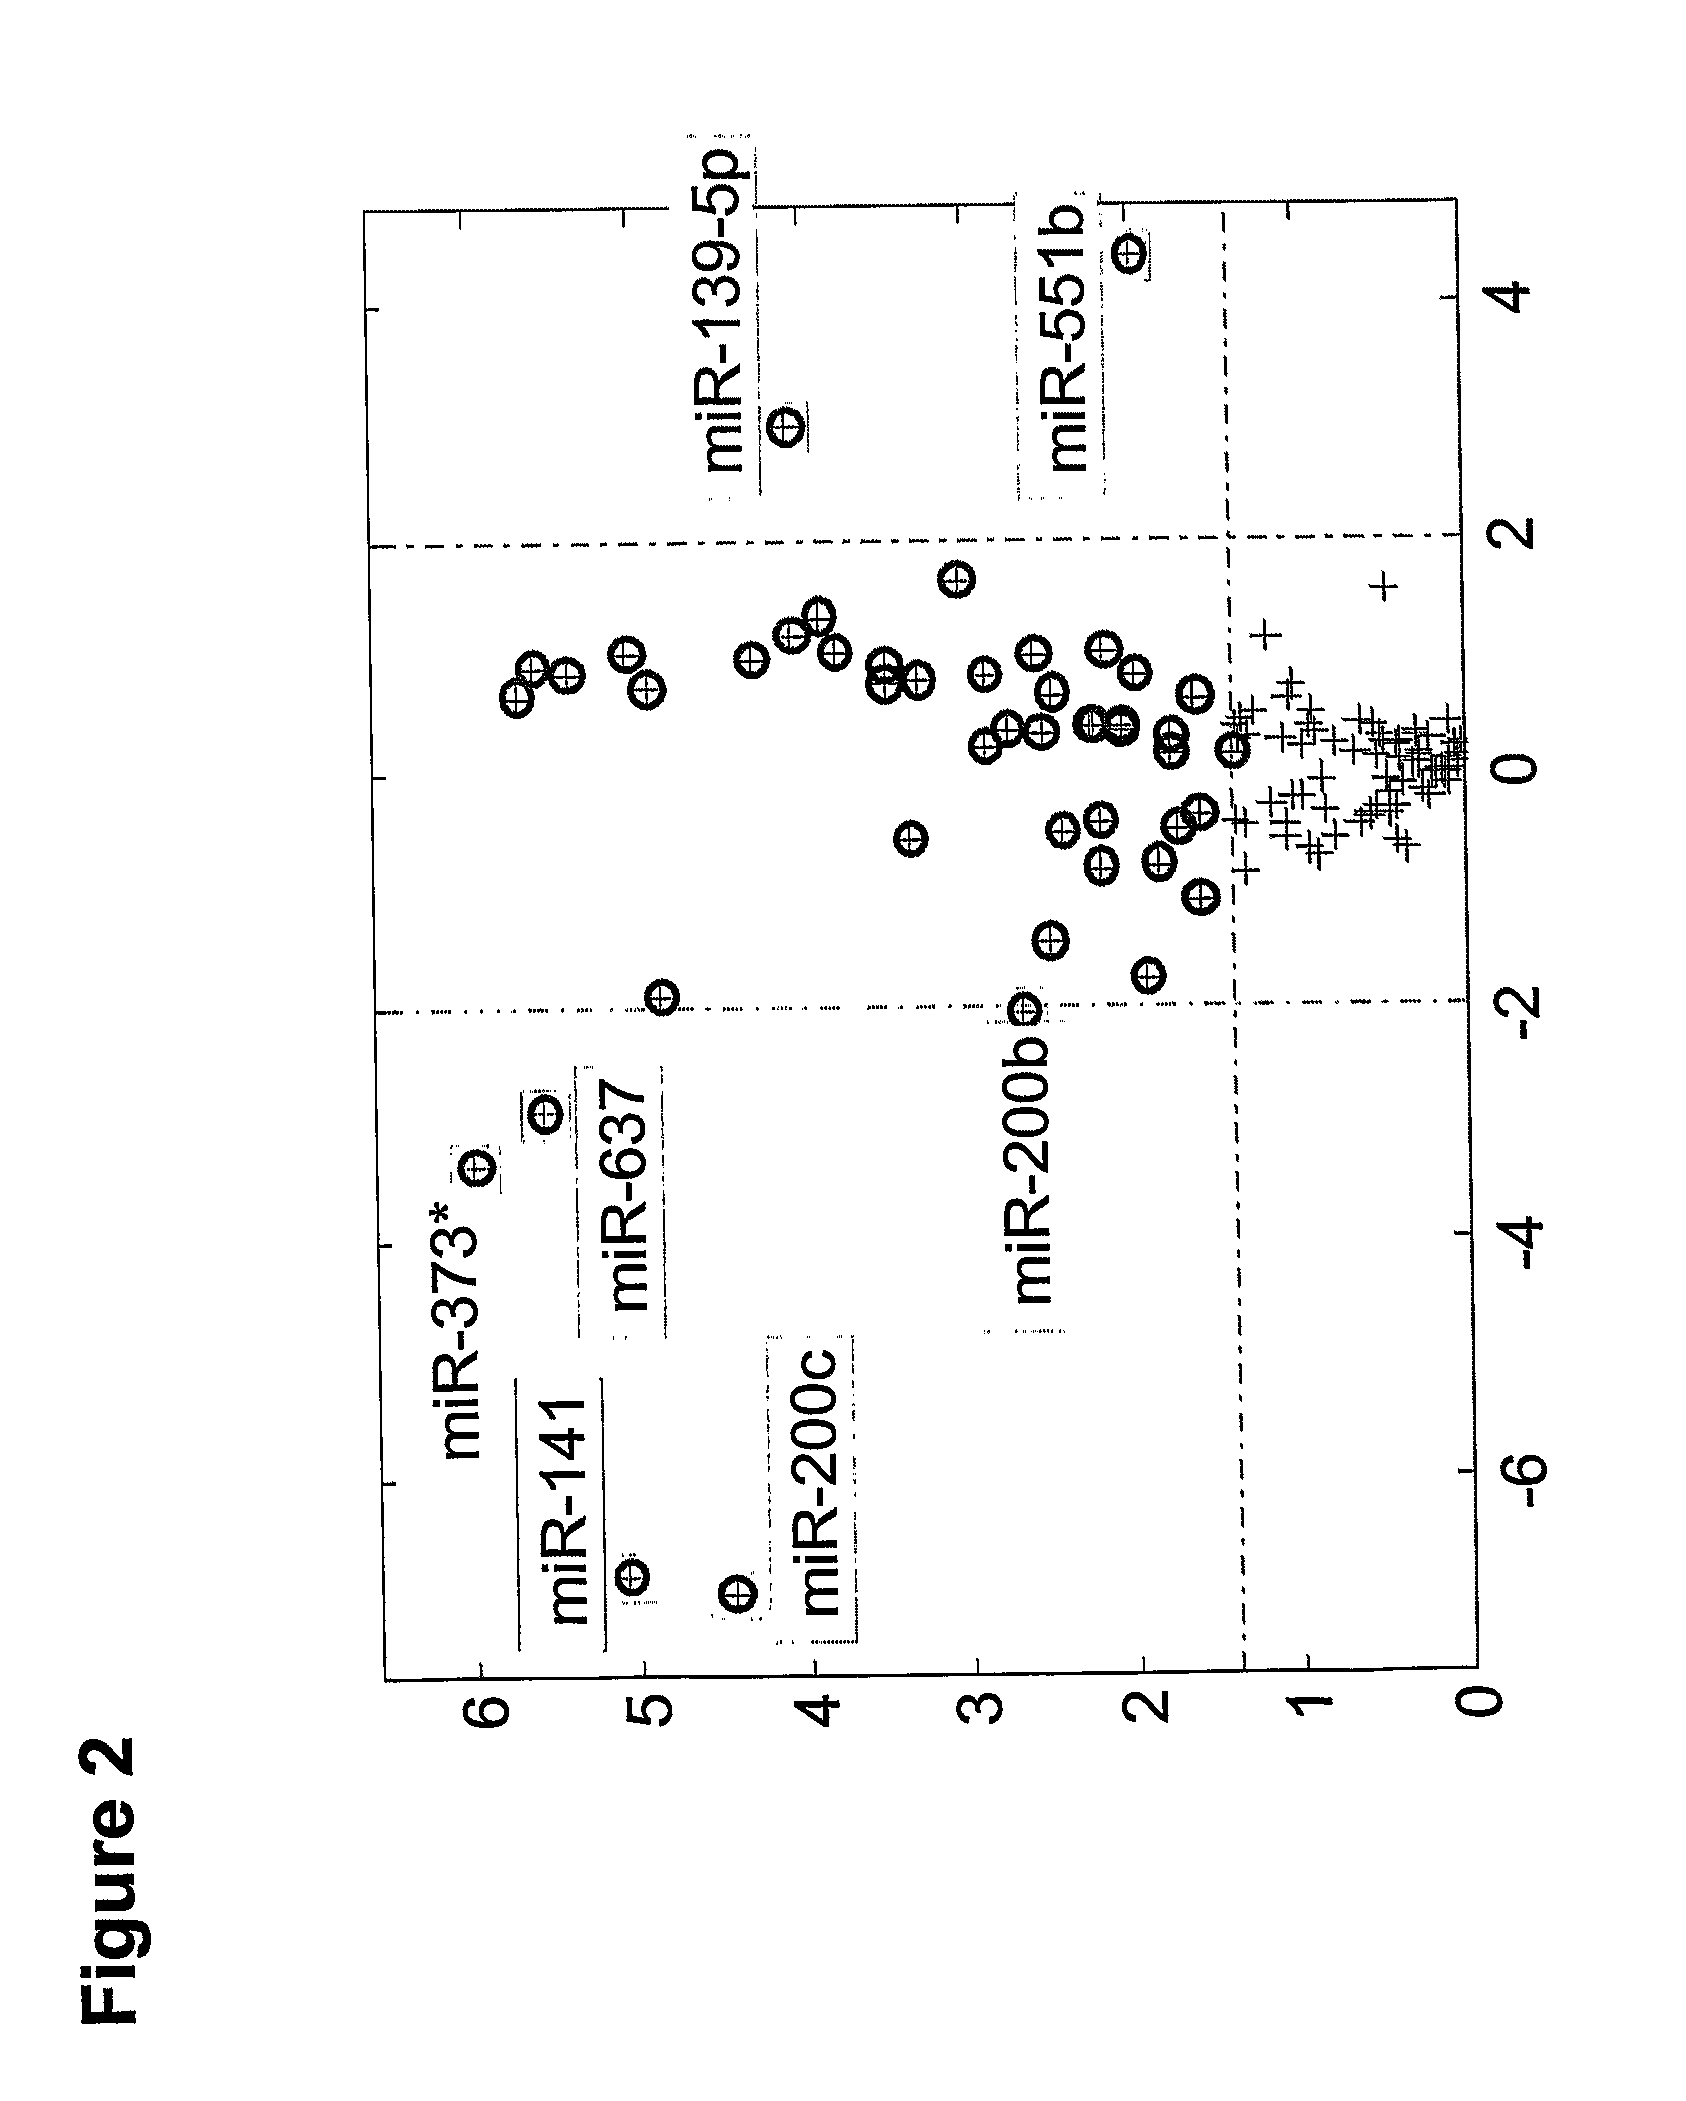
[0246]The analysis of the microarray results of oncocytoma renal tumor samples versus chromophobe RCC samples are presented in Table 4. The results exhibited a significant difference in the expression pattern of several mills. The normalized expression levels of hsa-miR-141 (SEQ ID NO: 32) and hsa-miR-200c (SEQ ID NO: 34) were found to be higher in chromophobe RCC samples in comparison to oncocytoma renal tumor samples. The normalized expression levels of hsa-miR-140-5p (SEQ ID NO: 28), hsa-miR-139-5p (SEQ ID NO: 14) and hsa-miR-551b (SEQ ID NO: 30) were found to be higher in oncocytoma renal tumor samples in comparison to chromophobe RCC samples.

TABLE 4miRHairpinmiRSEQ IDSEQ IDfold-median valuesnameNoNO.p-valuechangegroup 1group 2Up regulated in chromophobe RCC:hsa-miR-14132336.60E−05152.267.60E+035.00E+01hsa-miR-200c34352.10E−0499.528.00E+038.00E+01Down regulated in chromop...

example 3

Specific MicroRNAs are Able to Distinguish Between Oncocytoma Renal Tumor Samples and Clear Cell RCC Samples

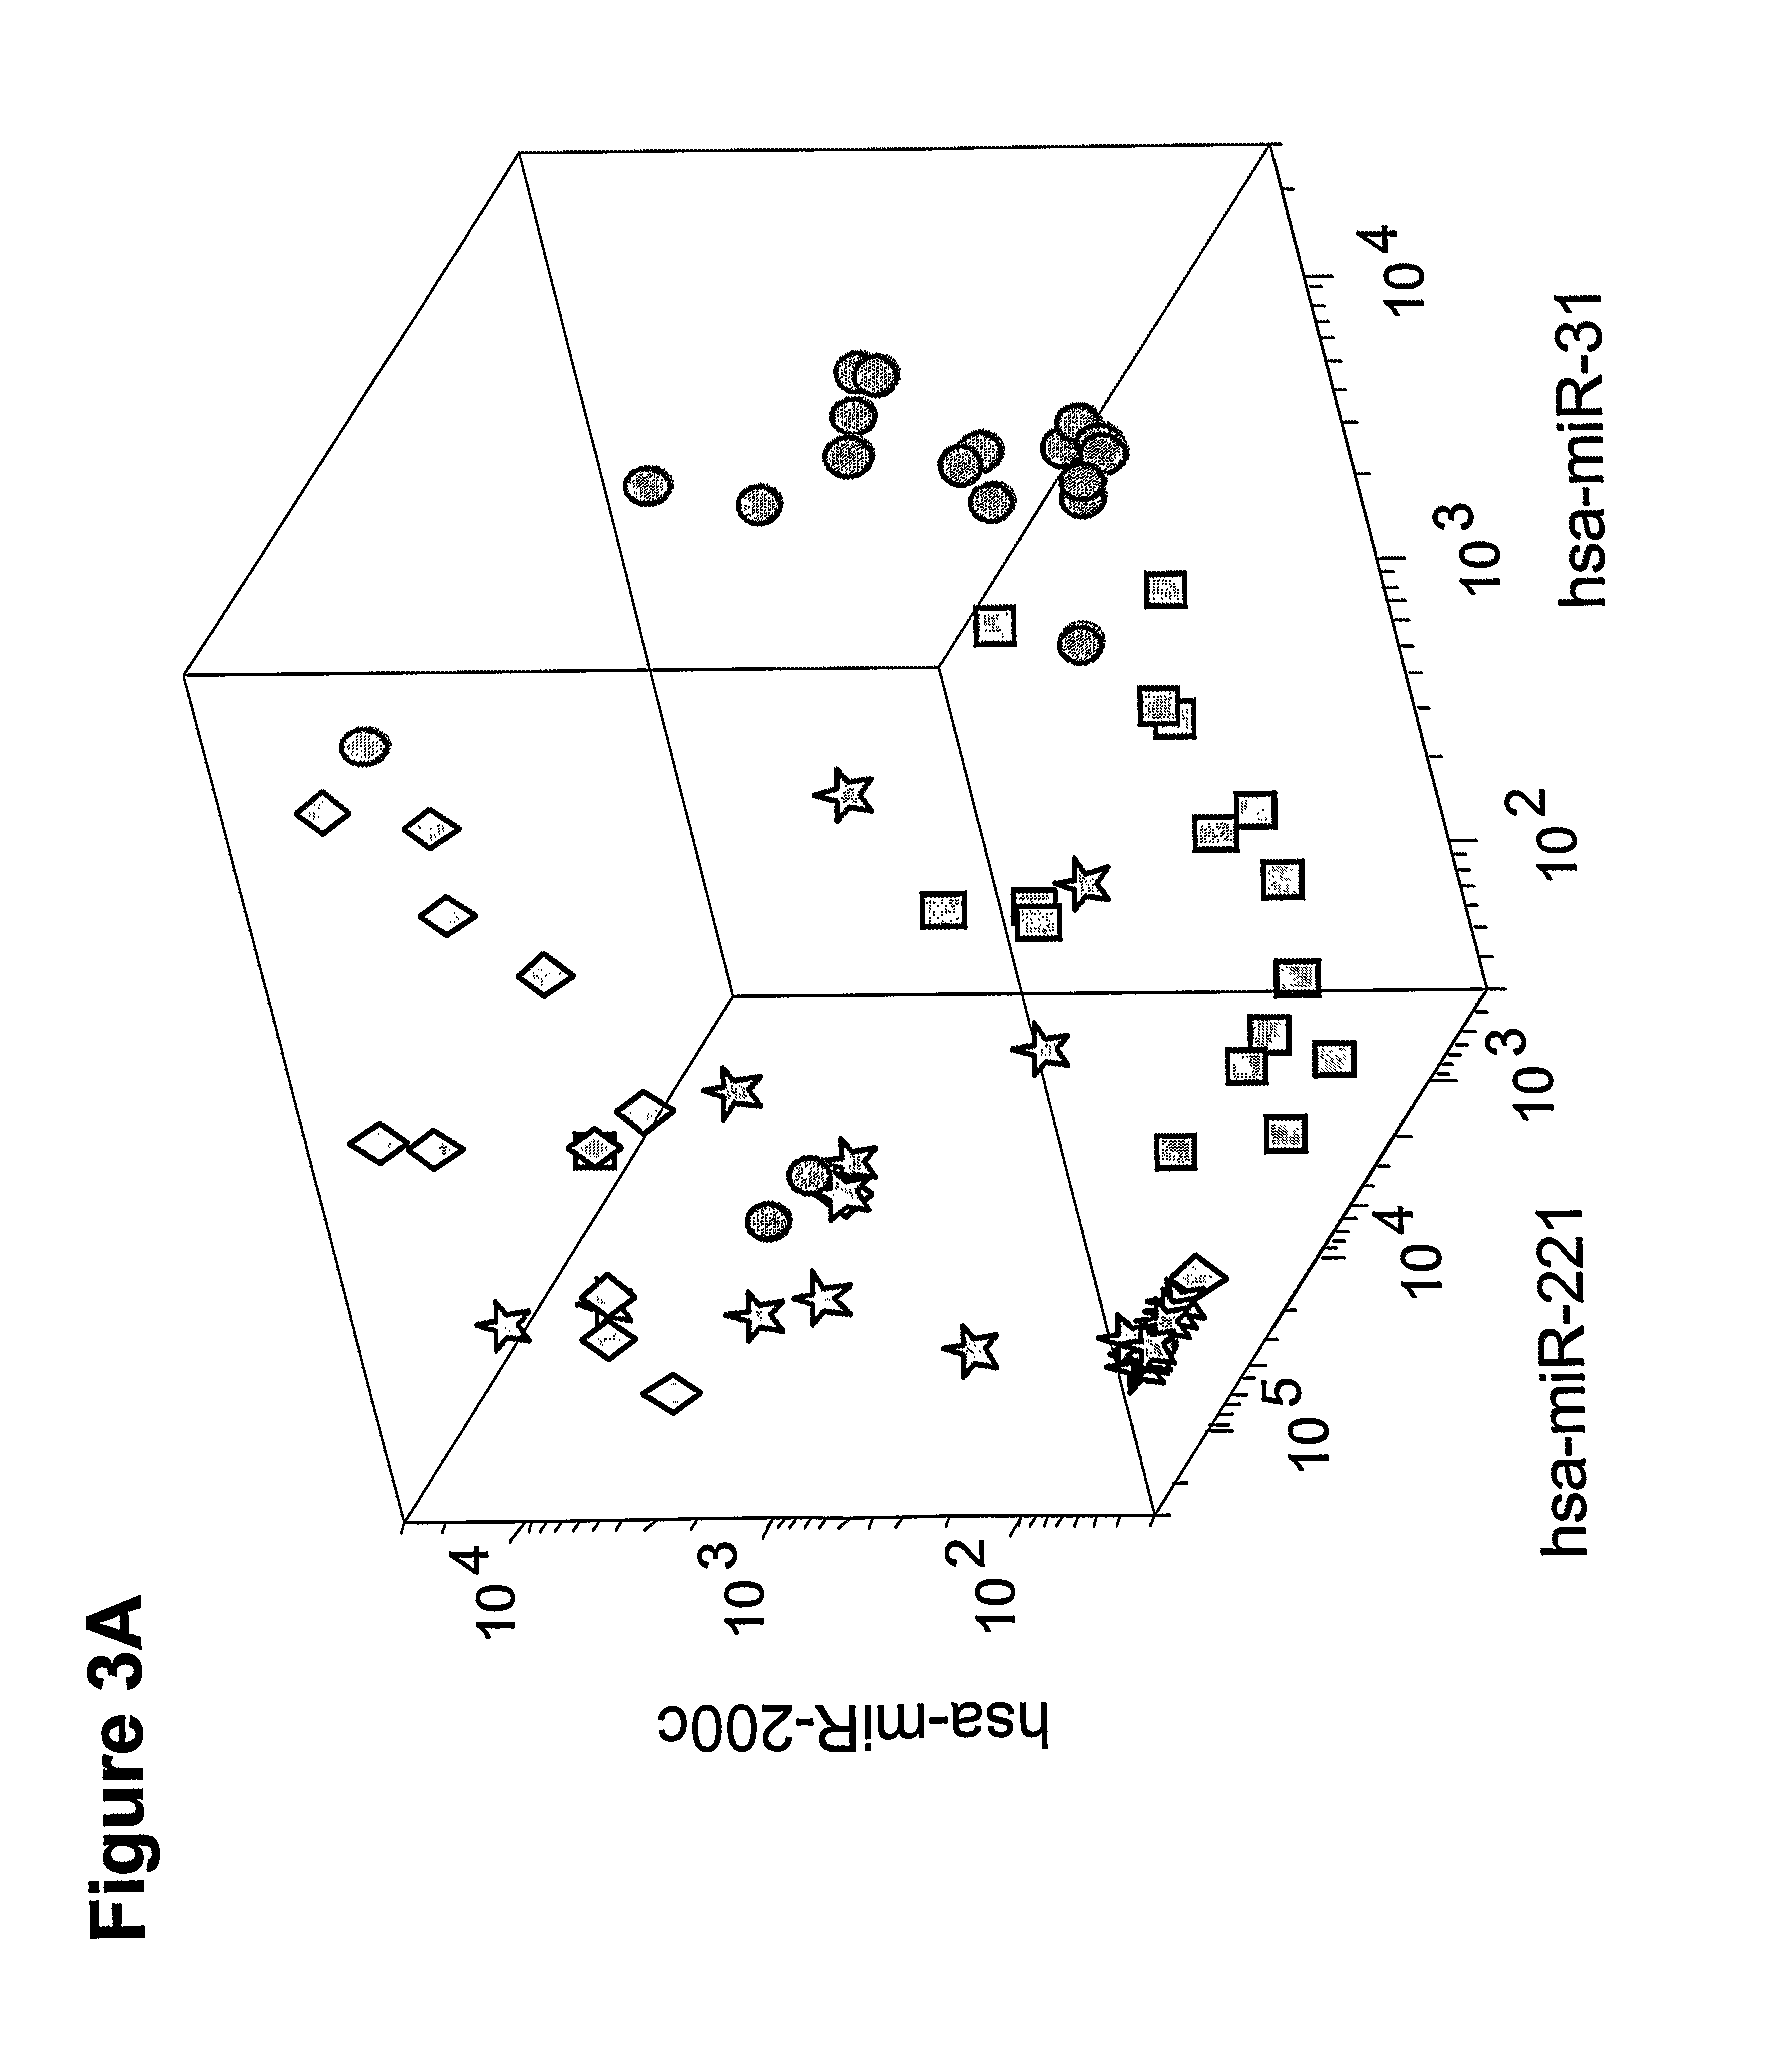
[0247]The analysis of the microarray results of oncocytoma renal tumor samples versus clear cell RCC samples are presented in Table 5. The results exhibited a significant difference in the expression pattern of several miRs. The normalized expression levels of hsa-miR-551b (SEQ ID NO: 30), hsa-miR-182 (SEQ ID NO: 36), hsa-miR-221 (SEQ ID NO: 25), hsa-miR-222 (SEQ ID NO: 26), hsa-miR-10a (SEQ ID NO: 48) and MID-00536 (SEQ ID NO: 38) were found to be higher in oncocytoma renal tumor samples in comparison to clear cell RCC samples. The normalized expression levels of hsa-miR-21 (SEQ ID NO: 47), hsa-miR-210 (SEQ ID NO: 20), hsa-miR-192 (SEQ ID NO: 6), hsa-miR-194 (SEQ ID NO: 1), hsa-miR-146b-5p (SEQ ID NO: 16), hsa-miR-155 (SEQ ID NO: 22) and hsa-miR-455-3p (SEQ ID NO: 24) were found to be higher in clear cell RCC samples in comparison to oncocytoma renal tumor samples.

TABLE 5miRH...


PUM

PropertyMeasurementUnit
Tmaaaaaaaaaa
temperatureaaaaaaaaaa

Abstract

The present invention provides a method for classification of kidney tumors through the analysis of the expression patterns of specific microRNAs and nucleic acid molecules relating thereto. Classification according to a microRNA expression framework allows optimization of treatment, and determination of specific therapy.

Description

CROSS REFERENCE TO RELATED APPLICATIONS[0001]The present application claims priority under 35 U.S.C. §119(e) to U.S. Provisional Application No. 61 / 086,483, filed Aug. 6, 2008 and U.S. Provisional Application No. 61 / 158,368, filed Mar. 8, 2009 which are herein incorporated by reference in their entirety.FIELD OF THE INVENTION[0002]The present invention relates to methods for classification of kidney tumors. Specifically the invention relates to microRNA molecules associated with specific kidney tumors, as well as various nucleic acid molecules relating thereto or derived therefrom.BACKGROUND OF THE INVENTION[0003]In recent years, microRNAs (miRs) have emerged as an important novel class of regulatory RNA, which have a profound impact on a wide array of biological processes. These small (typically 18-24 nucleotides long) non-coding RNA molecules can modulate protein expression patterns by promoting RNA degradation, inhibiting mRNA translation, and also affecting gene transcription. m...

Claims


Application Information

Patent Timeline
Patent Type & Authority Applications(United States)
IPC IPC(8): C40B30/04C12Q1/68C07H21/02
CPCC12Q1/6886C12Q2600/158C12Q2600/118C12Q2600/178C12Q1/68C12Q2600/112
Inventor ROSENFELD, NITZANSPECTOR, YAELFRIEDMAN, EDDIEDOTAN, ZOHAR
Owner ROSETTA GENOMICS
Why Eureka
Try Eureka