Kit and method for predicting cytarabine sensitivy of patient having acute myeloid leukemia
a technology of acute myeloid leukemia and kit, which is applied in the field of kit and method for anticipating the sensitivity of cytarabine in patients with acute myeloid leukemia, can solve the problems of side effects when administered to patients, oligocythemia, nausea, vomiting and alopecia, and secondary anticancer drugs may not be effectiv
- Summary
- Abstract
- Description
- Claims
- Application Information
AI Technical Summary
Problems solved by technology
Method used
Image
Examples
example 1
Determination of SNPs Associated with Cytarabine Sensitivity of Patients Having Acute Myeloid Leukemia
[0040]Cytarabine sensitivity of 139 patients who had acute myeloid leukemia and were treated in Samsung Medical Center was identified. That is, cytarabine was administered to the patients according to NCCN guidelines, and the number of leukocytes was subsequently measured in each patient to determine complete remission to determine whether the cytarabine therapy was effective for the patient. The patients were then classified into one group of 121 patients having cytarabine sensitivity (responders) and the other group of 18 patients not having cytarabine sensitivity (nonresponders). In addition, blood of the patients was obtained to extract DNA by using QIAamp DNA Mini and blood Mini kits in order to determine SNPs associated with cytarabine sensitivity of the patients.
[0041]Microarray chips to determine SNPs associated with cytarabine sensitivity were prepared according to the foll...
example 2
Statistical Model for Predicting Cytarabine Sensitivity of Patient having Acute Myeloid Leukemia
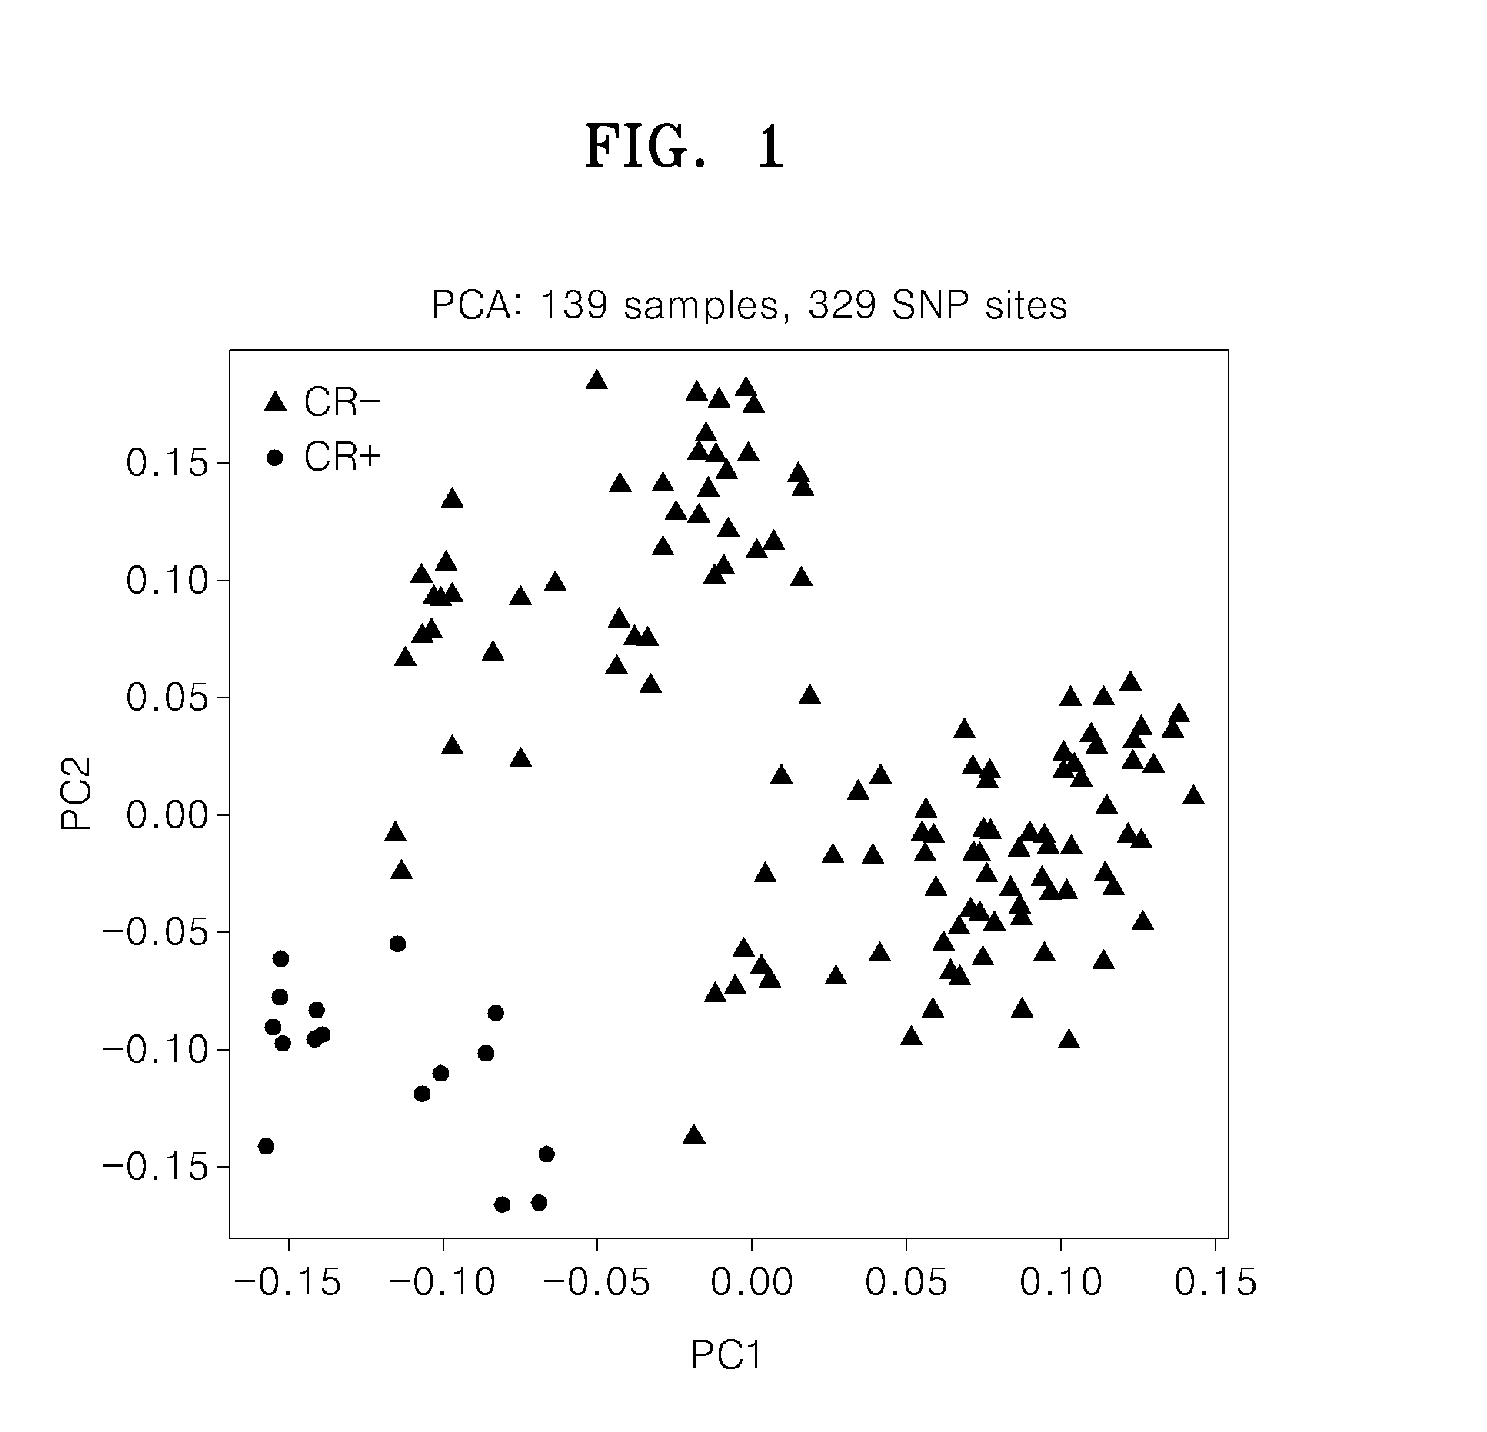
[0046]A statistical model for predicting cytarabine sensitivity of patients having acute myeloid leukemia was obtained by performing principal component analysis (PCA) on the patient population of Example 1 using the 329 SNPs (p≦0.01) associated with cytarabine response or lack of response from among the SNPs tested in Example 1.
[0047]The results are plotted in FIG. 1. In FIG. 1, PC1 and PC2 are the principal component analysis values for each of the patients, obtained using Equations I and II, below, with the genotype data of the 329 SNPs.
PC1=∑i=1#ofSNPsc1i·SNPiEquationIPC2=∑i=1#ofSNPsc2i·SNPiEquationII
[0048]In Equations I and II, SNPi is a genotype of the ith SNP, is a contribution degree (coefficient) of the ith SNP in the first component as a result of the principal component analysis, and c2i is a contribution degree (coefficient) of the ith SNP in the second component as a result of...
PUM
| Property | Measurement | Unit |
|---|---|---|
| Fraction | aaaaa | aaaaa |
| Sensitivity | aaaaa | aaaaa |
Abstract
Description
Claims
Application Information
 - R&D
- Intellectual Property
- Life Sciences
- Materials
- Tech Scout
- Unparalleled Data Quality
- Higher Quality Content
- 60% Fewer Hallucinations
Browse by: Latest US Patents, China's latest patents, Technical Efficacy Thesaurus, Application Domain, Technology Topic, Popular Technical Reports.
© 2025 PatSnap. All rights reserved.Legal|Privacy policy|Modern Slavery Act Transparency Statement|Sitemap|About US| Contact US: help@patsnap.com


