Diagnostic biomarker to identify women at risk for preterm delivery
a biomarker and diagnostic technology, applied in the field of preterm delivery, can solve the problems of few, if any, effective diagnostic biomarkers availabl
- Summary
- Abstract
- Description
- Claims
- Application Information
AI Technical Summary
Benefits of technology
Problems solved by technology
Method used
Image
Examples
example 1
Biomarker Assay
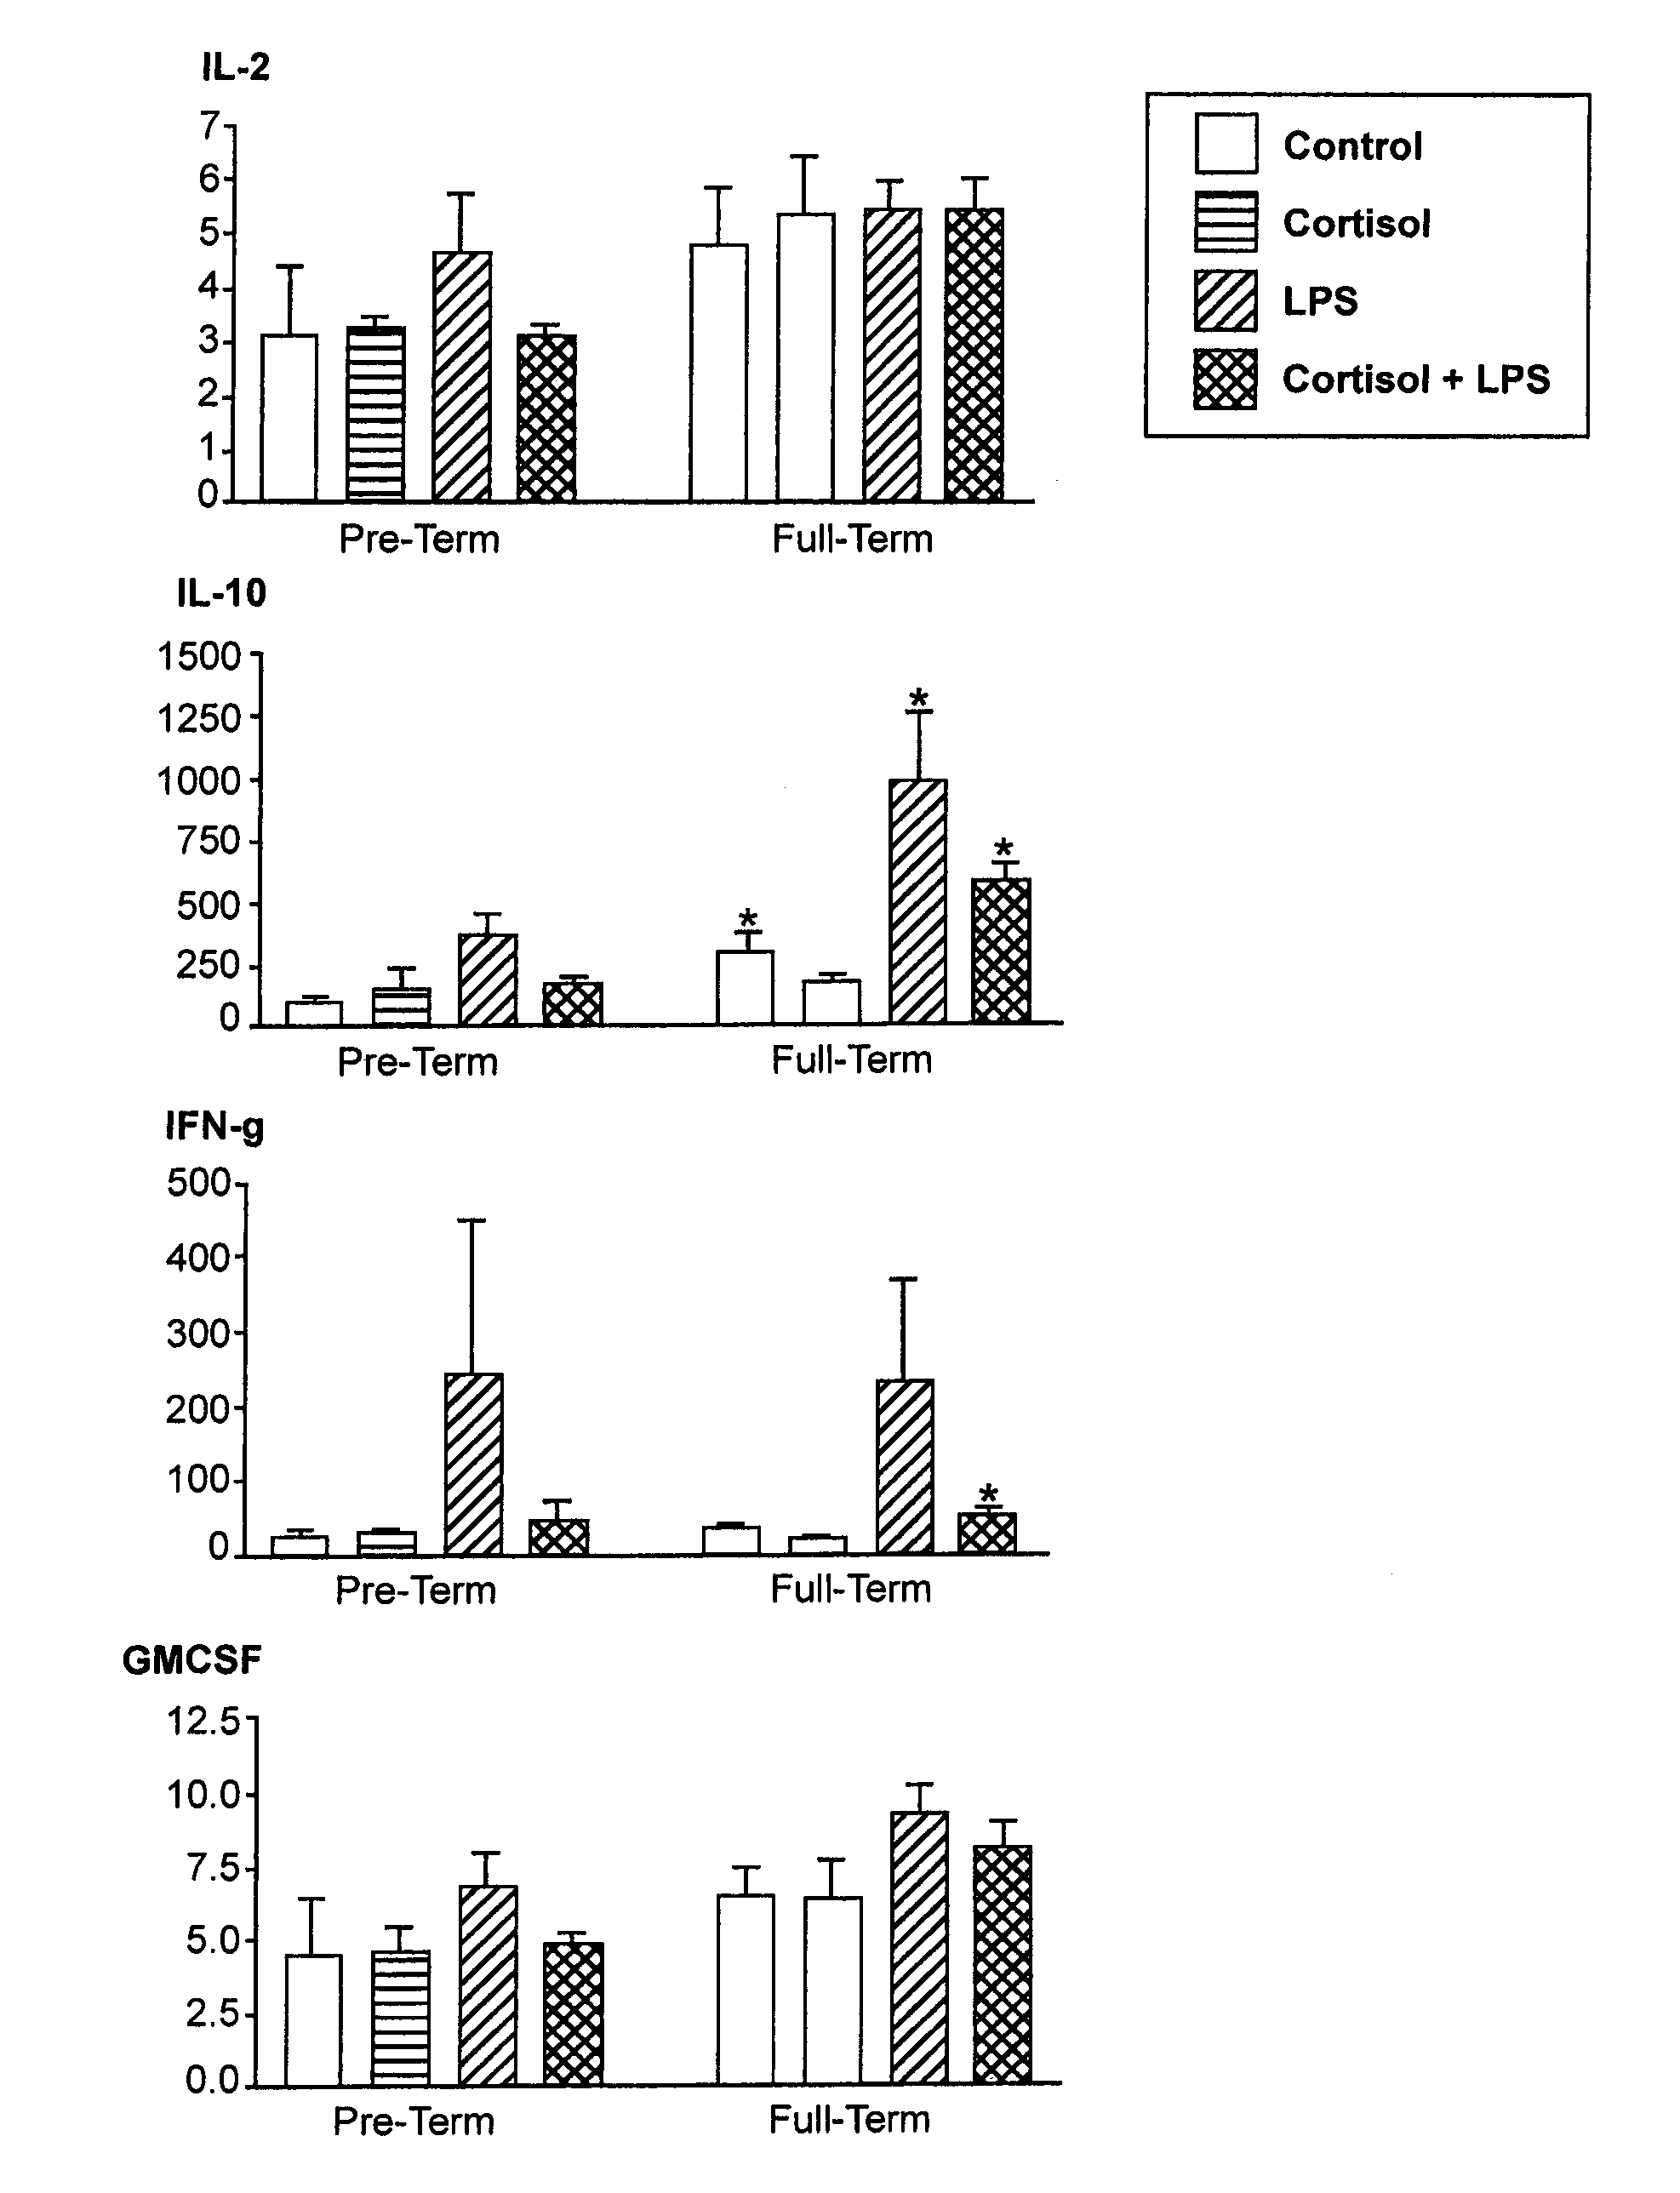
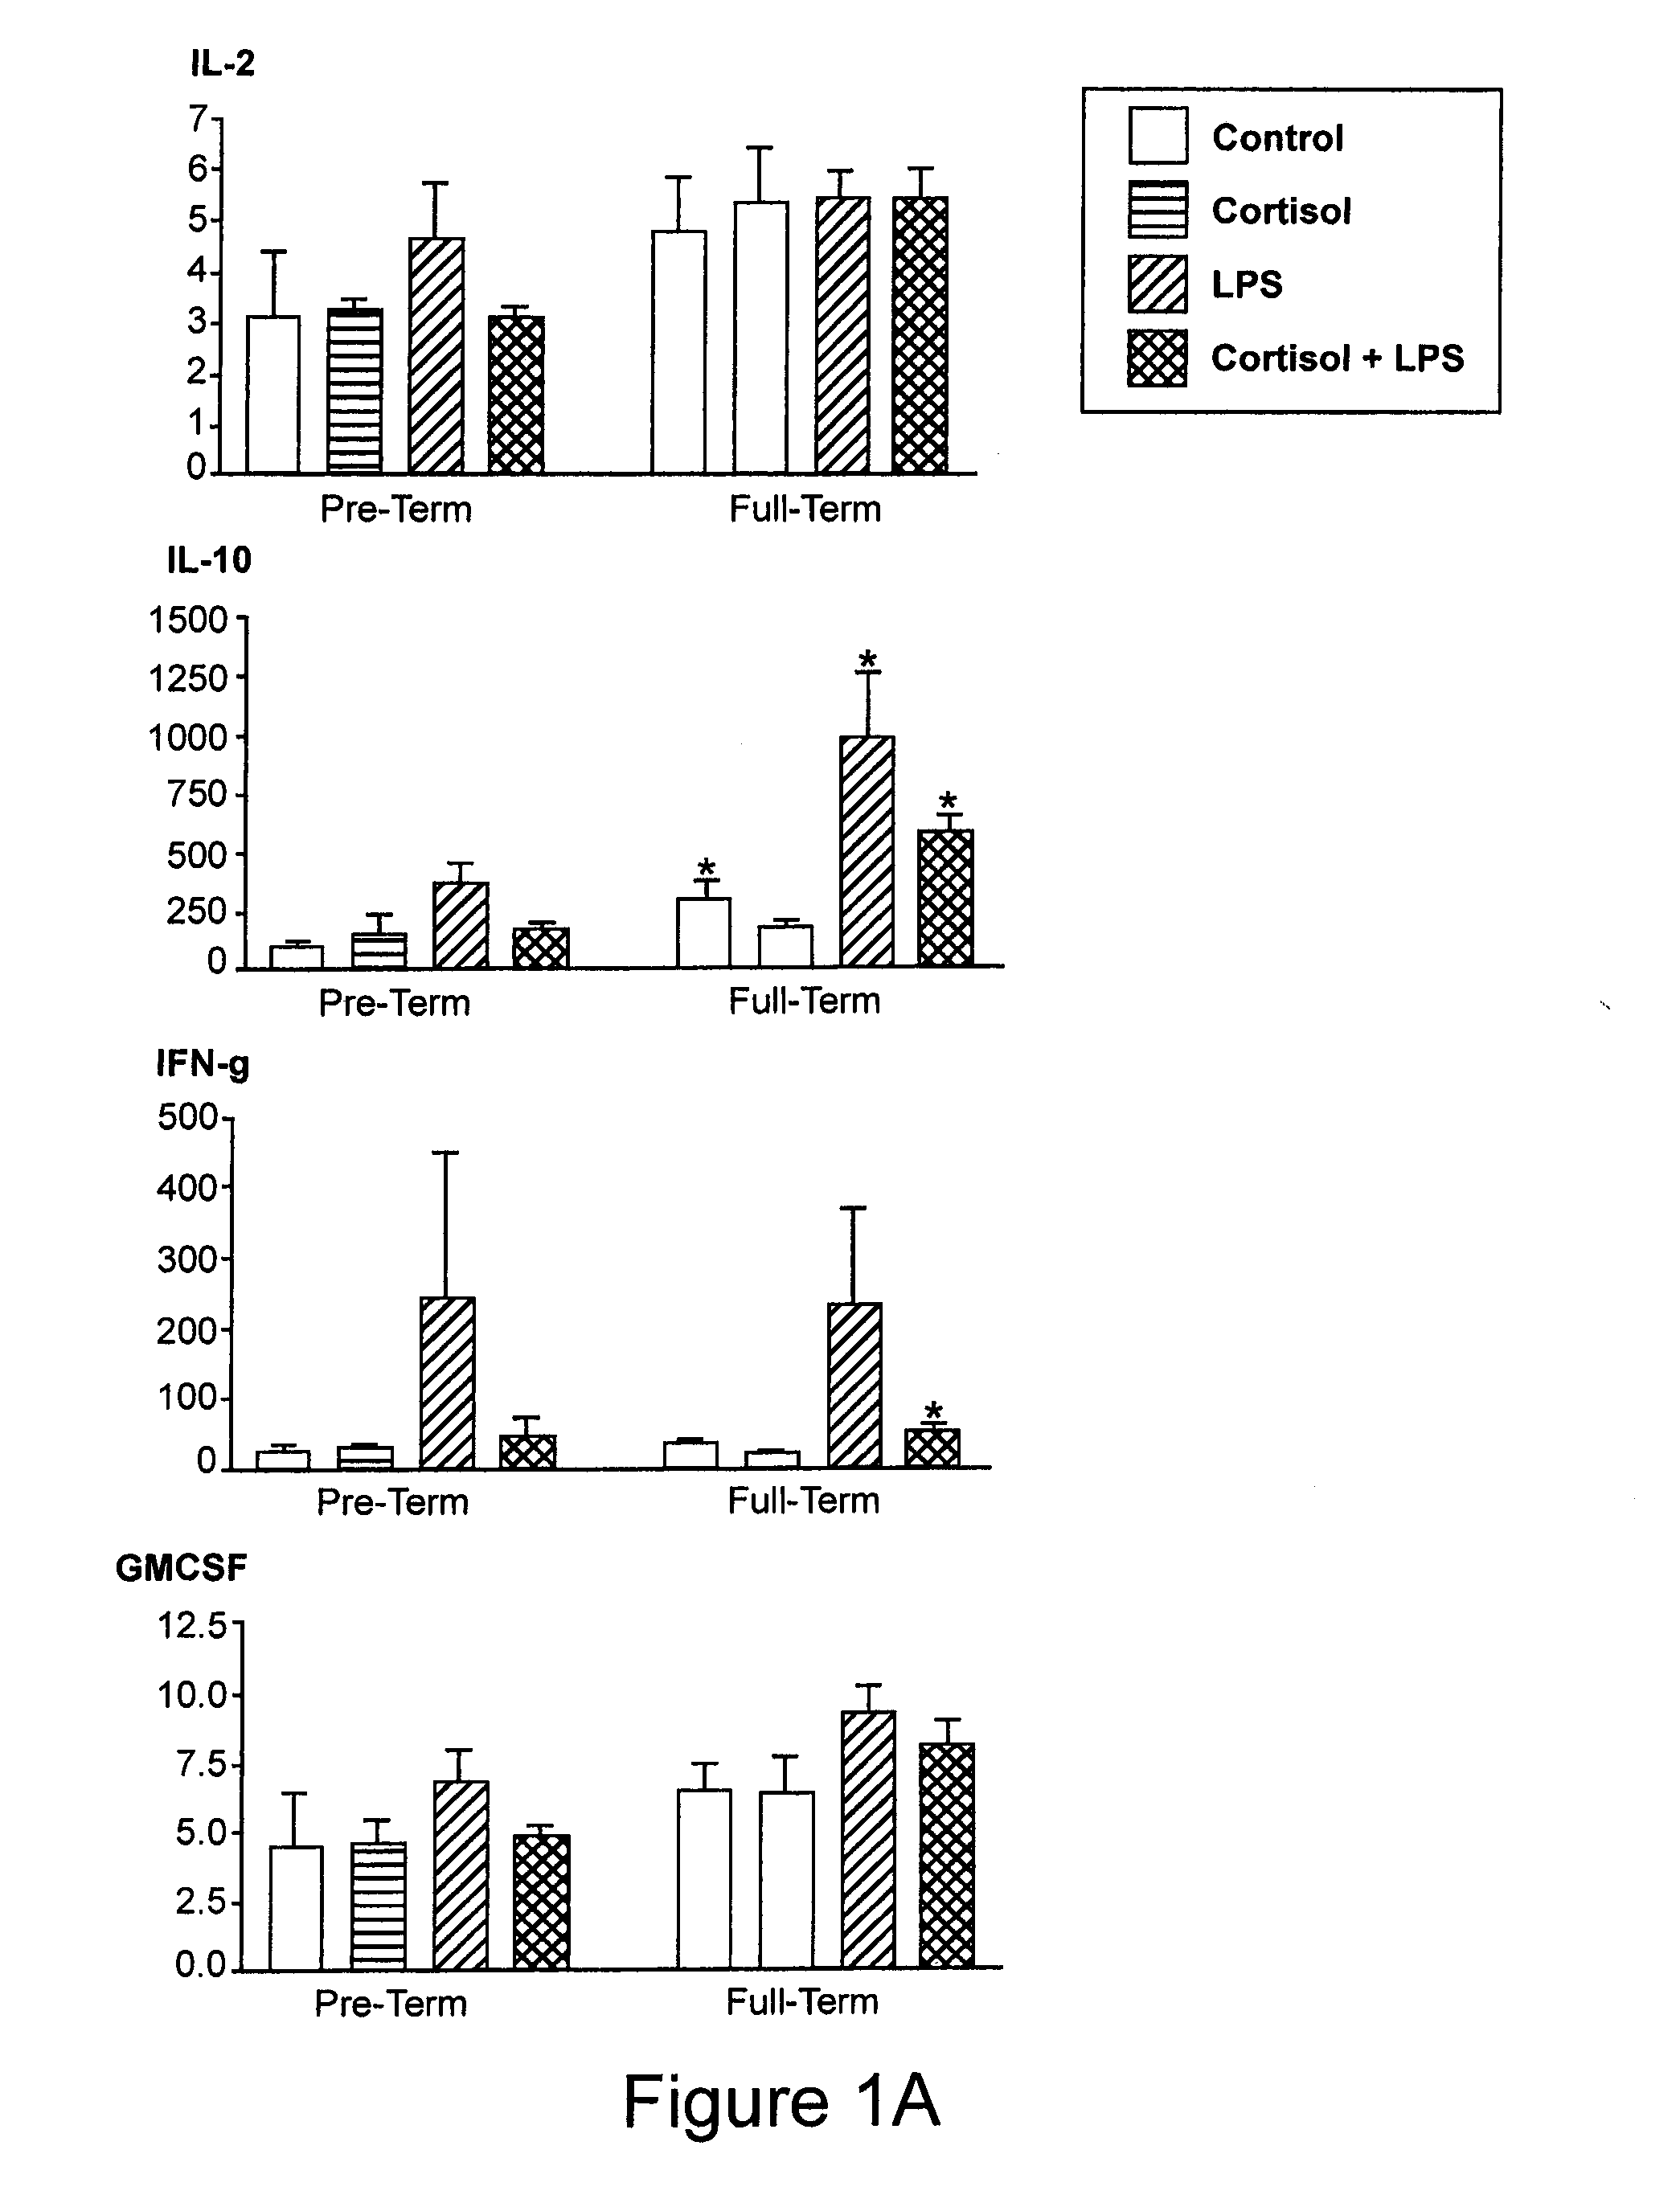
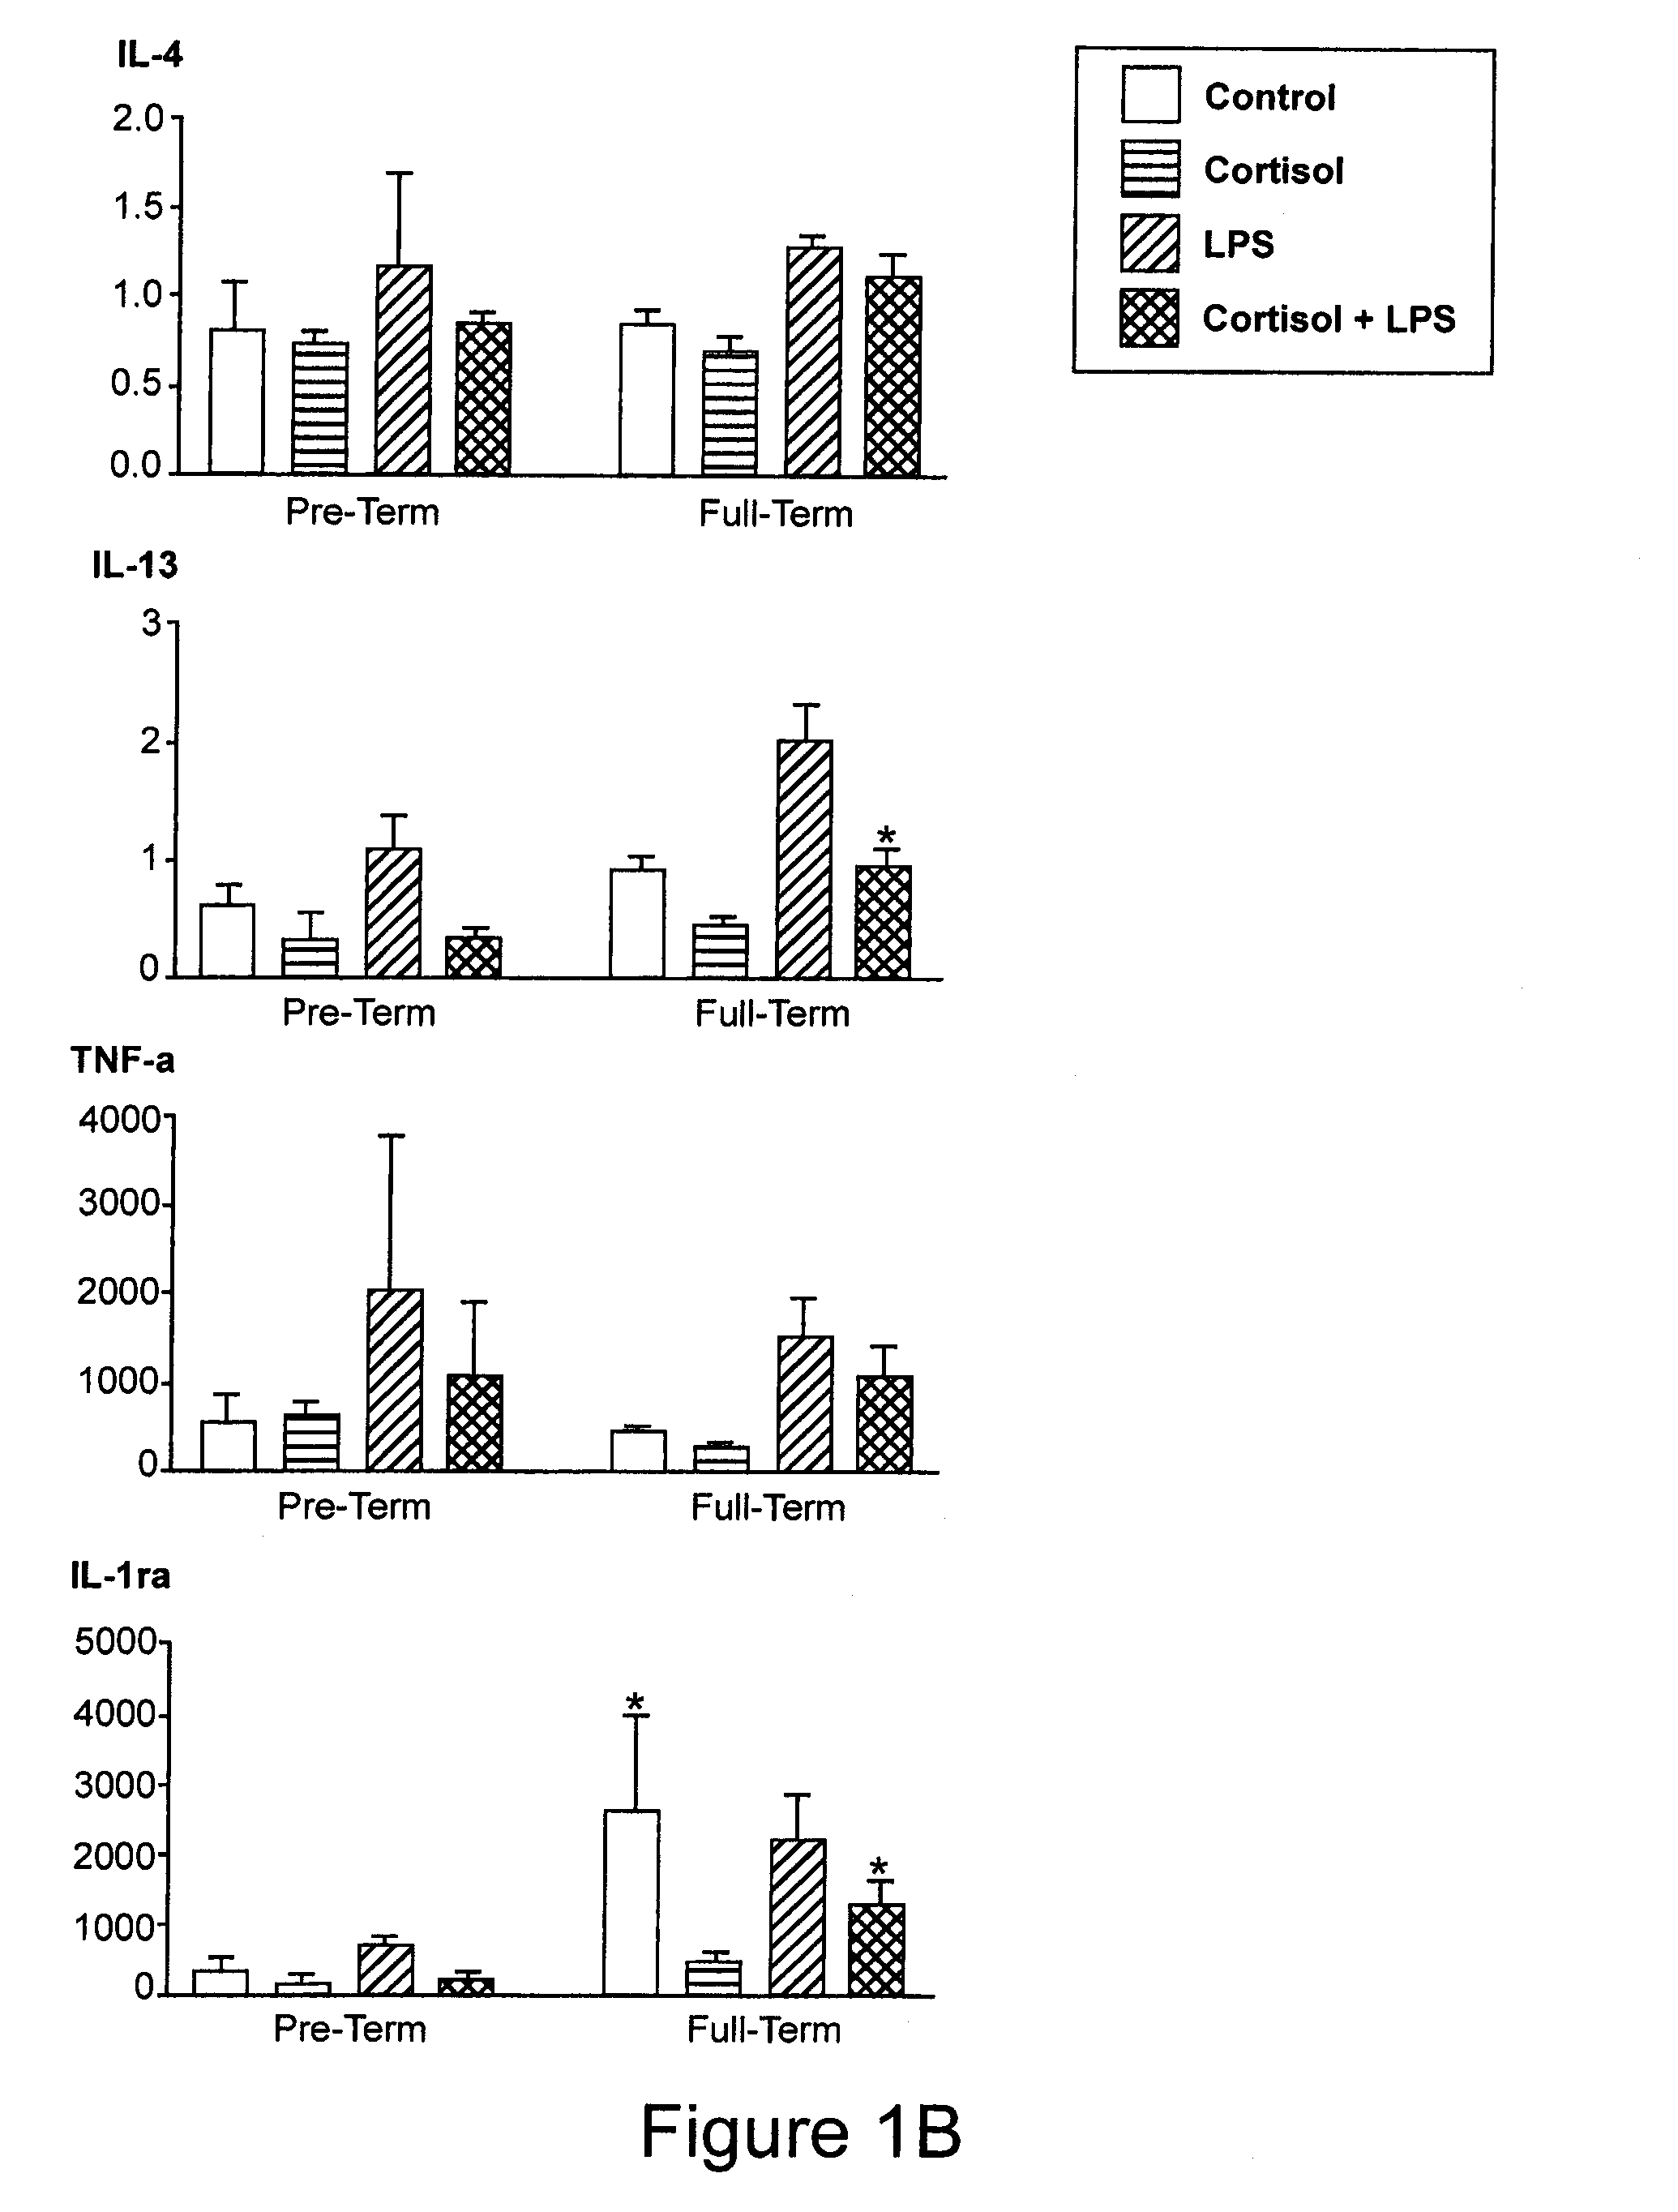
[0025]Peripheral blood mononuclear cells (PBMC) from non-pregnant (at least 5-6 years post-partum) women with history of preterm or full term delivery, in addition to the microbial component lipopolysaccharide (LPS)-induced cytokine expression profile were examined. PBMC were separated from whole blood using Ficoll gradient. The cells were counted and equal numbers of cells were plated in 24 well plates. PBMC were treated with cortisol (50 or 300 ug / ml) or media for 1 hour prior to stimulation with LPS (0, 1, or 100 ug / ml) for 24 hours. The PBMC were lysed and the supernatant was examined for inflammatory and anti-inflammatory cytokine expression by using Bioplex technology (Bio-rad). The inventors found that during the non-pregnant state IL10, IL13 and IL1Ra expression was lower in the PBMC obtained from women whom had previous preterm delivery, and that those biomarkers may be measured to identify women who were at risk for preterm delivery in the future.
[0026]In th...
example 2
Establishment of Cut Off Points
[0027]Many samples were above or below the detection for some of the endpoints. Cut off points were established for each cytokine measured (Table 1). If a sample was out of the range of detection, a default value was assigned to the sample as indicated below.
TABLE 1The establishment of cut off points for out of range values.Out ofFraction ofRangeSamples outSetof DetectionCytokineLimit of DetectionValueRangeIL-1raall samples within levels of detectionn / a 0 / 99IL-2LL = 0.500.2510 / 99IL-4LL = 0.140.08 6 / 99IL-5LL = 0.900.582 / 99IL-8UL = 95,000100,00079 / 99IL-10all samples within levels of detectionn / a 0 / 99IL-12LL = 0.330.1519 / 99IL-13LL = 0.170.08 8 / 99GM-CSFLL = 1.180.6011 / 99IFN-gLL = 1.210.60 5 / 99TNF-aall samples within levels of detectionn / a 0 / 99LL = Lower Limit;UL = Upper Limit
[0028]All samples that were below the range of detection for IL-2, IL-4, IL-13, and IFN-g were from the two subjects with a history of pre-term delivery. Of the 11 samples assayed that...
example 3
[0029]Empirical means and standard errors for each cytokine and treatment group are presented herein. Here, the averages of replicate measures were calculated first for each subject. The mean and SEM was then taken across each treatment group.
[0030]All raw data was tested via the Kolmogorov-Smirnov test to determine if the data followed a normal distribution. Log-transformations were performed for all data found to have a non-normal distribution prior to further statistical analysis. For each cytokine, a mixed effects model was used to examine all data for significant effects with the outcome variable as the cytokine concentration; the fixed predictor variables as LPS concentration, cortisol concentration, and delivery status (pre- or full-term); and the random effect due to the replicate data points. To test the interaction of the three fixed predictor variables on cytokine concentration, both first and second level interactions ware added to each cytokine model...
PUM
| Property | Measurement | Unit |
|---|---|---|
| concentration | aaaaa | aaaaa |
| concentration | aaaaa | aaaaa |
| temperatures | aaaaa | aaaaa |
Abstract
Description
Claims
Application Information
 - R&D
- Intellectual Property
- Life Sciences
- Materials
- Tech Scout
- Unparalleled Data Quality
- Higher Quality Content
- 60% Fewer Hallucinations
Browse by: Latest US Patents, China's latest patents, Technical Efficacy Thesaurus, Application Domain, Technology Topic, Popular Technical Reports.
© 2025 PatSnap. All rights reserved.Legal|Privacy policy|Modern Slavery Act Transparency Statement|Sitemap|About US| Contact US: help@patsnap.com


