Automated system and method for implementing statistical comparison of power plant operations

a technology of automatic analysis and power plant, applied in the direction of adaptive control, testing/monitoring control system, instruments, etc., can solve the problems of difficult analysis of historical data, difficult to make useful comparisons among different instances of an operation, and high complexity of industrial operations

Inactive Publication Date: 2012-11-08
GENERAL ELECTRIC CO
View PDF18 Cites 36 Cited by
  • Summary
  • Abstract
  • Description
  • Claims
  • Application Information

AI Technical Summary

Benefits of technology

[0009]In one exemplary embodiment of the disclosed technology, a method of electronically analyzing power plant data, includes: electronically accessing power plant operational data including one or more monitored parameters; generating a continuous time-series profile model of selected monitored parameters during identified instances of at least one given type of power plant operation; conducting shape analysis by comparing the continuous time-series profile model of selected monitored parameters to an entitlement curve representing ideal performance for the at least one given type of power plant operation; and providing one or more of the generated continuous time-series profile model and the results of the conducted shape analysis as electronic output to a user.

Problems solved by technology

Highly complex industrial operations such as implemented within a power plant environment often involve the sophisticated coordination of multiple machines and associated processes.
All of these lengthy and complex steps are normally done on an ad hoc basis, and typically have to be repeated for each issue as it arises.
The ability to analyze historical data can also be difficult because of the sheer volume of information captured in conventional monitoring systems and limited ways to sort and access such data.
Without ways to identify and store data associated with past operational events, an analyst may be forced to manually sort through extensive amounts of prior data to identify desired information.
Still further, specific plant operations can be quite complex and variable, such that it is difficult to make useful comparisons among different instances of an operation.
Analysis of plant operations by a human operator interacting with a data monitoring system can become increasingly difficult as the operator is required to mentally conceptualize and compare numerous abstract parameters associated with the plant environment.
Also, visualizing plant operations, particularly visualizing more than one at a time, requires significant levels of arduous data manipulation.
All of these realities are significant obstacles to characterizing and visualizing plant operations as part of any monitoring or improvement program.
However, since such curves are discretized to only a few landmarks, significant information is lost in the analysis, thus making it difficult to identify modes of variation in startup time and to quantify differences to the entitlement curve in terms of shape of the curves and separating individual and plant level factors impacting startup.

Method used


Image

  • Automated system and method for implementing statistical comparison of power plant operations
  • Automated system and method for implementing statistical comparison of power plant operations
  • Automated system and method for implementing statistical comparison of power plant operations

Examples


Embodiment Construction

[0021]Reference is now made to particular embodiments of the invention, one or more examples of which are illustrated in the drawings. Each embodiment is presented by way of explanation of aspects of the invention, and should not be taken as a limitation of the invention. For example, features illustrated or described with respect to one embodiment may be used with another embodiment to yield a still further embodiment. It is intended that the present invention include these and other modifications or variations made to the embodiments described herein.

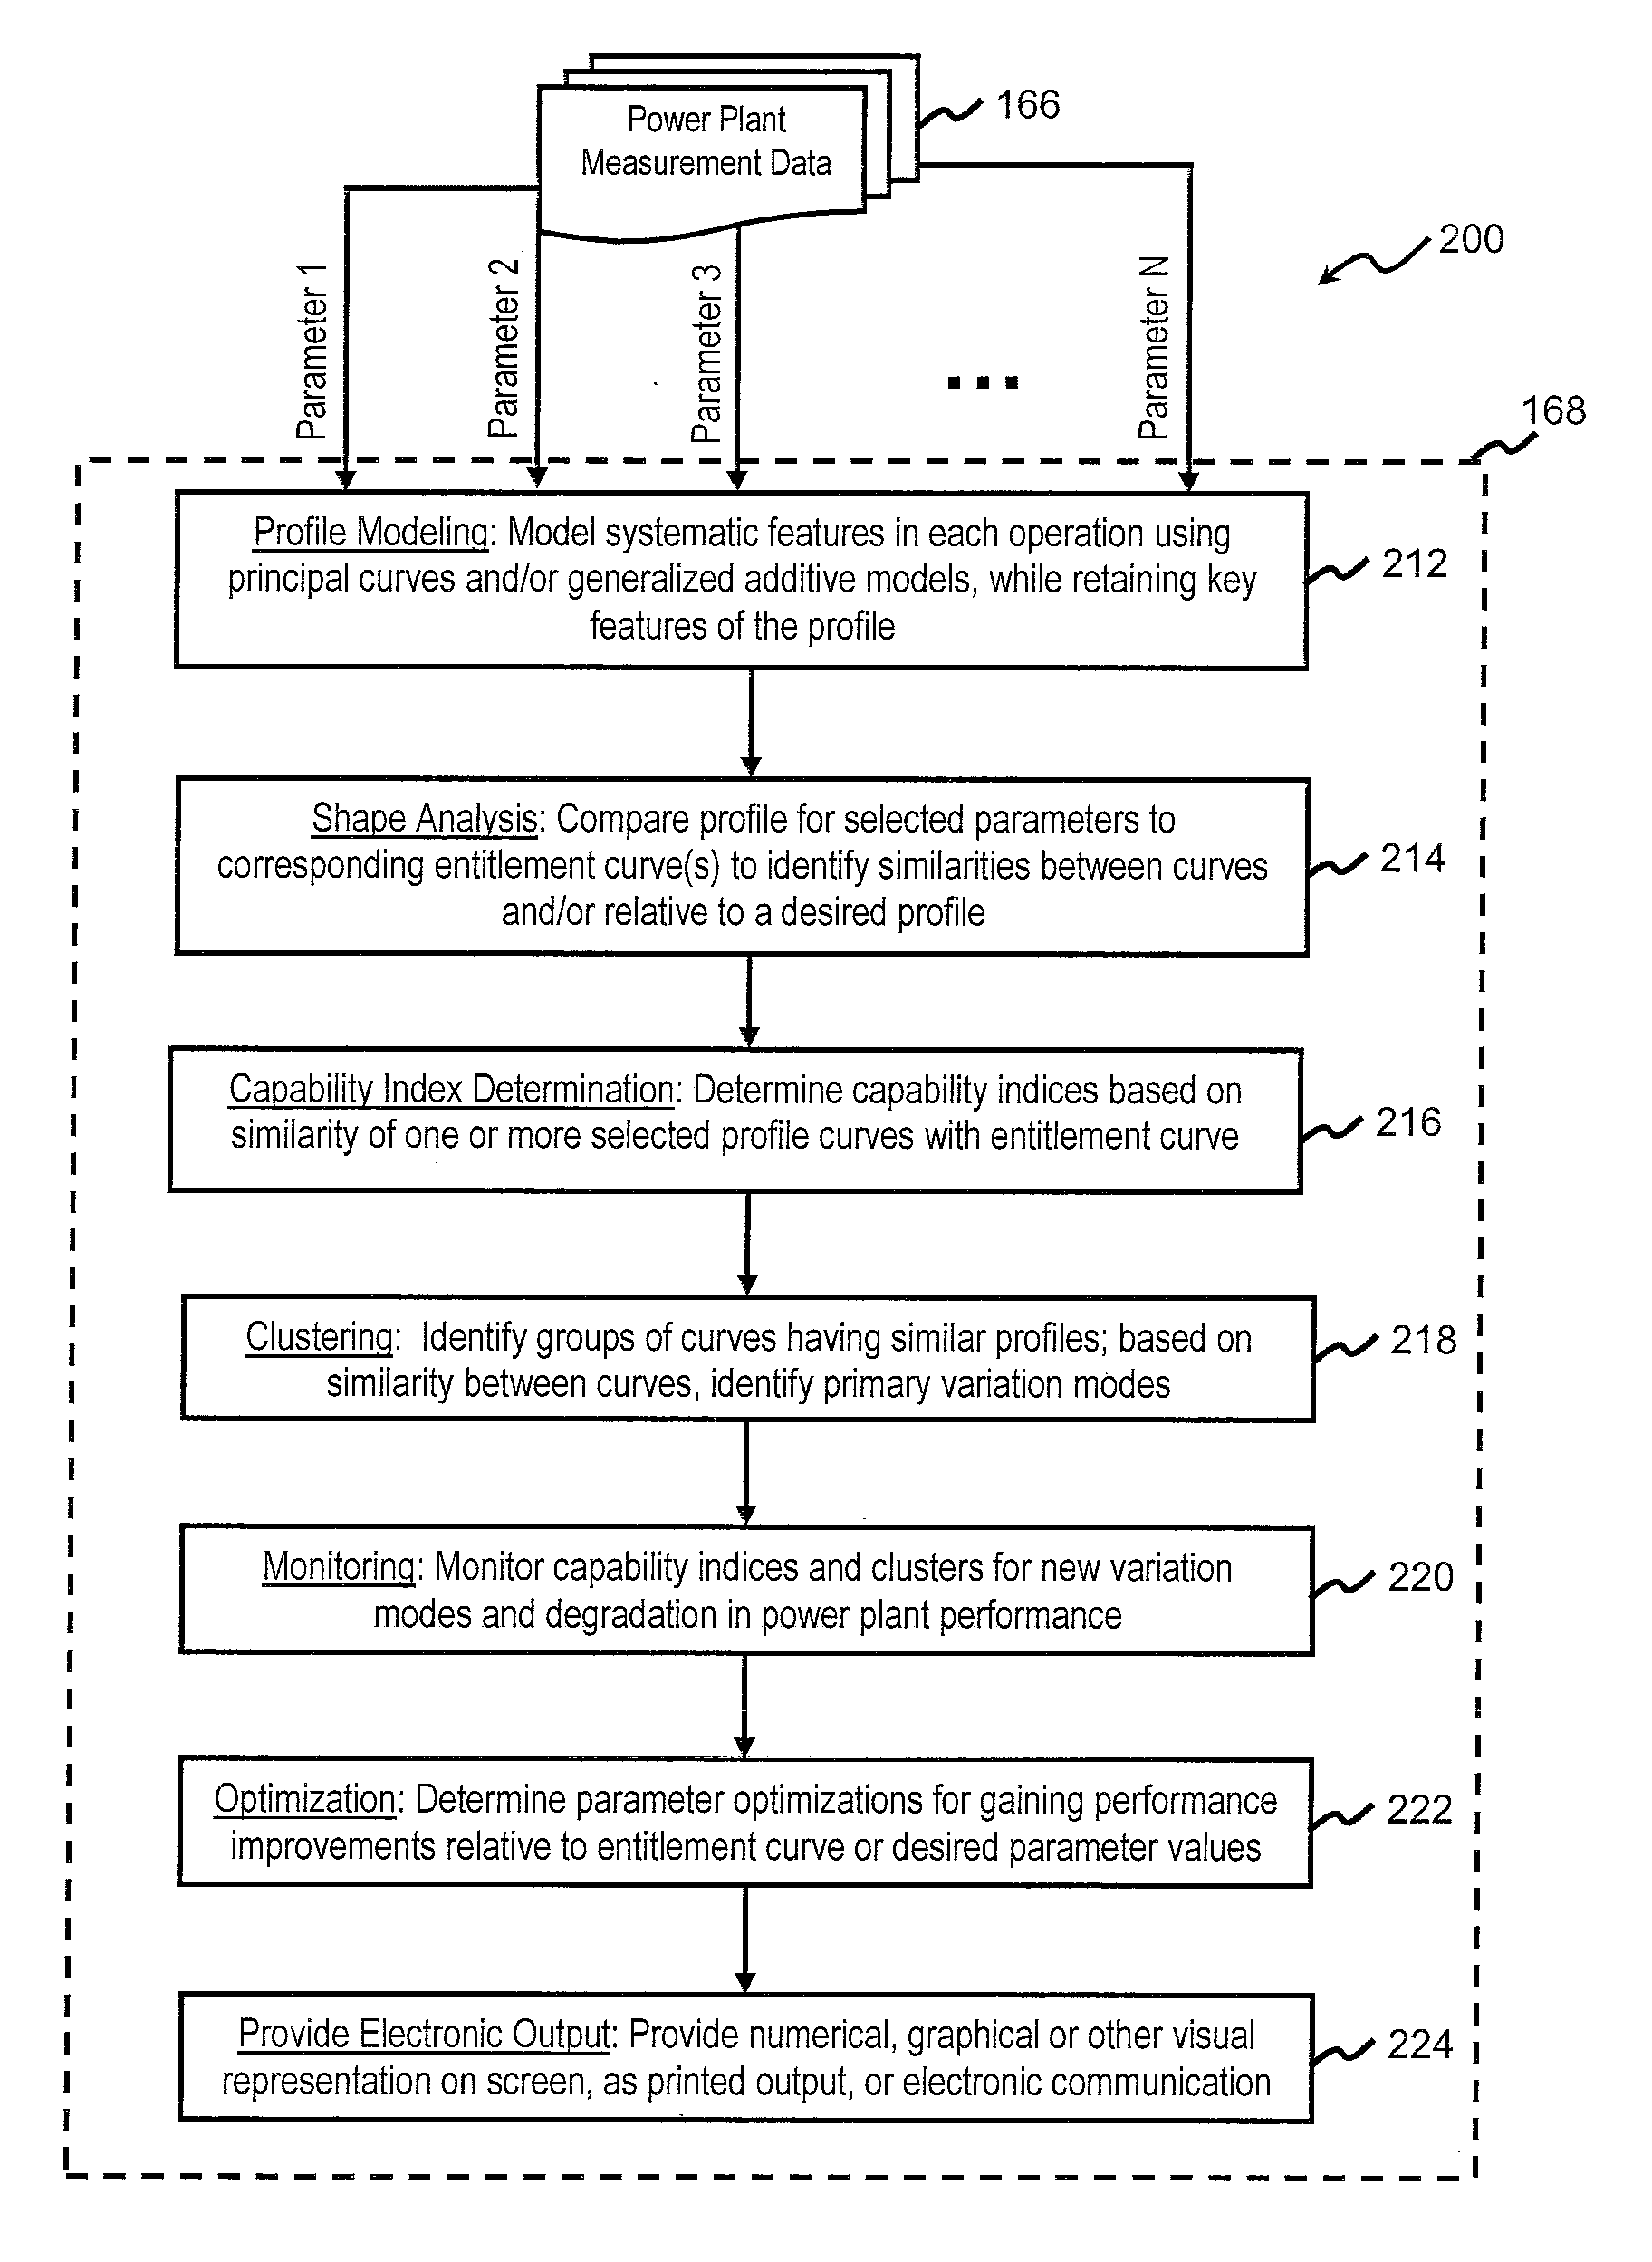
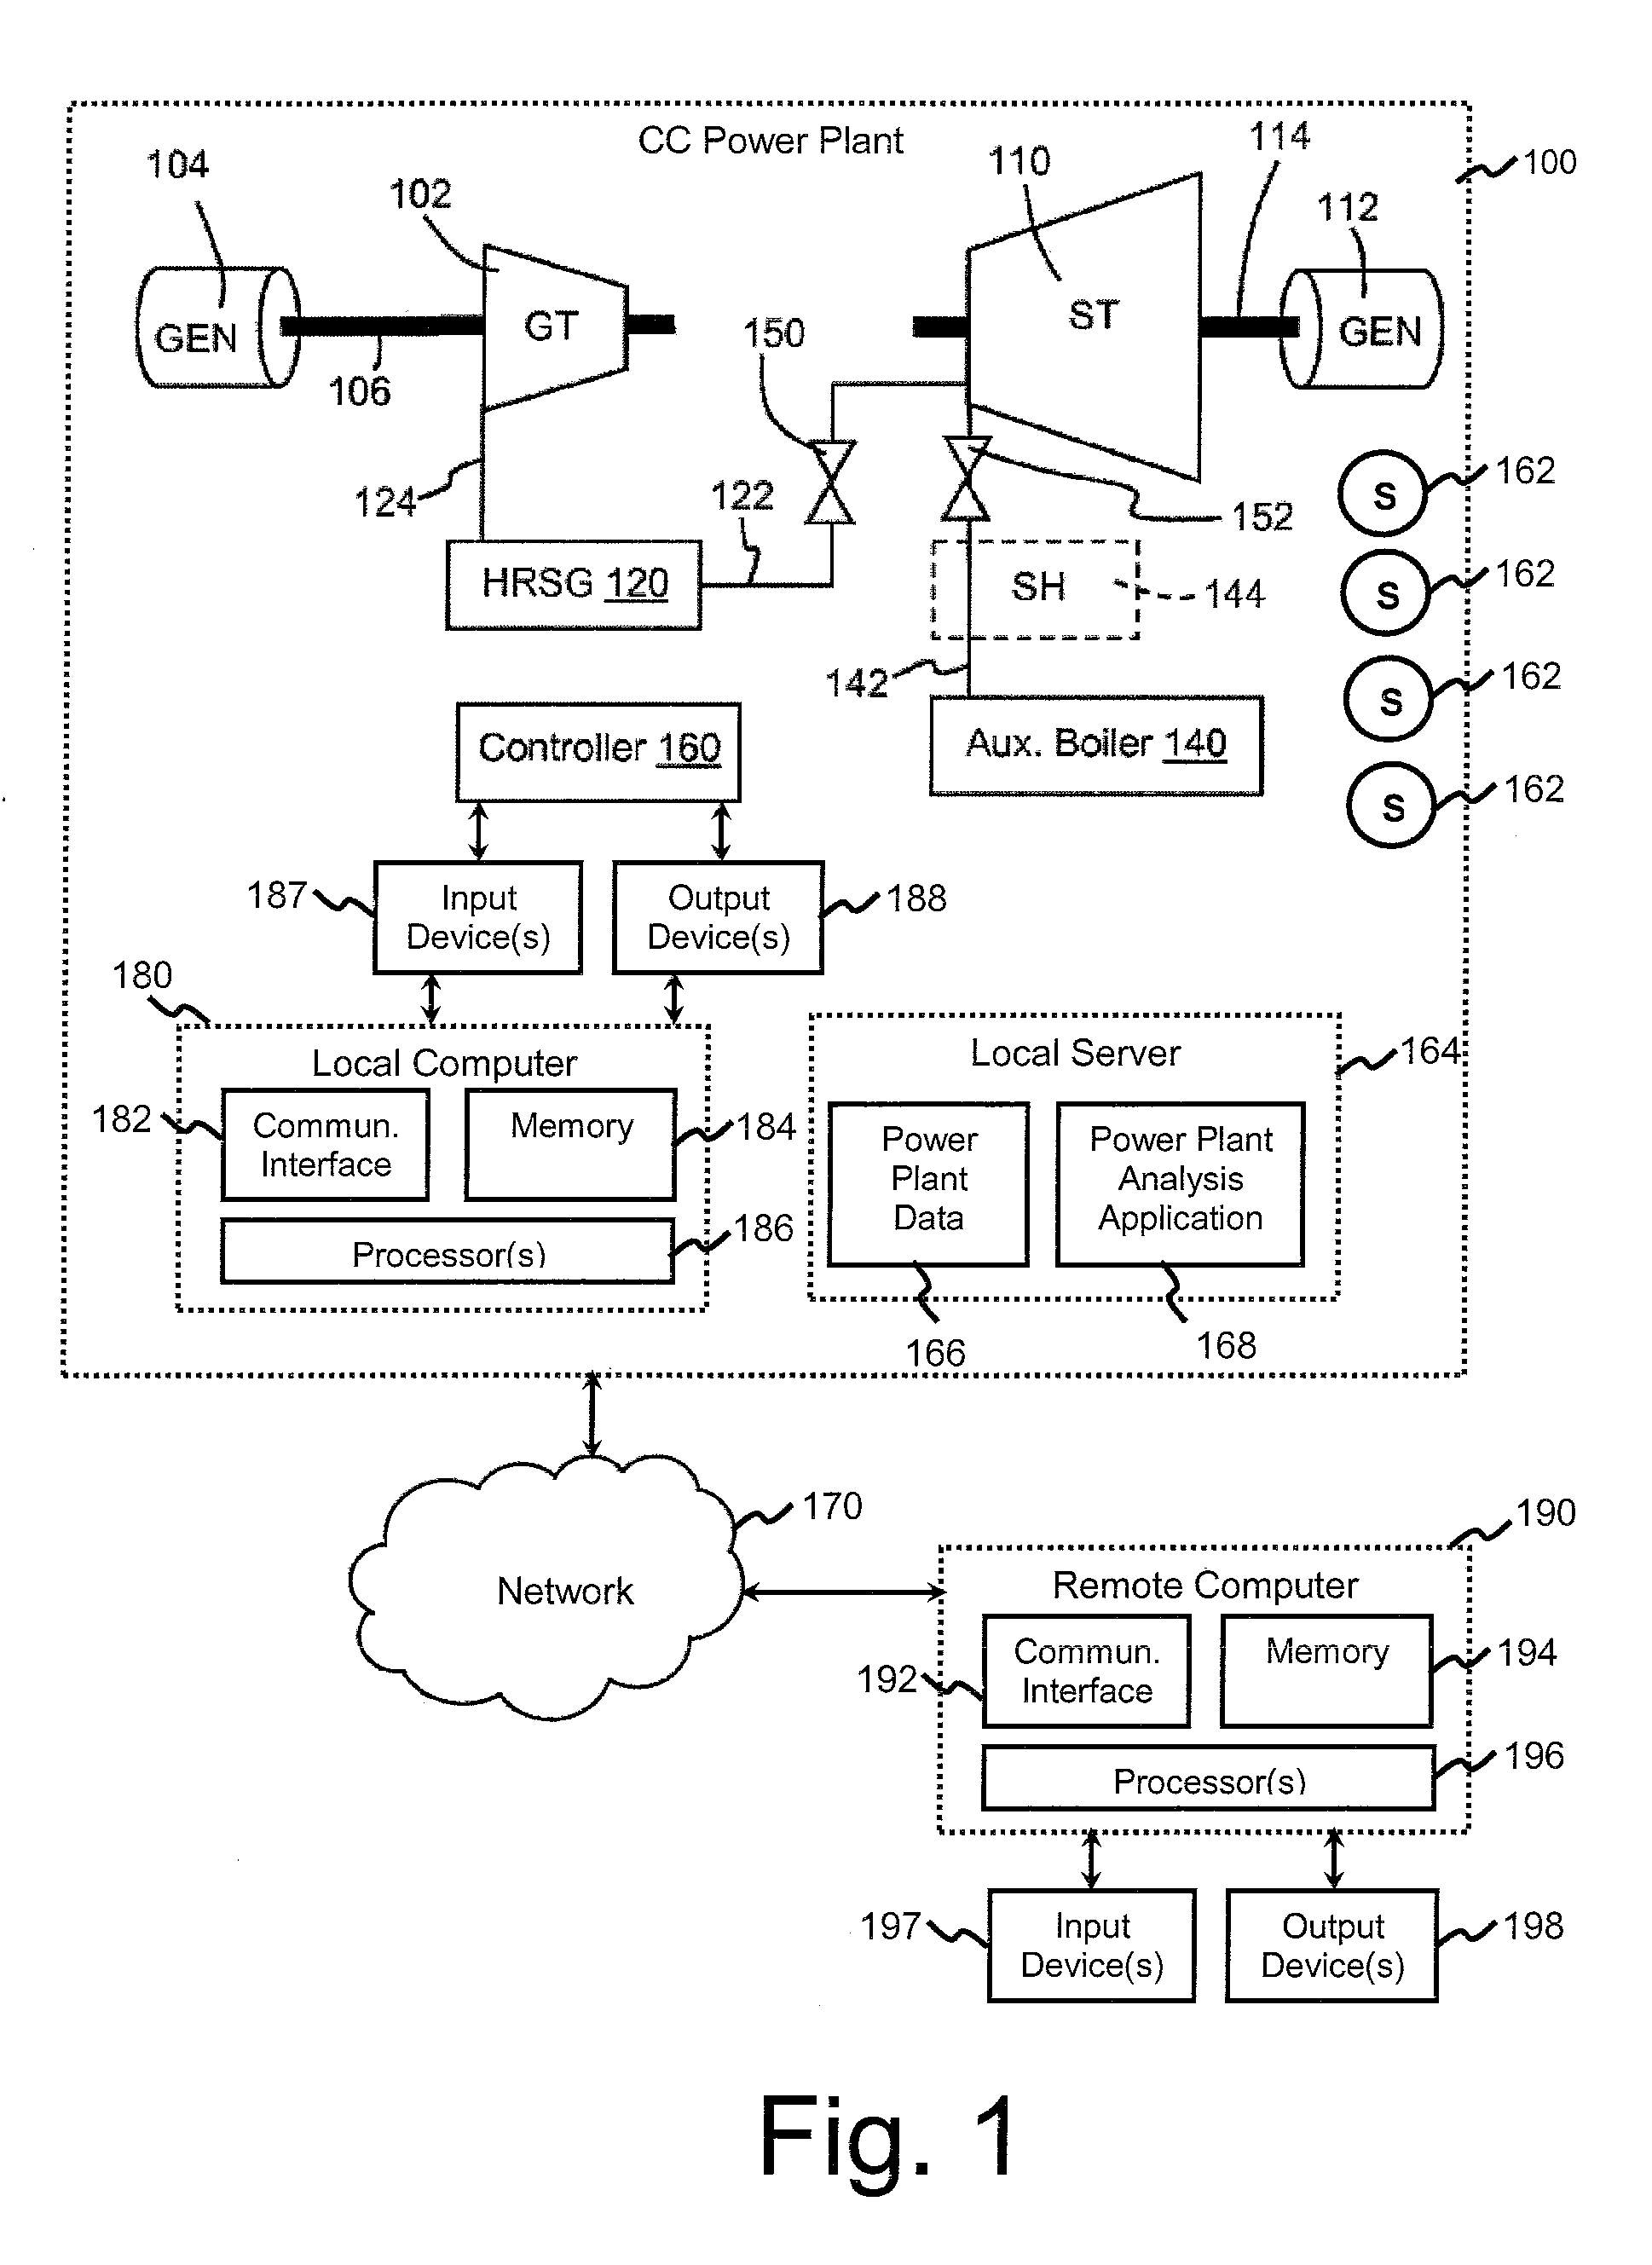
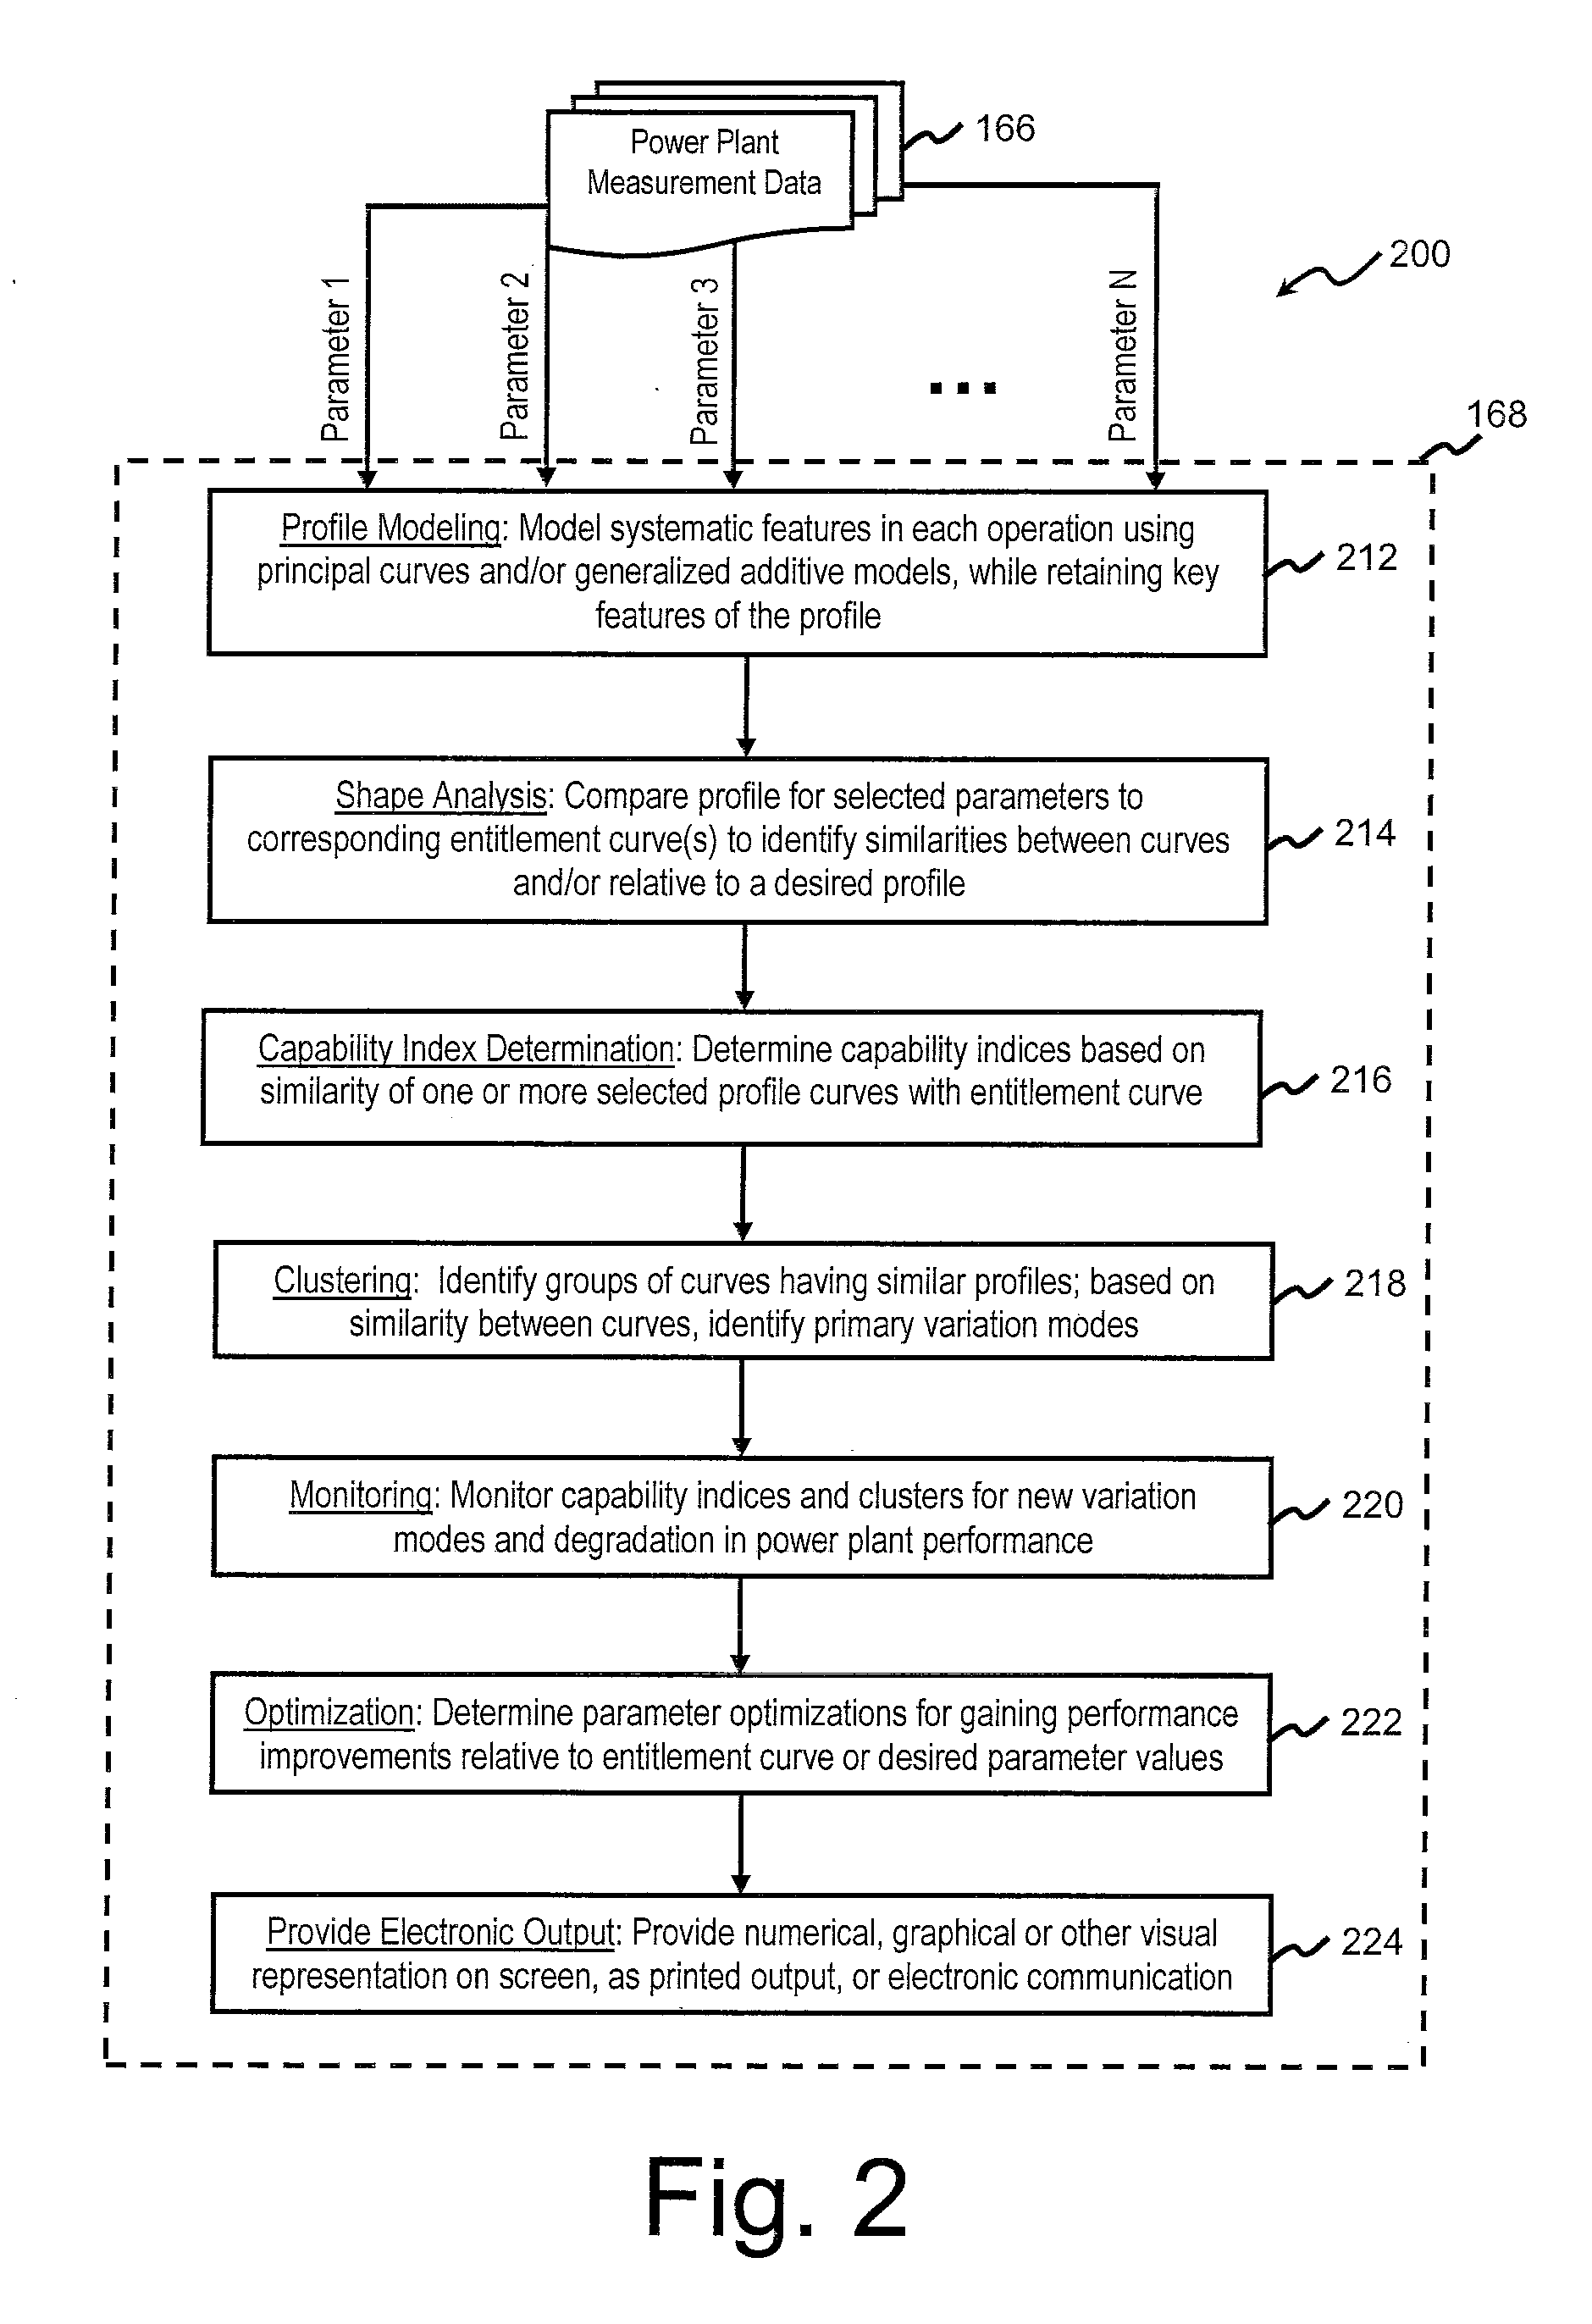
[0022]In general, FIGS. 1-9 illustrate various aspects of the presently disclosed systems and methods for implementing automated statistical comparison of shape and variation modes for operational profiles of power plant operations. FIG. 1 illustrates various exemplary hardware and software components that may be used in one of the subject systems. FIGS. 2 and 5 illustrate exemplary steps in a method of implementing exemplary aspects ...


PUM


Abstract

Systems and methods for analyzing power plant data include accessing data for one or more monitored parameters, generating a continuous time-series profile model (e.g., by generalized additive model and/or principal curves techniques) of selected parameters during instances of at least one given type of power plant operation, and conducting shape analysis by comparing the continuous time-series profile model of selected monitored parameters to an entitlement curve representing ideal performance for the at least one given type of power plant operation. Data associated with the profile modeling and shape analysis techniques may be provided as electronic output to a user. Additional steps or features may involve determining a capability index for selected monitored parameters, clustering together identified groups of profile models having similar profiles, monitoring and/or optimizing parameters to identify and improve power plant performance.

Description

FIELD OF THE INVENTION[0001]The subject matter disclosed herein relates to systems and methods for implementing automated electronic analysis of power plant operations, and more particularly, to systems and methods of statistically comparing the shape and variation modes of operational profiles for power plant operations.BACKGROUND OF THE INVENTION[0002]Highly complex industrial operations such as implemented within a power plant environment often involve the sophisticated coordination of multiple machines and associated processes. Many of the industrial components within such a power plant environment may include sensors or other monitoring equipment in conjunction with a computing device so that the real-time conditions of such components can be electronically tracked. For example, some display panels within a power plant environment are capable of displaying various present plant operating conditions associated with the monitored respective components or processes within the plan...

Claims


Application Information

Patent Timeline
Patent Type & Authority Applications(United States)
IPC IPC(8): G06F1/28G05B13/04G06F15/18
CPCG05B23/024
Inventor MANNAR, KAMALASATI, MAHESH KUMARPANDEY, ACHALESH KUMARESTRADA, KELVIN RAFAEL
Owner GENERAL ELECTRIC CO
Why Eureka
Try Eureka