Interactive data visualization for trend analysis

Inactive Publication Date: 2013-01-10
IBM CORP
View PDF2 Cites 106 Cited by
  • Summary
  • Abstract
  • Description
  • Claims
  • Application Information

AI Technical Summary

Benefits of technology

[0018]Embodiments of the present invention provide an easy-to-use interactive data visualization tool that quickly searches on specified region(s) in a heat map, and based on the results of the search, quic

Problems solved by technology

“Eyeballing” the other, similar maps is a very manual process that is extremely difficult,

Method used


Image

  • Interactive data visualization for trend analysis
  • Interactive data visualization for trend analysis
  • Interactive data visualization for trend analysis

Examples


Embodiment Construction

Overview

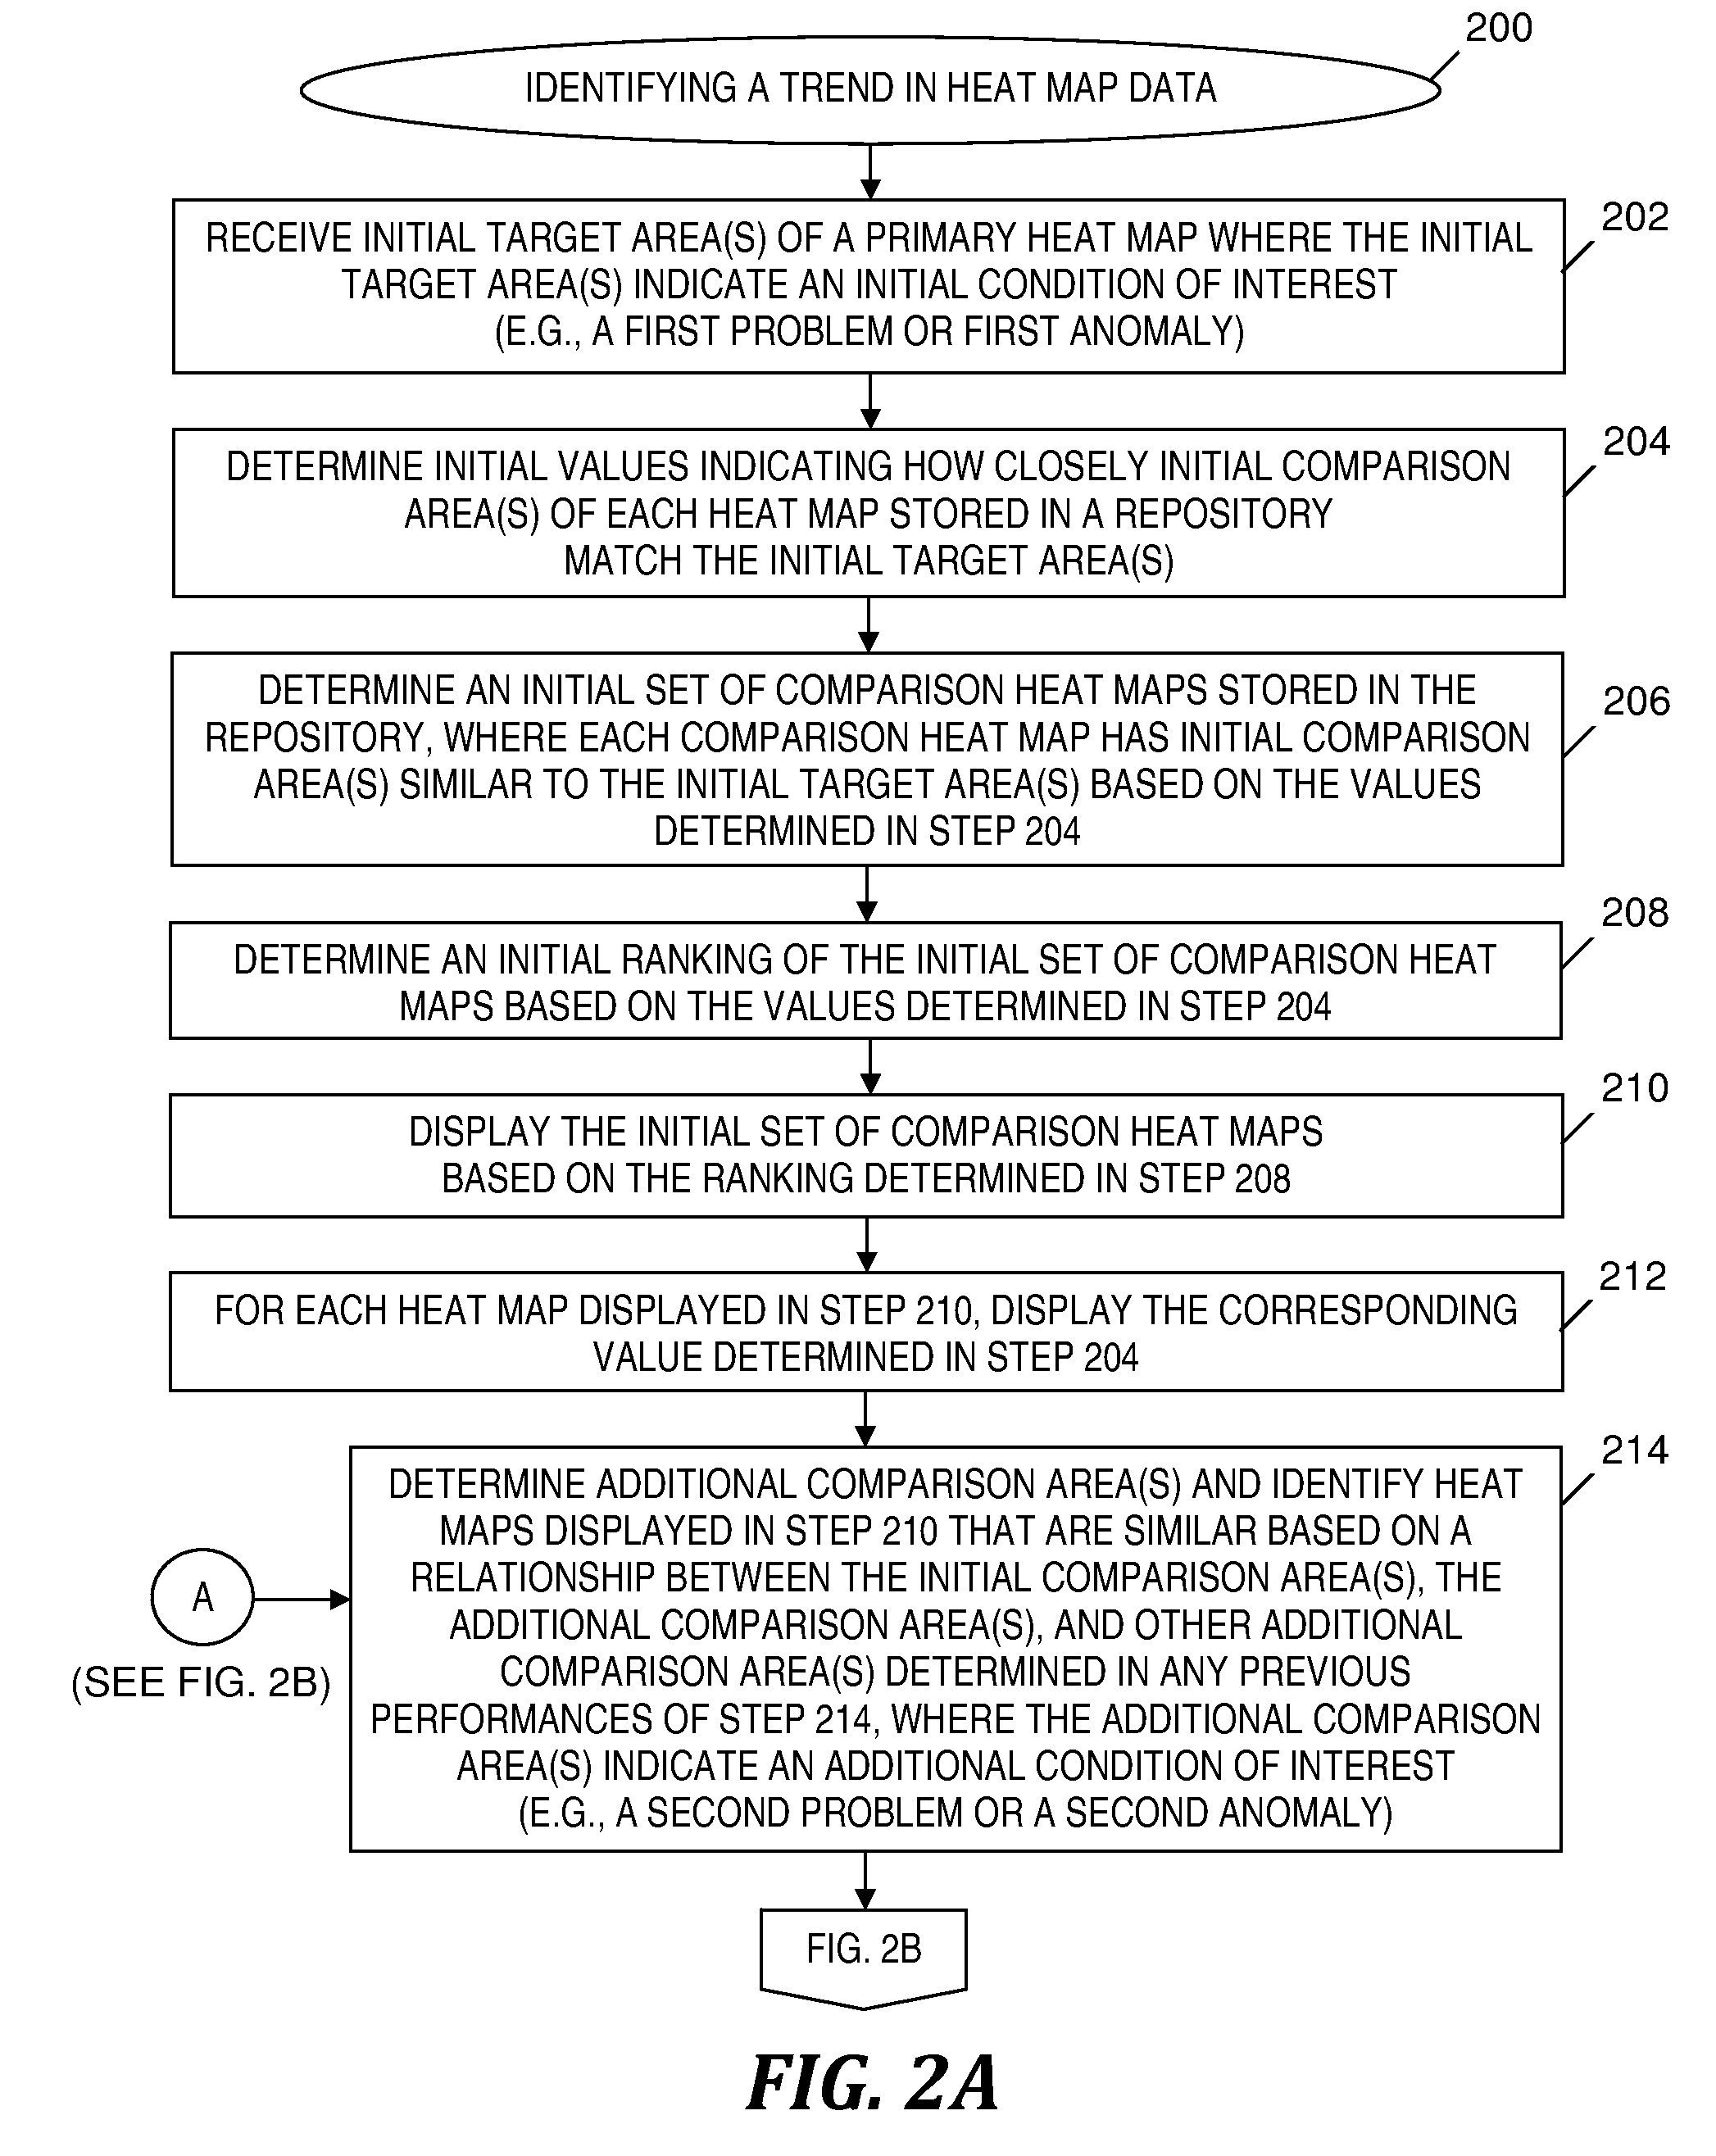
[0027]Embodiments of the present invention may provide a method and system for sifting through a large number of heat maps quickly and efficiently with the goal of finding trends in the heat map data. A user interface provided by embodiments of the present invention may allow a user to drag and drop user-configurable area(s) (e.g., rectangles and / or other shapes) onto a template heat map to specify target area(s). A computer automatically compares the specified target area(s) against a repository of heat maps to quickly find other heat maps having area(s) that are similar to the target area(s). An analysis of the heat maps found to have area(s) similar to the target area(s) facilitates identifying trends in heat map data.

System for Trend Identification in Heat Map Data

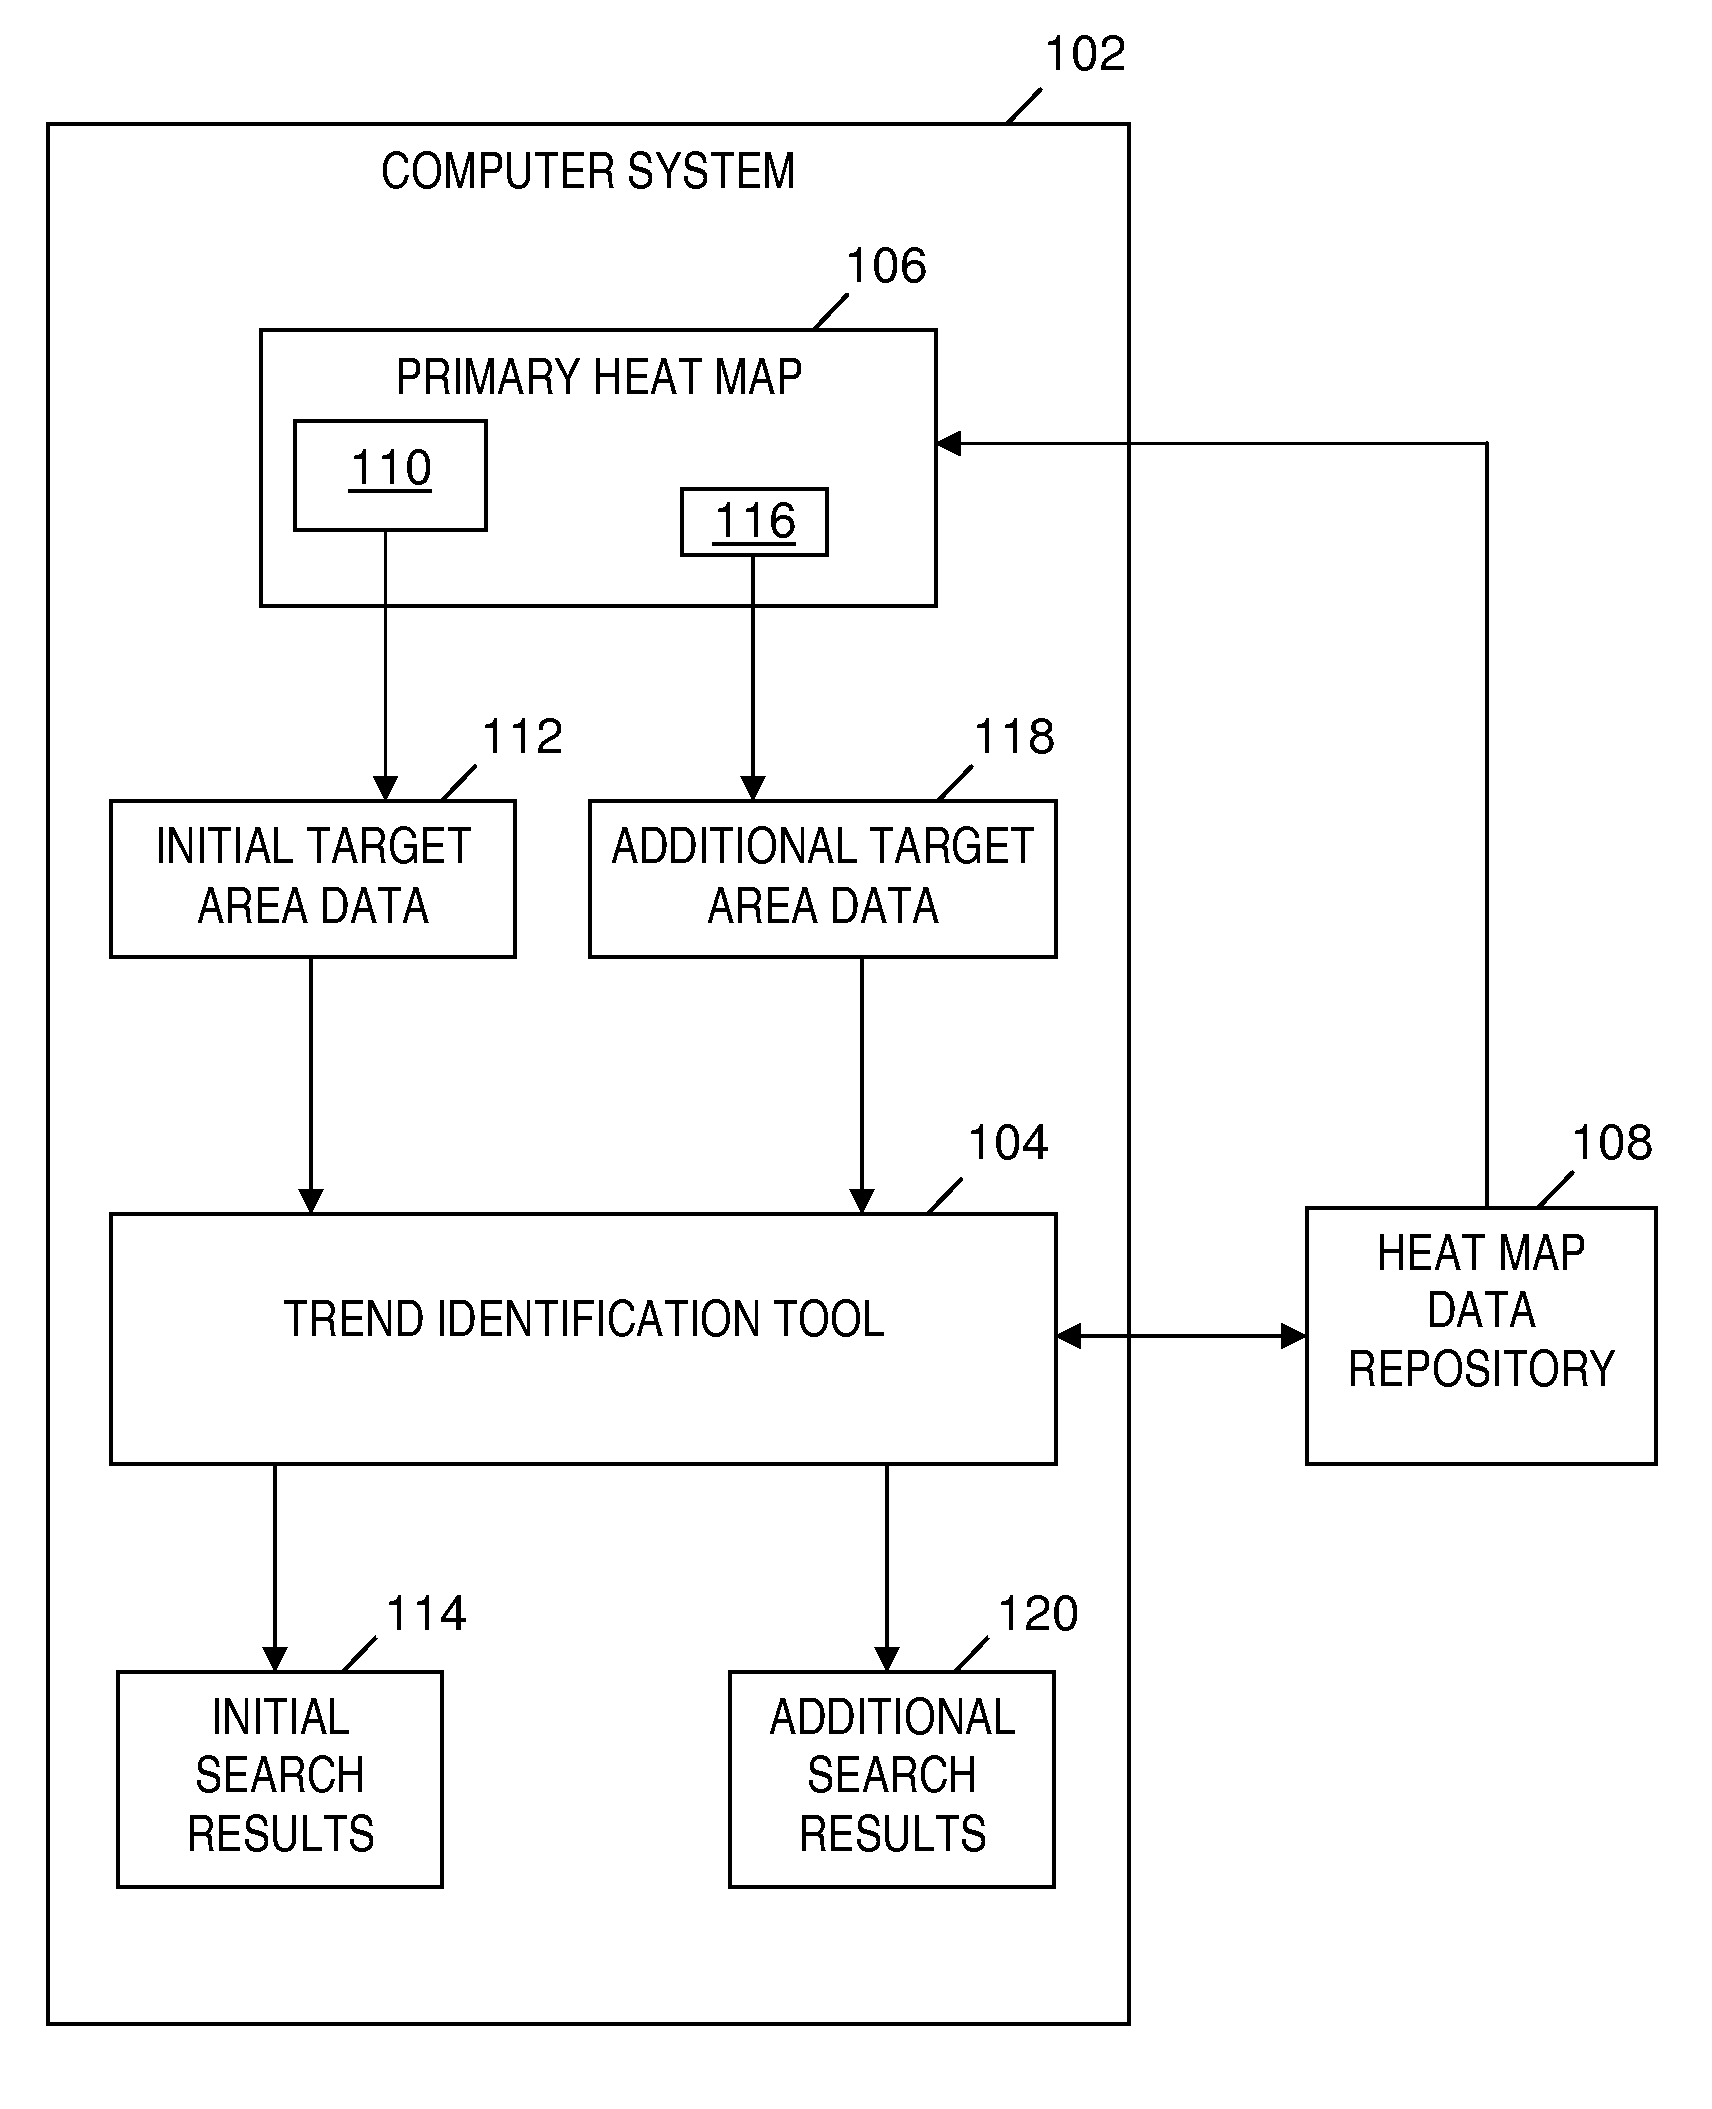
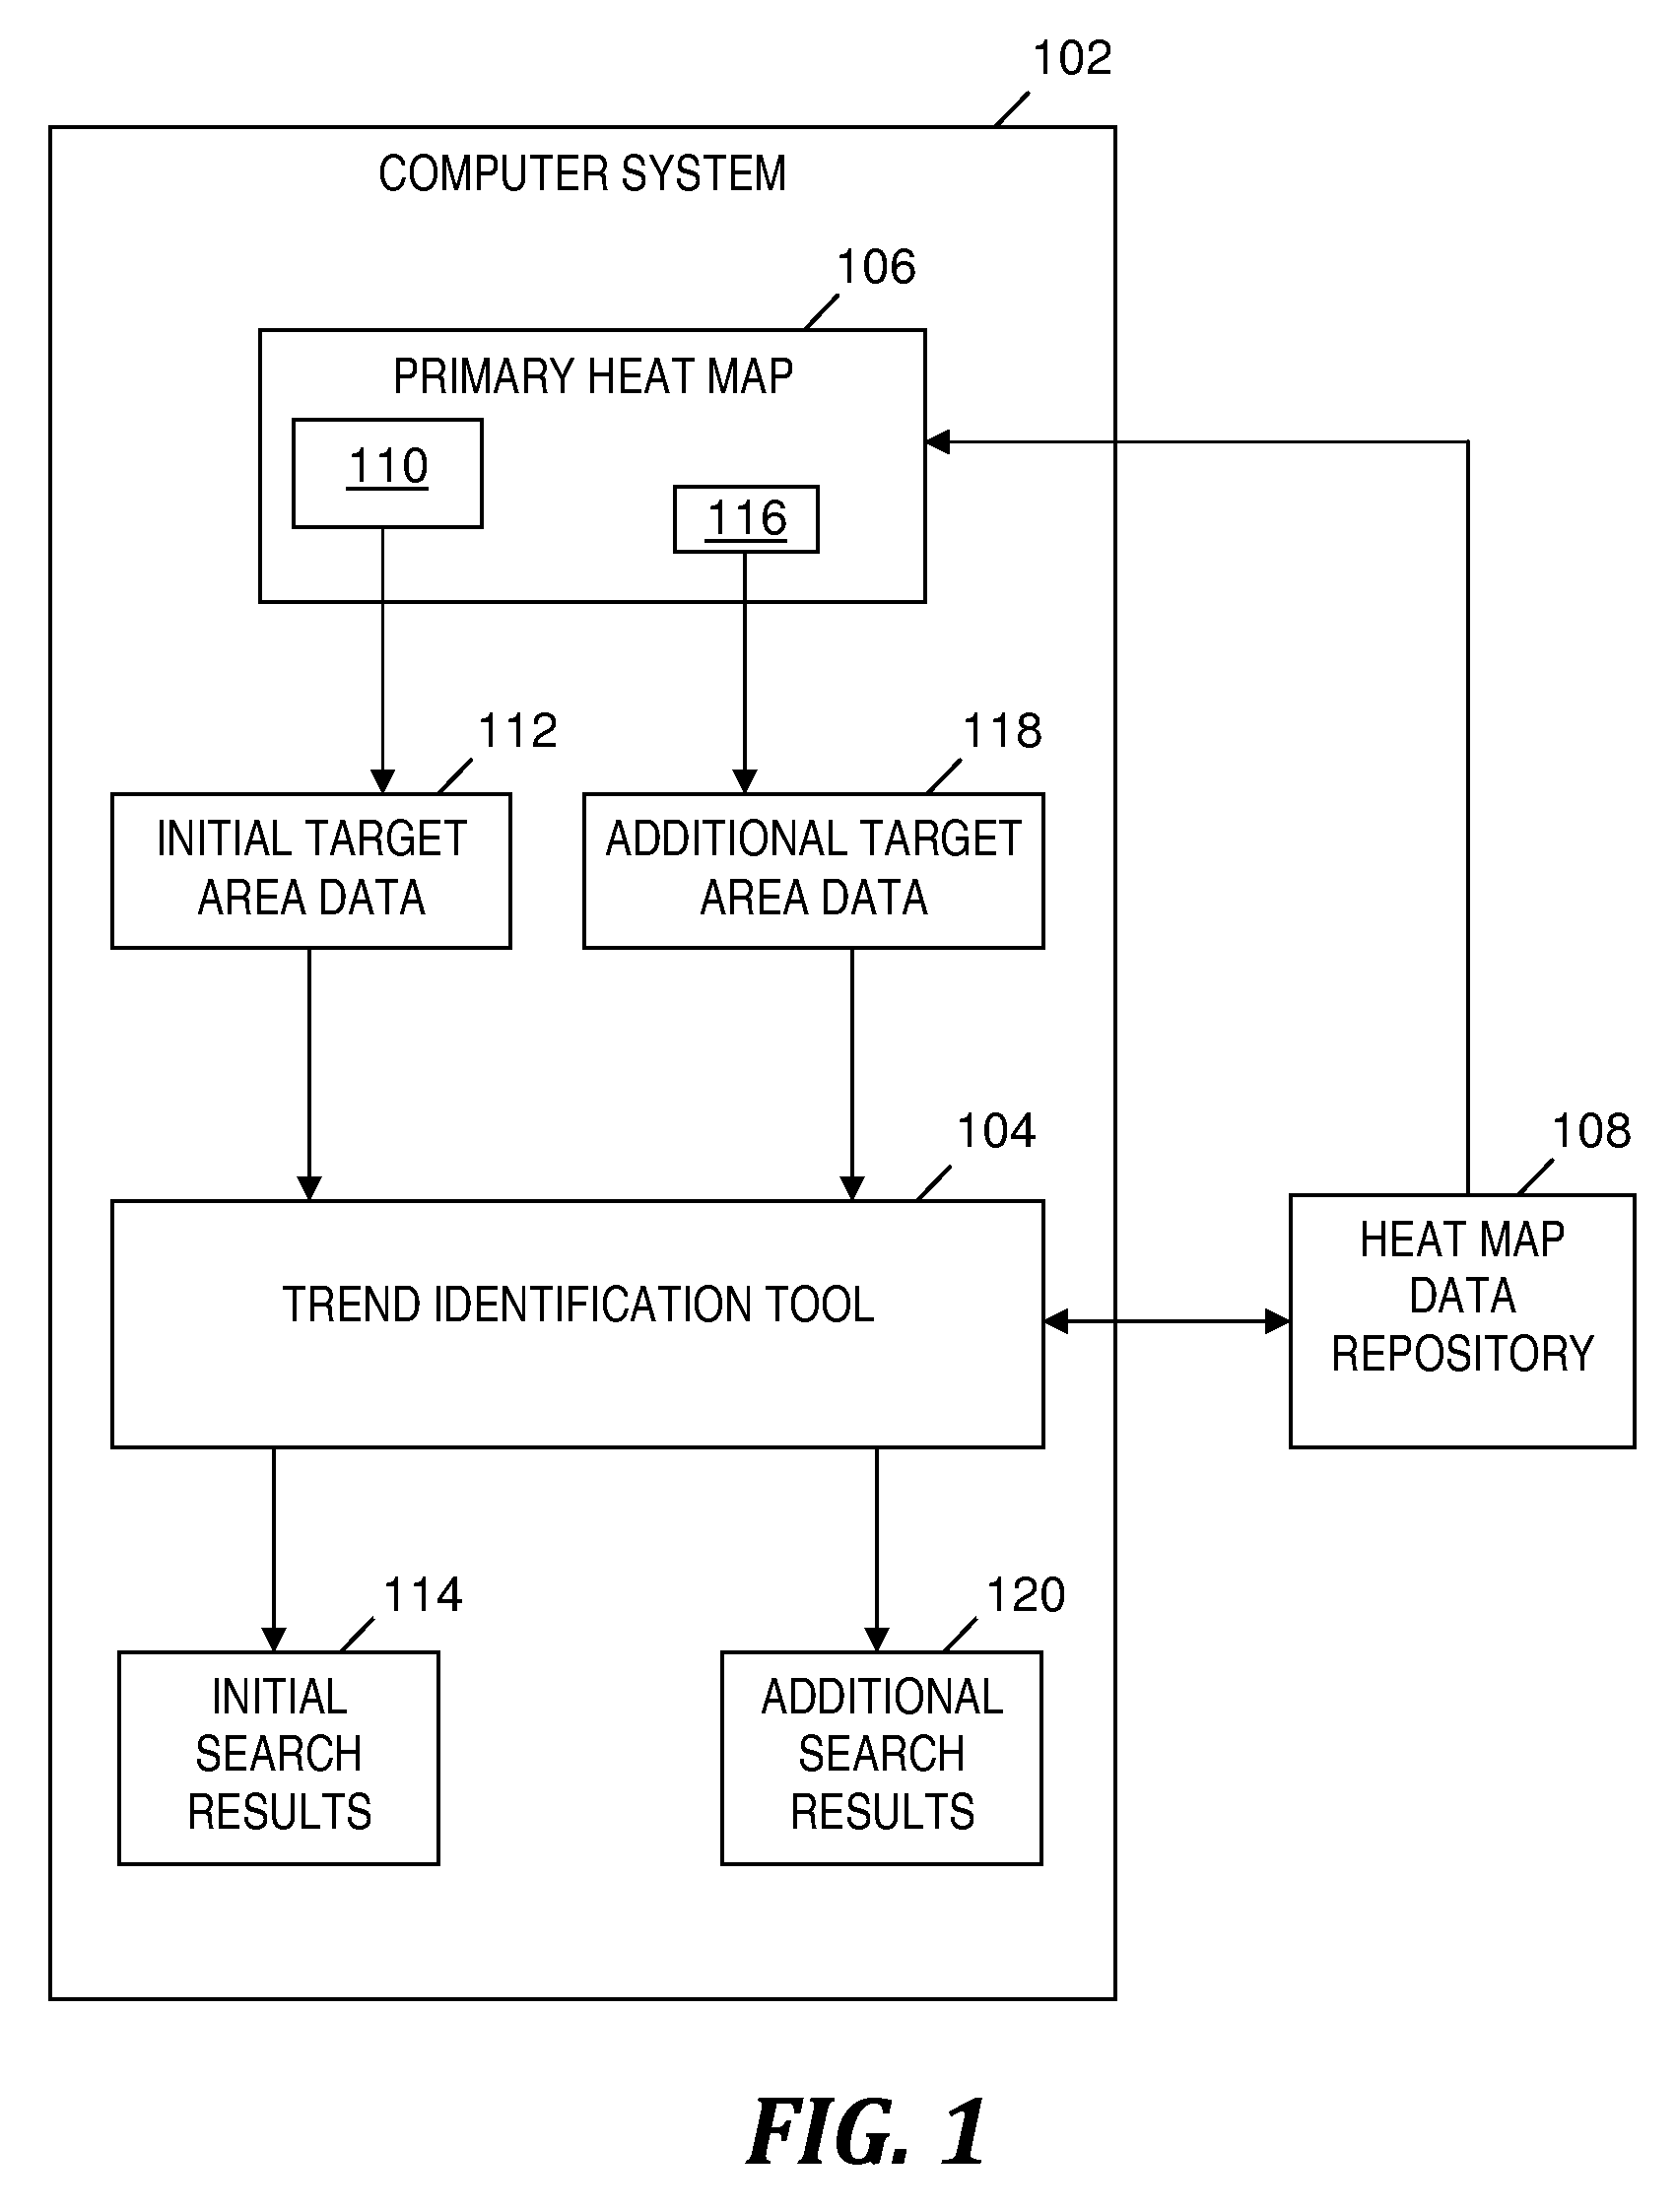
[0028]FIG. 1 is a block diagram of a system for identifying a trend in heat map data, in accordance with embodiments of the present invention. System 100 includes a computer system 102 that includes a software-...


PUM


Abstract

A method and system for identifying a trend in data of heat maps. An initial set of comparison heat maps included in the repository is determined and displayed based on how closely initial comparison area(s) of each comparison heat map match initial target area(s) of a first heat map. A review of the initial set of comparison heat maps determines additional comparison area(s) corresponding to additional target area(s) of the first heat map. In an iterative process, an additional set of comparison heat maps is determined and displayed based on how closely initial and additional comparison areas match respective initial and additional target areas of the first heat map. A trend relating initial and additional target areas is identified based on the displayed additional set of comparison heat maps and based on how closely comparison areas match their respective target areas.

Description

TECHNICAL FIELD[0001]The present invention relates to a data processing method and system for identifying trends in data visualizations, and more particularly to a data processing and search technique for identifying trends in heat map data by interactively managing searches of heat maps.BACKGROUND[0002]Known methods for identifying a root cause of an anomaly shown in a heat map or a tree map includes collecting other, similar heat maps or tree maps and looking for and identifying trends shown by the collected maps. By “eyeballing” the other, similar maps, a person discovers and analyzes related anomalies. By analyzing the related anomalies, the person identifies the root cause of the anomaly. “Eyeballing” the other, similar maps is a very manual process that is extremely difficult, time-consuming and error-prone when a large number of heat maps or tree maps is available. Thus, there exists a need to overcome at least one of the preceding deficiencies and limitations of the related ...

Claims


Application Information

Patent Timeline
IPC IPC(8): G06F15/00
CPCG06F11/3082G06F11/3452
Inventor BRUGLER, THOMAS S.CRAIG, RANDALL A.CONZOLA, VINCENT C.EISCHEID, TODD M.MOLANDER, MARK E.
Owner IBM CORP
Why Eureka
Try Eureka