Methods and Apparatus for Obtaining Enhanced Mass Spectrometric Data

a mass spectrometry and enhanced technology, applied in the field of mass spectrometry, can solve the problems limiting the precision and resolution of the mass measurement, and degrading the accuracy of the ion abundance in the mass spectra, so as to achieve high resolution, increase the stability of the mass spectrum, and solve the problem of reducing the overall quality of the mass spectra

Active Publication Date: 2013-11-21
THERMO FISHER SCI BREMEN
View PDF12 Cites 16 Cited by
  • Summary
  • Abstract
  • Description
  • Claims
  • Application Information

AI Technical Summary

Benefits of technology

[0072]An advantage of the invention lies in providing a mass spectrum of high resolution and resolving power.
[0073]Another advantage of the invention lies in an increased stability of a mass spectrum obtained from a measured noisy transient data, i.e. a reduction of spurious peaks, peak splitting and/or other artefacts, compared to the FDM method and other LP methods.
[0074]Thus, the invention may enable a high fidelity mass spectrum to be obtained from a measured noisy transient data. This may comprise the determination of all or substantially all statistically significant individual component signals (corresponding to mass-to-charge peaks in the mass spectrum), each of them characterized with a number of parameters, such as frequency, amplitude, decay, and phase, and optionally estimating confidence intervals for one or more of these parameters.
[0075]A still further

Problems solved by technology

Although robust and fast, FT has a frequency resolution uncertainty ΔfFT which restricts both the precision and resolution of mass measurements and thus limits the overall quality of the mass spectra.
Furthermore, FT does not provide explicit information about the decay rate of any harmonic component of a spectrum, which degrades the accuracy of the ion abundances in the mass spectra.
Although the resulting spectral peaks are somewhat narrower and side-lobes are suppressed, this method still fails to provide resolution beyond the FT uncertainty described above.
Moreover, the phase-corrected FT algorithm employed requires exact knowledge of the expected signal phase, which is not always a priori known for FTMS signals and is not necessarily preserved throughout the entire mass range.
Although a generalisation of the method to the case of K peaks that overlap in the FT domain is straightforward, it necessarily leads to a non-linear problem of finding K sets of individual spectral parameters.
Therefore, in practice this method does not provide peak resolution better than 1/T.
Since a measured signa

Method used


Image

  • Methods and Apparatus for Obtaining Enhanced Mass Spectrometric Data
  • Methods and Apparatus for Obtaining Enhanced Mass Spectrometric Data
  • Methods and Apparatus for Obtaining Enhanced Mass Spectrometric Data

Examples


Embodiment Construction

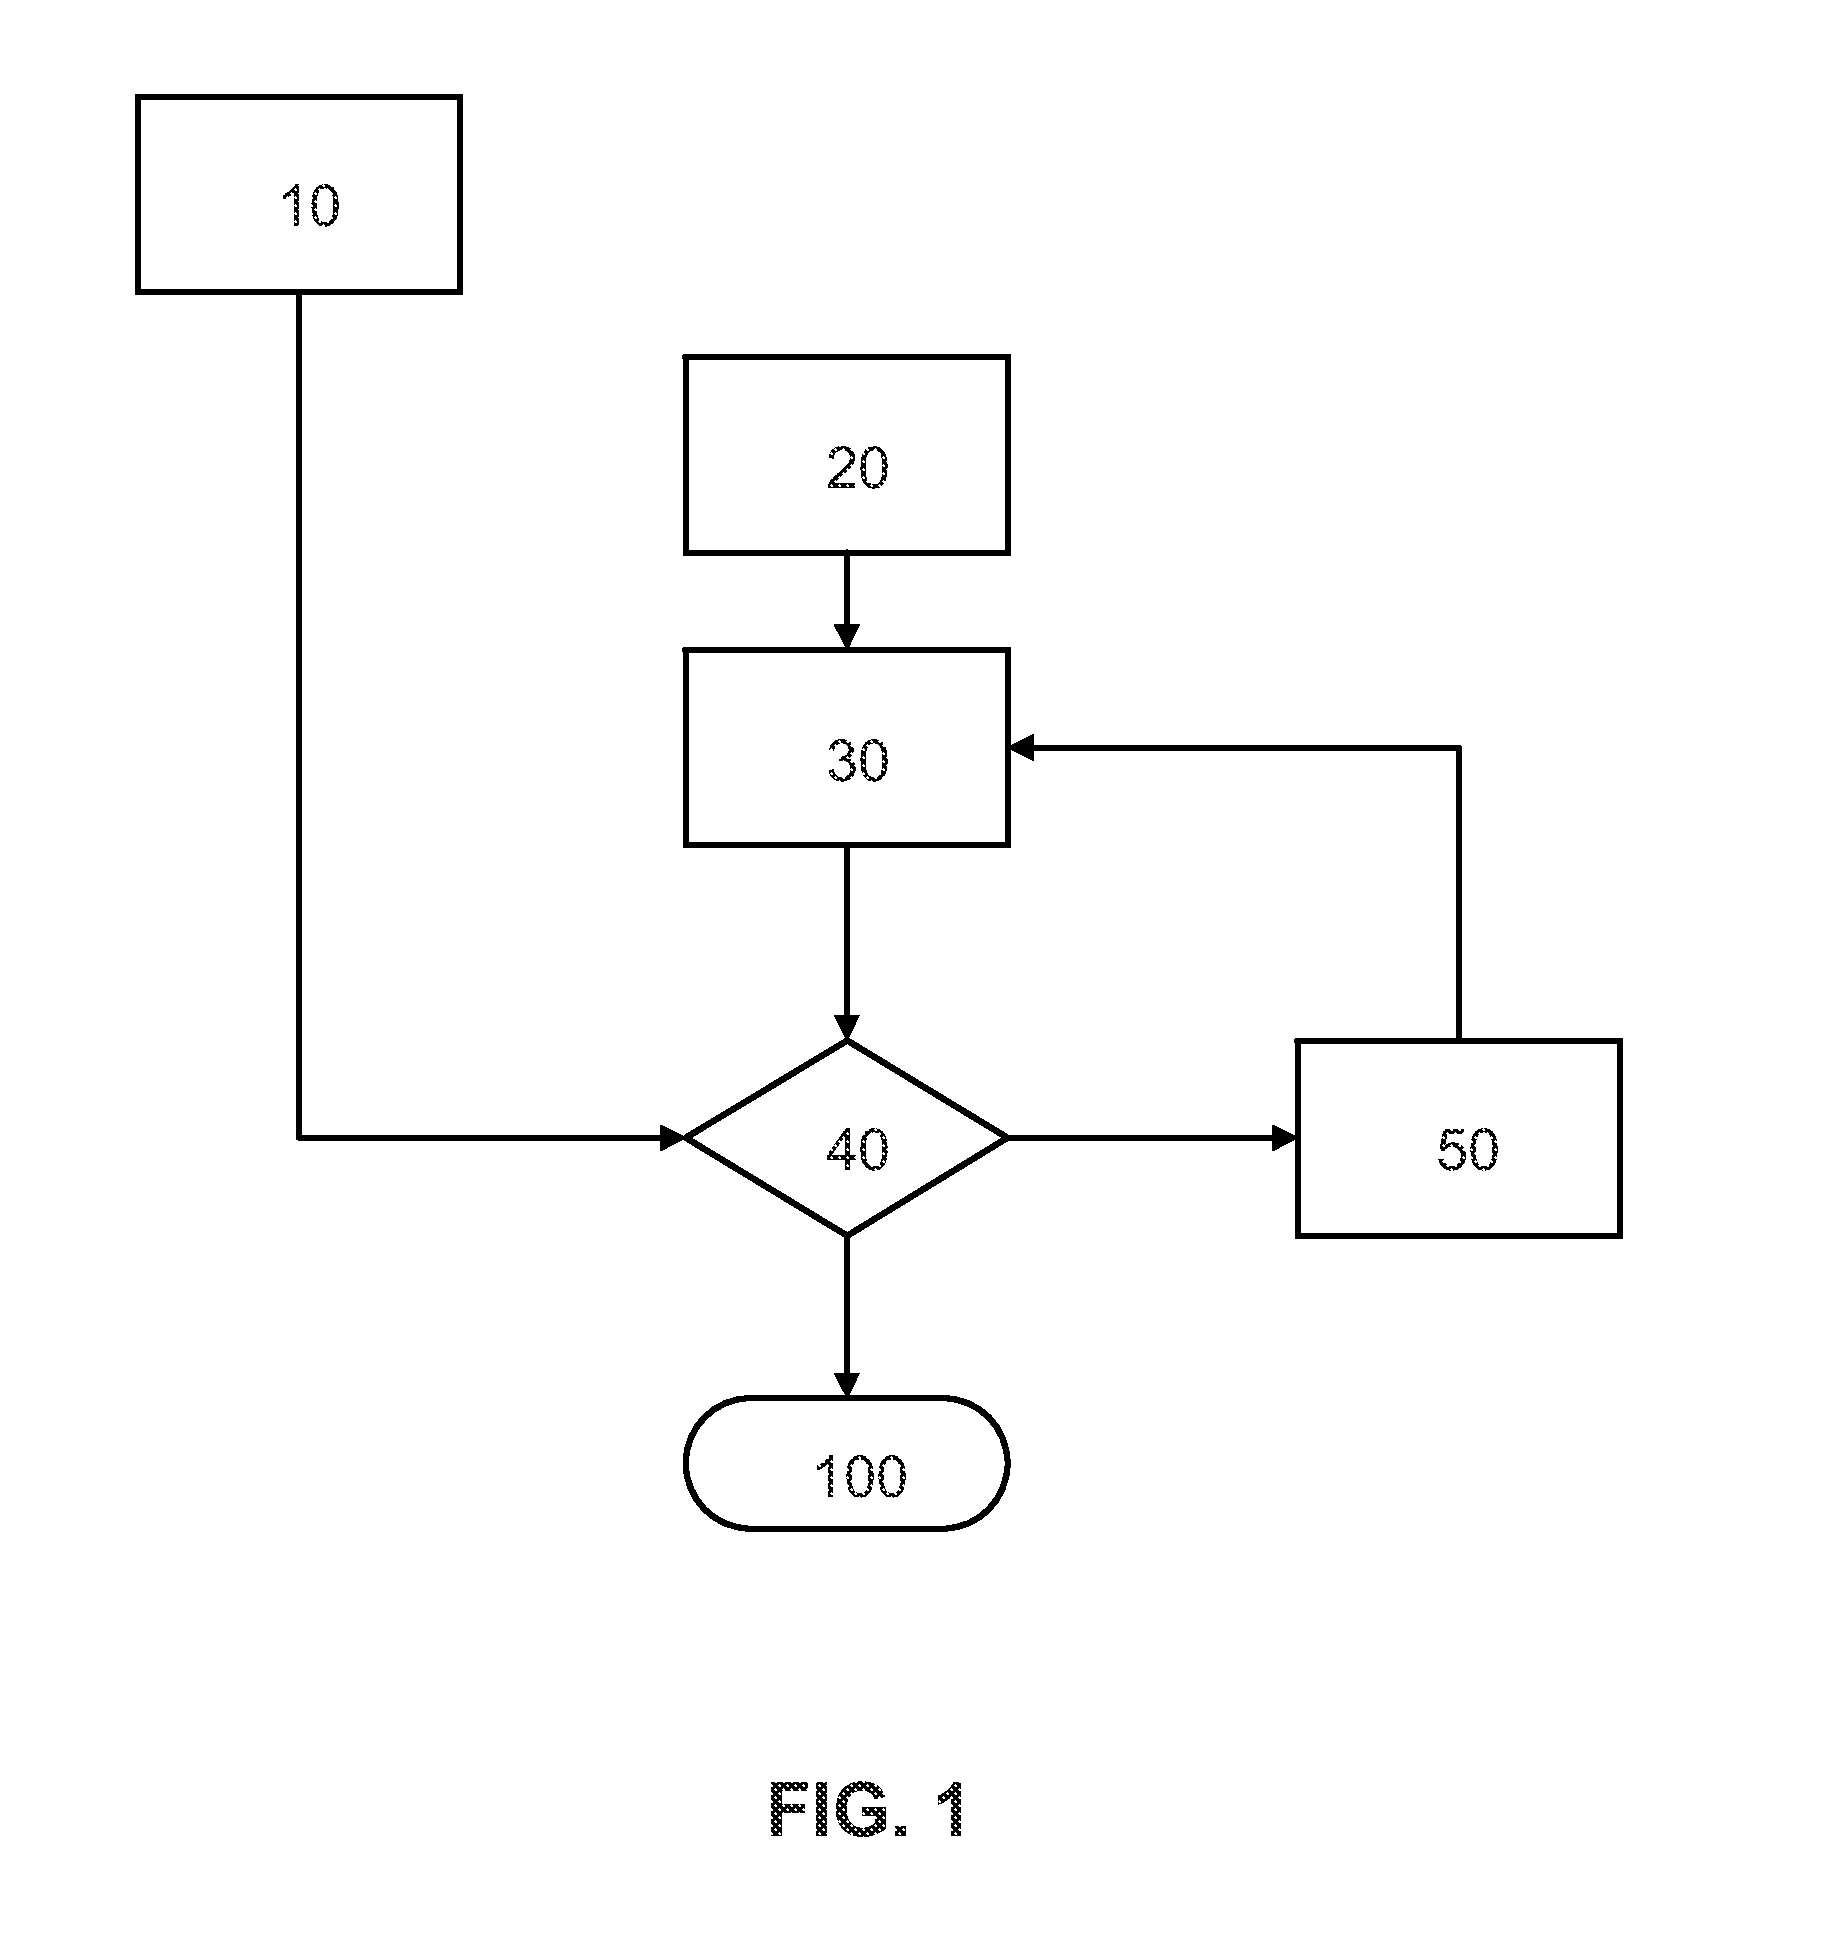
[0103]FIG. 1 shows a schematic block diagram depicting an example of the method of the present invention. In FIG. 1, a method is represented for determining harmonic component signals and their number. K, representative of different species of ions that are or were present within a mass analyser and within a range of mass-to-charge ratios, each species having a different mass-to-charge ratio. A quantity representative of the noise is determined, 10, which is representative of the noise in measured data comprising signal and noise which has been measured over time. An initial value of K is chosen, 20. A measure of difference R(K) between the measured data and model data comprising data sets of K-harmonic component signals is calculated 30. The measure of difference R(K) is compared to a noise range based upon the quantity representative of noise, 40, and if R(K) does not lie within the noise range, a new value of K is chosen, 50, and the measure of difference R(K) between the measure...


PUM


Abstract

A method comprising decomposing mass spectrometry data, especially of ion species that undergo multiple direction changes in a periodic manner, the data comprising signal and noise measured over time, into a sum of K harmonic component signals and a noise component, wherein the harmonic component signals and their number K are derived from the data and a determined quantity representative of the noise. The harmonic component signals and their number K may be determined iteratively on the basis of: using an initial value of K to calculate a minimised non-negative measure of difference R(K) between the measured and model data comprising data sets of K-harmonic component signals, and if R(K) does not lie within a noise range based on the quantity representative of the noise, changing the value of K and recalculating R(K) until R(K) lies within the noise range. Mass spectral information may be derived from the model data set.

Description

FIELD OF THE INVENTION[0001]This invention generally relates to mass spectrometry, particularly to methods and apparatus for obtaining enhanced mass spectrometric data. An aspect of the invention relates to methods of determining a measure of how many different species of ions are present within a mass analyser within a range of mass-to-charge ratios. Further aspects relate to determining the mass-to-charge ratios and abundances of such ions.BACKGROUND OF THE INVENTION[0002]Mass Spectrometry (MS) is a widely used analytical technique for characterising atomic and / or molecular compositions by measuring the masses, or more particularly the mass-to-charge ratios, of ionized analytes in an electric and / or magnetic field of a mass analyser.[0003]Among the various types of mass spectrometers, Fourier Transform Mass Spectrometers (FTMS) are known as the instruments providing the highest accuracy, resolution and resolving power. The method of FTMS analysis is based on trapping ions, for ins...

Claims


Application Information

Patent Timeline
IPC IPC(8): H01J49/00
CPCH01J49/0036H01J49/38G06K9/0053G01R33/4625G06F2218/10
Inventor AIZIKOV, KONSTANTINGRINFELD, DMITRY
Owner THERMO FISHER SCI BREMEN
Why Eureka
Try Eureka