Automated presentation of information using infographics

an infographic and automatic technology, applied in the field of data display, can solve the problems of many professionals who lack the ability to produce attractive graphics on their own, let alone infographics, and do not employ infographics to present their professional résumé or profile, and convey information about their accomplishments, skills, capabilities, services, or effectiveness

Active Publication Date: 2014-05-22
YAHOO ASSETS LLC
View PDF6 Cites 53 Cited by
  • Summary
  • Abstract
  • Description
  • Claims
  • Application Information

AI Technical Summary

Problems solved by technology

However, most professionals (including, e.g., individuals, organizations, professional practitioners, service providers, and small-business owners) do not employ infographics to present their professional résumé or profile, nor to convey information about their accomplishments, skills, capabilities, services, or effectiveness, for various reasons.
At the most fundamental level, many professionals lack the ability to produce attractive graphics on their own, let alone infographics designed to effectively convey particular personalized professional or service information.
In addition, the typical professional does not have their personal or professional data organized in a coherent and usable format for the construction of an infographic via a purely algorithmic drawing technique.
Often, such data is in lexical, unstructured form, such that generating an infographic would involve the costly and time-consuming process of gathering and transforming the data into a coherent and usable format.
Other barriers to the creation of infographics exist even for specialists who routinely create such infographics.
Nor are conventional methods known for tracking or quantifying a viewer's engagement with and / or attention to a given infographic, including the numbers of loads and / or views, and the numbers of clicks, views, time spent viewing, and / or events associated with the individual components of a given infographic.
Further, no systems are known for readily extracting and showing benchmarks for comparable data that happens to be expressed across a collection of infographics, especially those with varying design formats.
Additionally, there are typically no systems for packaging a collection of individual infographics into larger objects that can be treated as coherent documents, nor any methods for enabling the infographic to be dynamic and interactive, such as by showing a summary view of a set of data that can be further expanded through event-driven triggers, without having to specifically model those interactions on a one-off basis, in conjunction with a computer programmer.
Additional challenges exist because there are no known systematic, repeatable solutions for those seeking to work with collections of infographics that collectively represent more than one individual or subject area.
More specifically, there is no known systematized method for assembling a “portfolio” of professionals, where the professionals are represented by individual instances of one or more particular infographics reflecting either the identity of those professionals or some aspect of their professional skills or services.
Even if such a portfolio were assembled, there are currently no methods for normalizing the infographic presentations according to a design “override” established by a portfolio builder or viewer (including, e.g., selection of which data elements to include / exclude, and optionally remapping the presentation related to those elements).
Nor are there known methods for transmitting the portfolio to a third party or website for viewing and interaction, or methods for allowing the viewer to further remap the presentation of those elements to their own specification.
Additionally, there are no known conventional methods for dynamically creating an “aggregate infographic” that collectively summarizes the equivalent infographics in the portfolio.
Even if a portfolio as described above were assembled, there are also no known methods for measuring engagement with the portfolio as a whole, including numbers of views and identifying interaction / engagement with particular infographics within the portfolio.
Finally, there are no known methods to take a collection of homologous infographics and automatically generate benchmarks, averages, and mean comparisons, particularly where the presentation of those infographics or the amount of data they contain varies.

Method used


Image

  • Automated presentation of information using infographics
  • Automated presentation of information using infographics
  • Automated presentation of information using infographics

Examples


Embodiment Construction

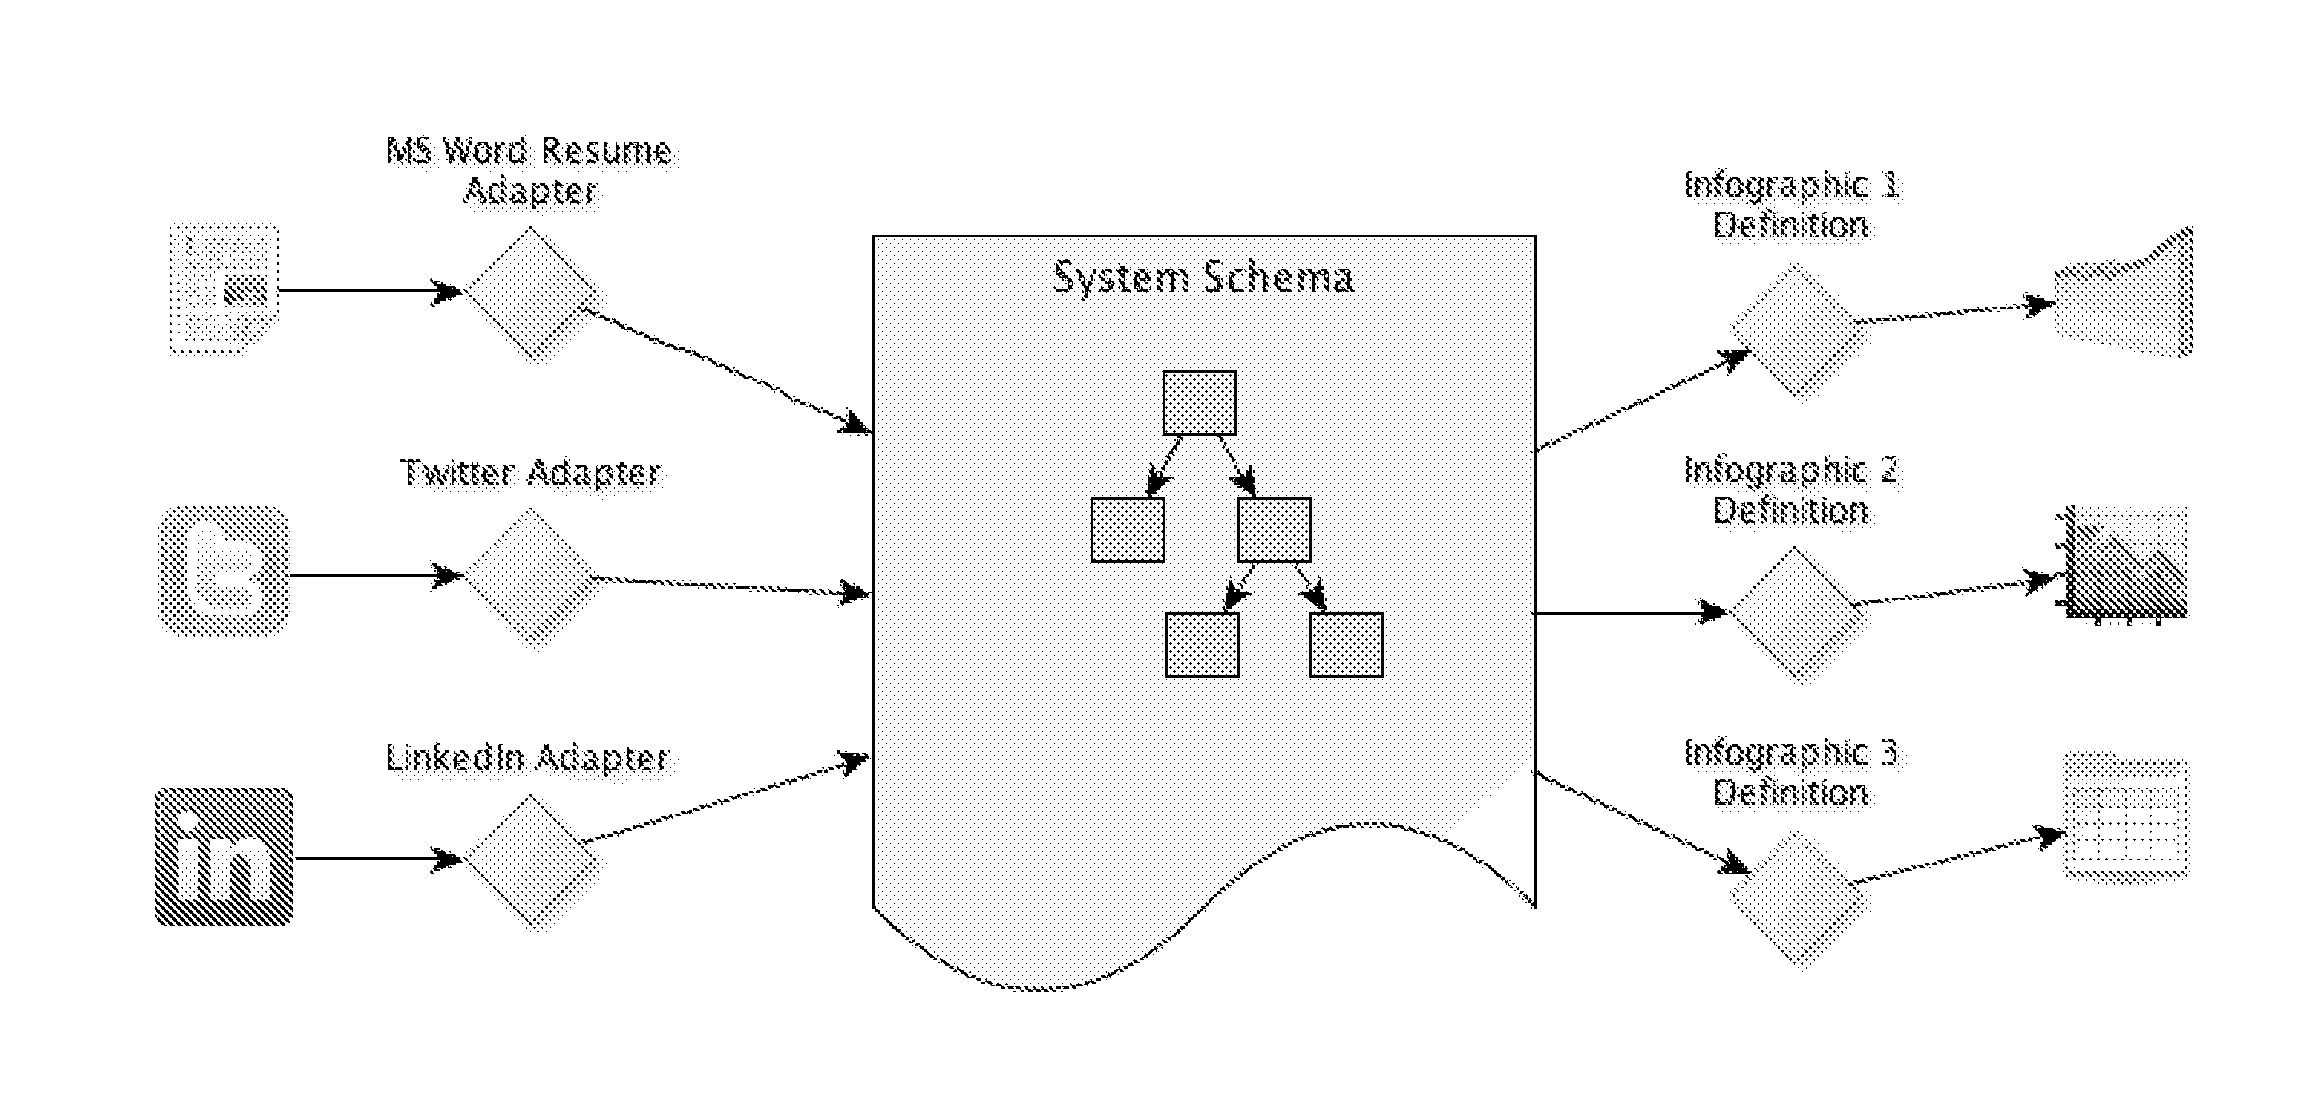
[0064]Embodiments of the disclosure provide web browser-based schemes for combining structured data, infographic definitions, and visual styling information to render infographics and aggregate collections of infographics. In certain embodiments of the disclosure, a relational database and / or a file system stores user data, infographic definitions, templates and palettes. These elements are then combined to produce either individual infographic representations or a collection of infographics or visualizations on a single canvas. Users may choose different infographic visualizations of the same underlying data and can change particular visual aspects, such as layout, font style and color palette, to instantly produce different visual presentations.

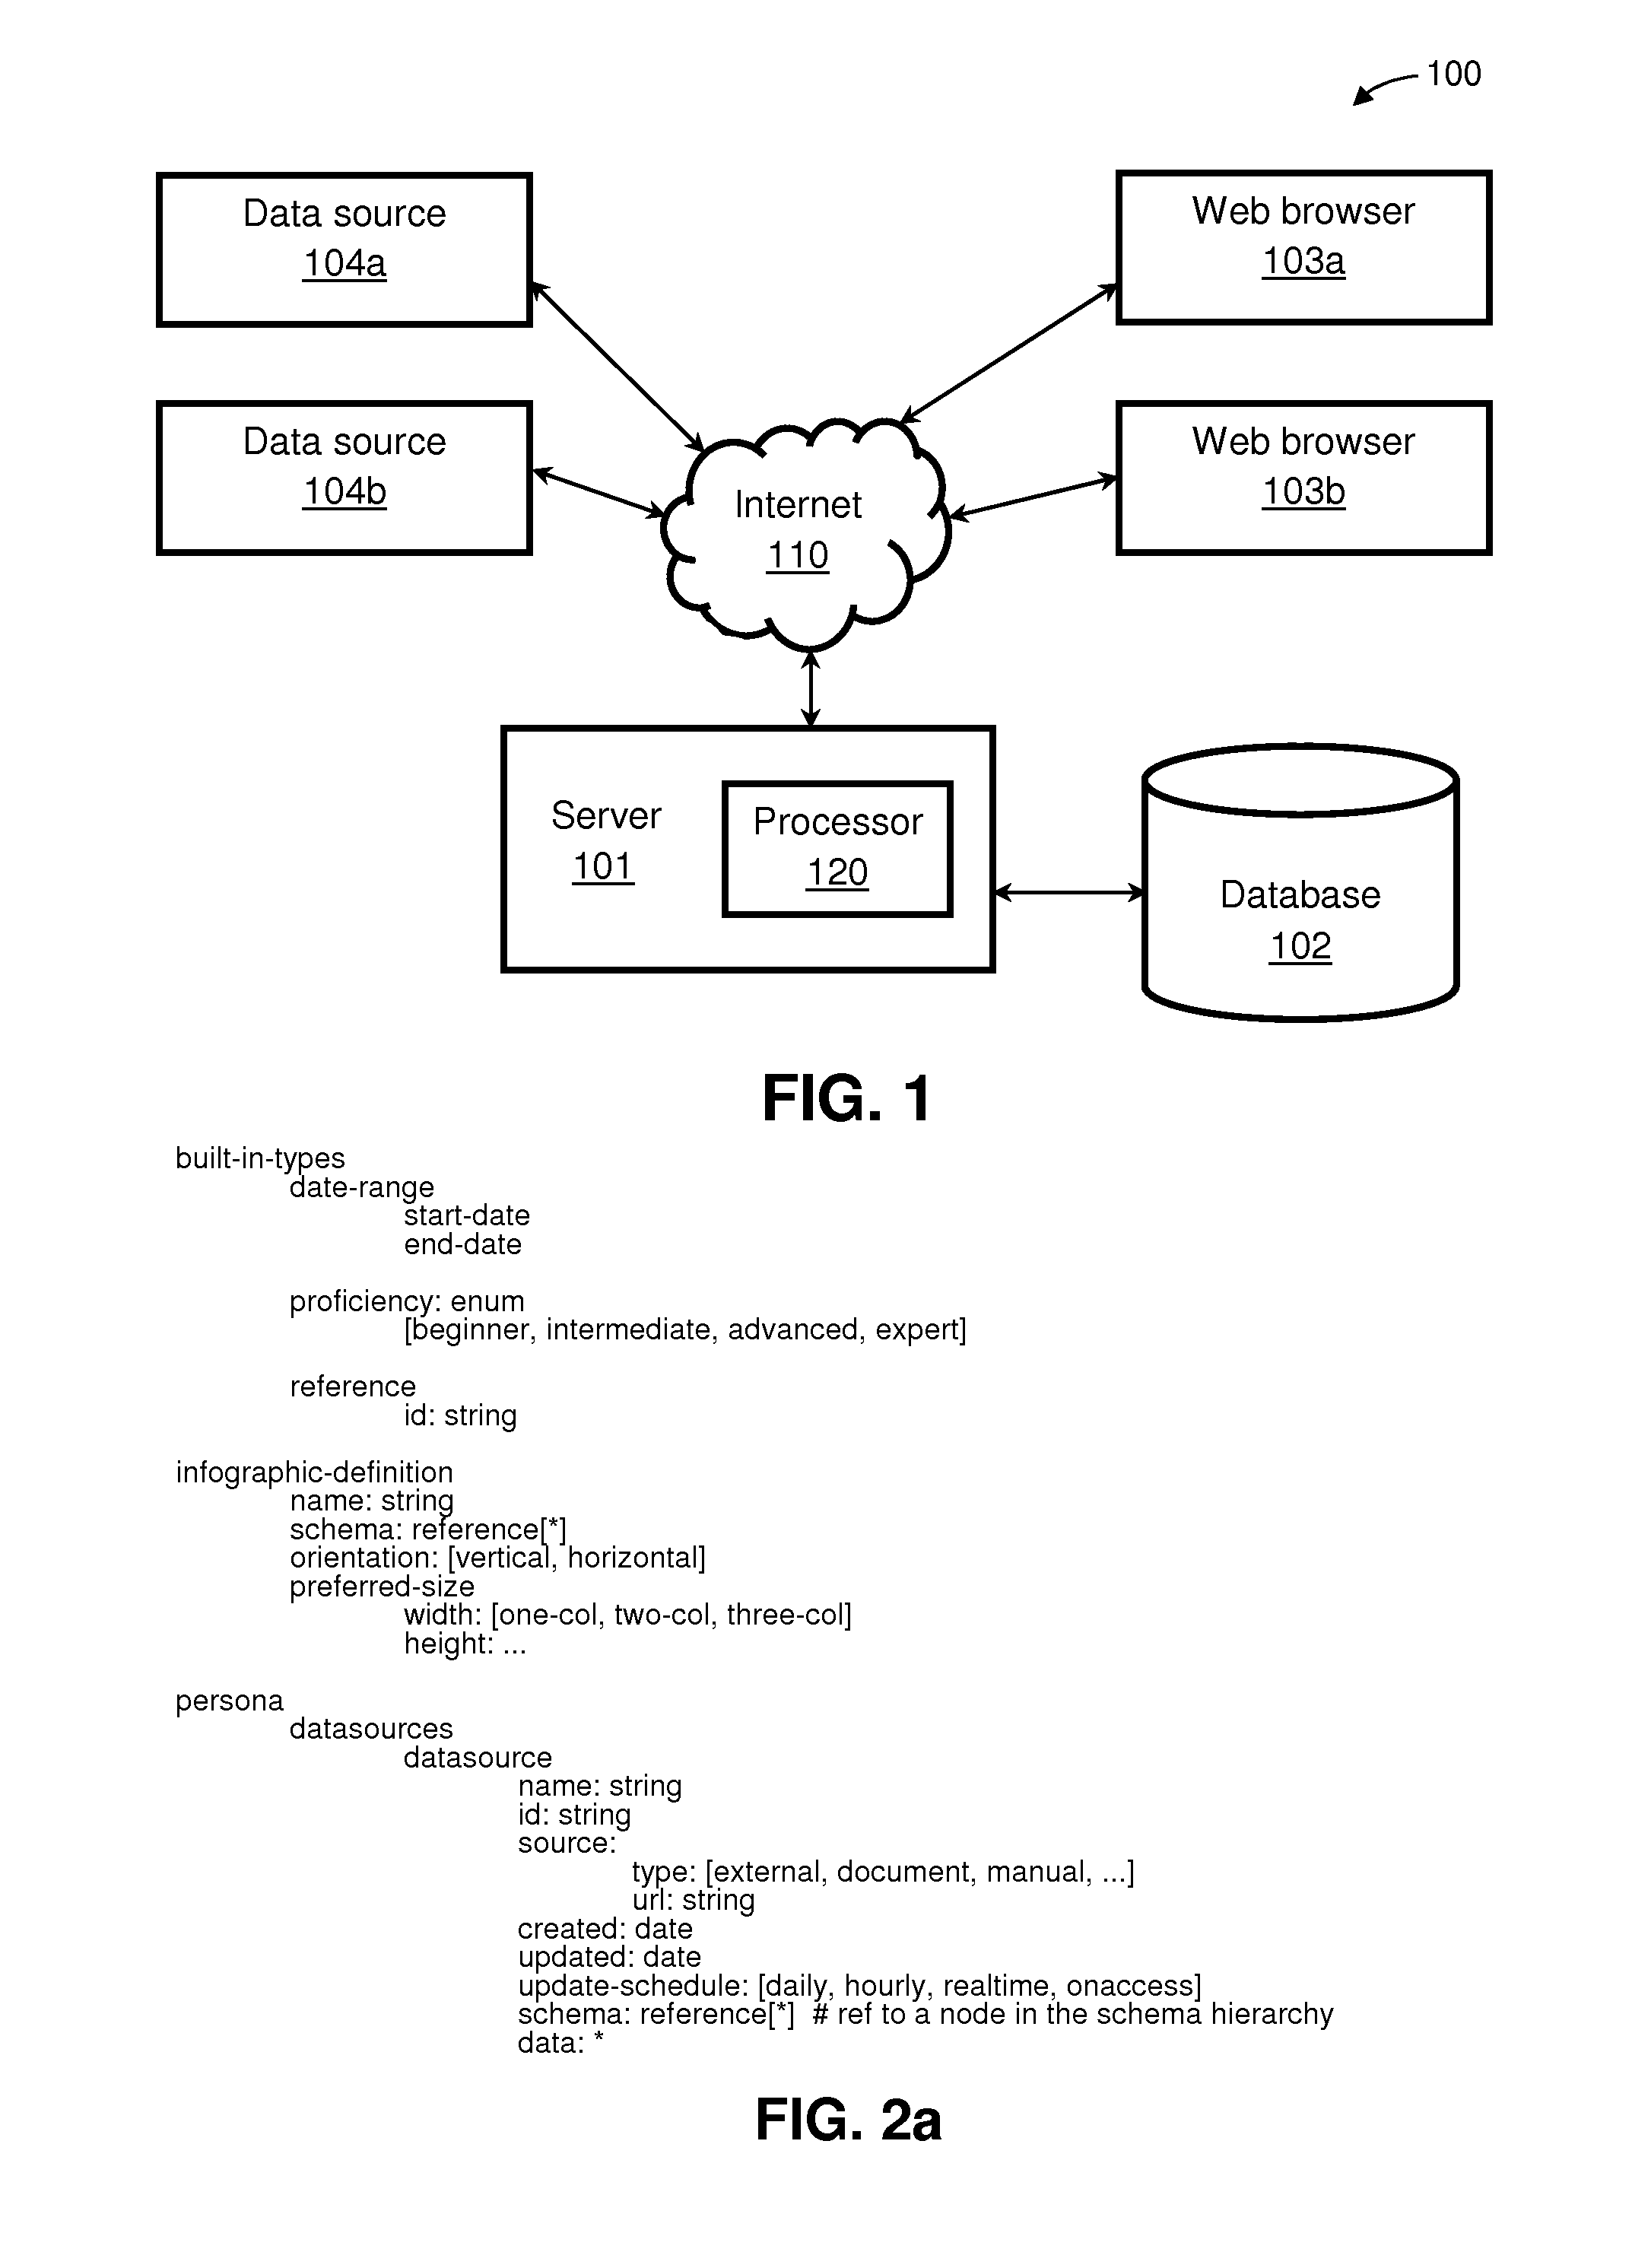
[0065]FIG. 1 shows an exemplary infographic system 100 consistent with one embodiment of the disclosure. As shown, system 100 includes an infographic server 101 coupled to a database 102 and having a processor 120 adapted to perform functio...


PUM


Abstract

In one embodiment, a web browser-based scheme for combining structured data, infographic definitions, and visual styling information to render infographics and aggregate collections of infographics, referred to herein as “Vizumes” and “Personas.” In exemplary embodiments of the disclosure, a relational database and / or a file system stores user data, infographic definitions, templates and palettes; combines these elements to produce individual infographic representations or a collection of infographic / visualizations (Vizumes) on a single canvas; allows users to choose different infographic visualizations of the same underlying data; and allows users to change the layout, font style, and color palette to instantly produce different visual presentations from the same data.

Description

CROSS-REFERENCE TO RELATED APPLICATION[0001]This application claims priority to co-pending U.S. Provisional Patent Application Ser. No. 61 / 505,635, filed Jul. 8, 2011, the disclosure of which is incorporated herein by reference in its entirety.BACKGROUND[0002]1. Technical Field[0003]The present disclosure relates, generally, to the display of data, and more particularly, to the graphical presentation and arrangement of data for visual presentation.[0004]2. Description of the Related Art[0005]Infographics (or data visualizations) are graphical representations of information, data, or knowledge, which representations include one or more text elements and / or graphic elements. The use of infographics has increased in recent decades in both consumer and corporate domains. However, most professionals (including, e.g., individuals, organizations, professional practitioners, service providers, and small-business owners) do not employ infographics to present their professional résumé or prof...

Claims


Application Information

Patent Timeline
Patent Type & Authority Applications(United States)
IPC IPC(8): G06F17/30G06F40/143
CPCG06Q10/105G06F16/248G06F16/80G06F16/116G06F16/285G06F16/972G06T11/206G06F40/143
Inventor SILVERSTEIN, TODDTUCKER, D. ELICUTLER-STAMM, JEFF
Owner YAHOO ASSETS LLC
Why Eureka
Try Eureka