Systems and methods for data mining and modeling

a data mining and modeling technology, applied in the field of systems and methods for data mining and modeling, can solve the problems of significant challenges, inability to perform significant amounts of financial data in a timely and meaningful manner, and inability to achieve comprehensible and timely manner

Inactive Publication Date: 2014-11-20
KENSHO TECH INC
View PDF2 Cites 127 Cited by
  • Summary
  • Abstract
  • Description
  • Claims
  • Application Information

AI Technical Summary

Benefits of technology

[0006]In accordance with further aspects of this exemplary embodiment, an interactive user interface displaying a range of distributions for financial instrument performance may also display one or more benchmarks relative to the distribution (e.g., S&P 500). A benchmark may be plotted in a distribution and may contain a distinctive indicator (e.g., a color, a shading, a pattern, a symbol, etc.) so that it may be easily observed in a distribution of a large number of financial instruments. Clicking on a benchmark may provide further information and / or may allow a user to drill down into a benchmark. For example, clicking on a benchmark may allow a user to view sectors and / or individual components or financial instruments of a benchmark.
[0010]In accordance with other aspects of the disclosure, techniques for producing a study of financial instruments are disclosed. Techniques may include the provision of templates facilitating the querying of large amounts of financial data to produce a visualization of a distribution of financial instrument performance. According to some embodiments, a plurality of templates may be provided accepting user parameters to create studies and visualizations of financial data in near real time and / or real time.
[0014]In accordance with further aspects of this embodiment, an analysis environment may allow the generation of queries using associations between near real time event data and historical impacts on financial data. Queries may be back tested against decades of multi-asset market data.
[0016]In accordance with further aspects of this embodiment, identification of impacts may allow a user to create and test optimal investment strategies without depending on software engineers or quants.
[0024]In accordance with further aspects of this exemplary embodiment, the techniques may include increasing an amount of historical market data by identifying additional historical market data based on a correlation of the additional historical market data.

Problems solved by technology

Modeling financial data to understand a distribution of financial instrument performance has traditionally presented a challenge (e.g., understanding returns, a probability of returns, and pricing anomalies which arise for a plurality of reasons but are frequently undiscovered statistically).
Due to human and interface limitations displaying a significant amount of financial data in a timely and meaningful manner has not been performed.
Additionally, discovering, in a large volume of data, meaningful statistical anomalies which may impact returns and presents them in a comprehensible and timely manner is a significant challenge.

Method used


Image

  • Systems and methods for data mining and modeling
  • Systems and methods for data mining and modeling
  • Systems and methods for data mining and modeling

Examples


Embodiment Construction

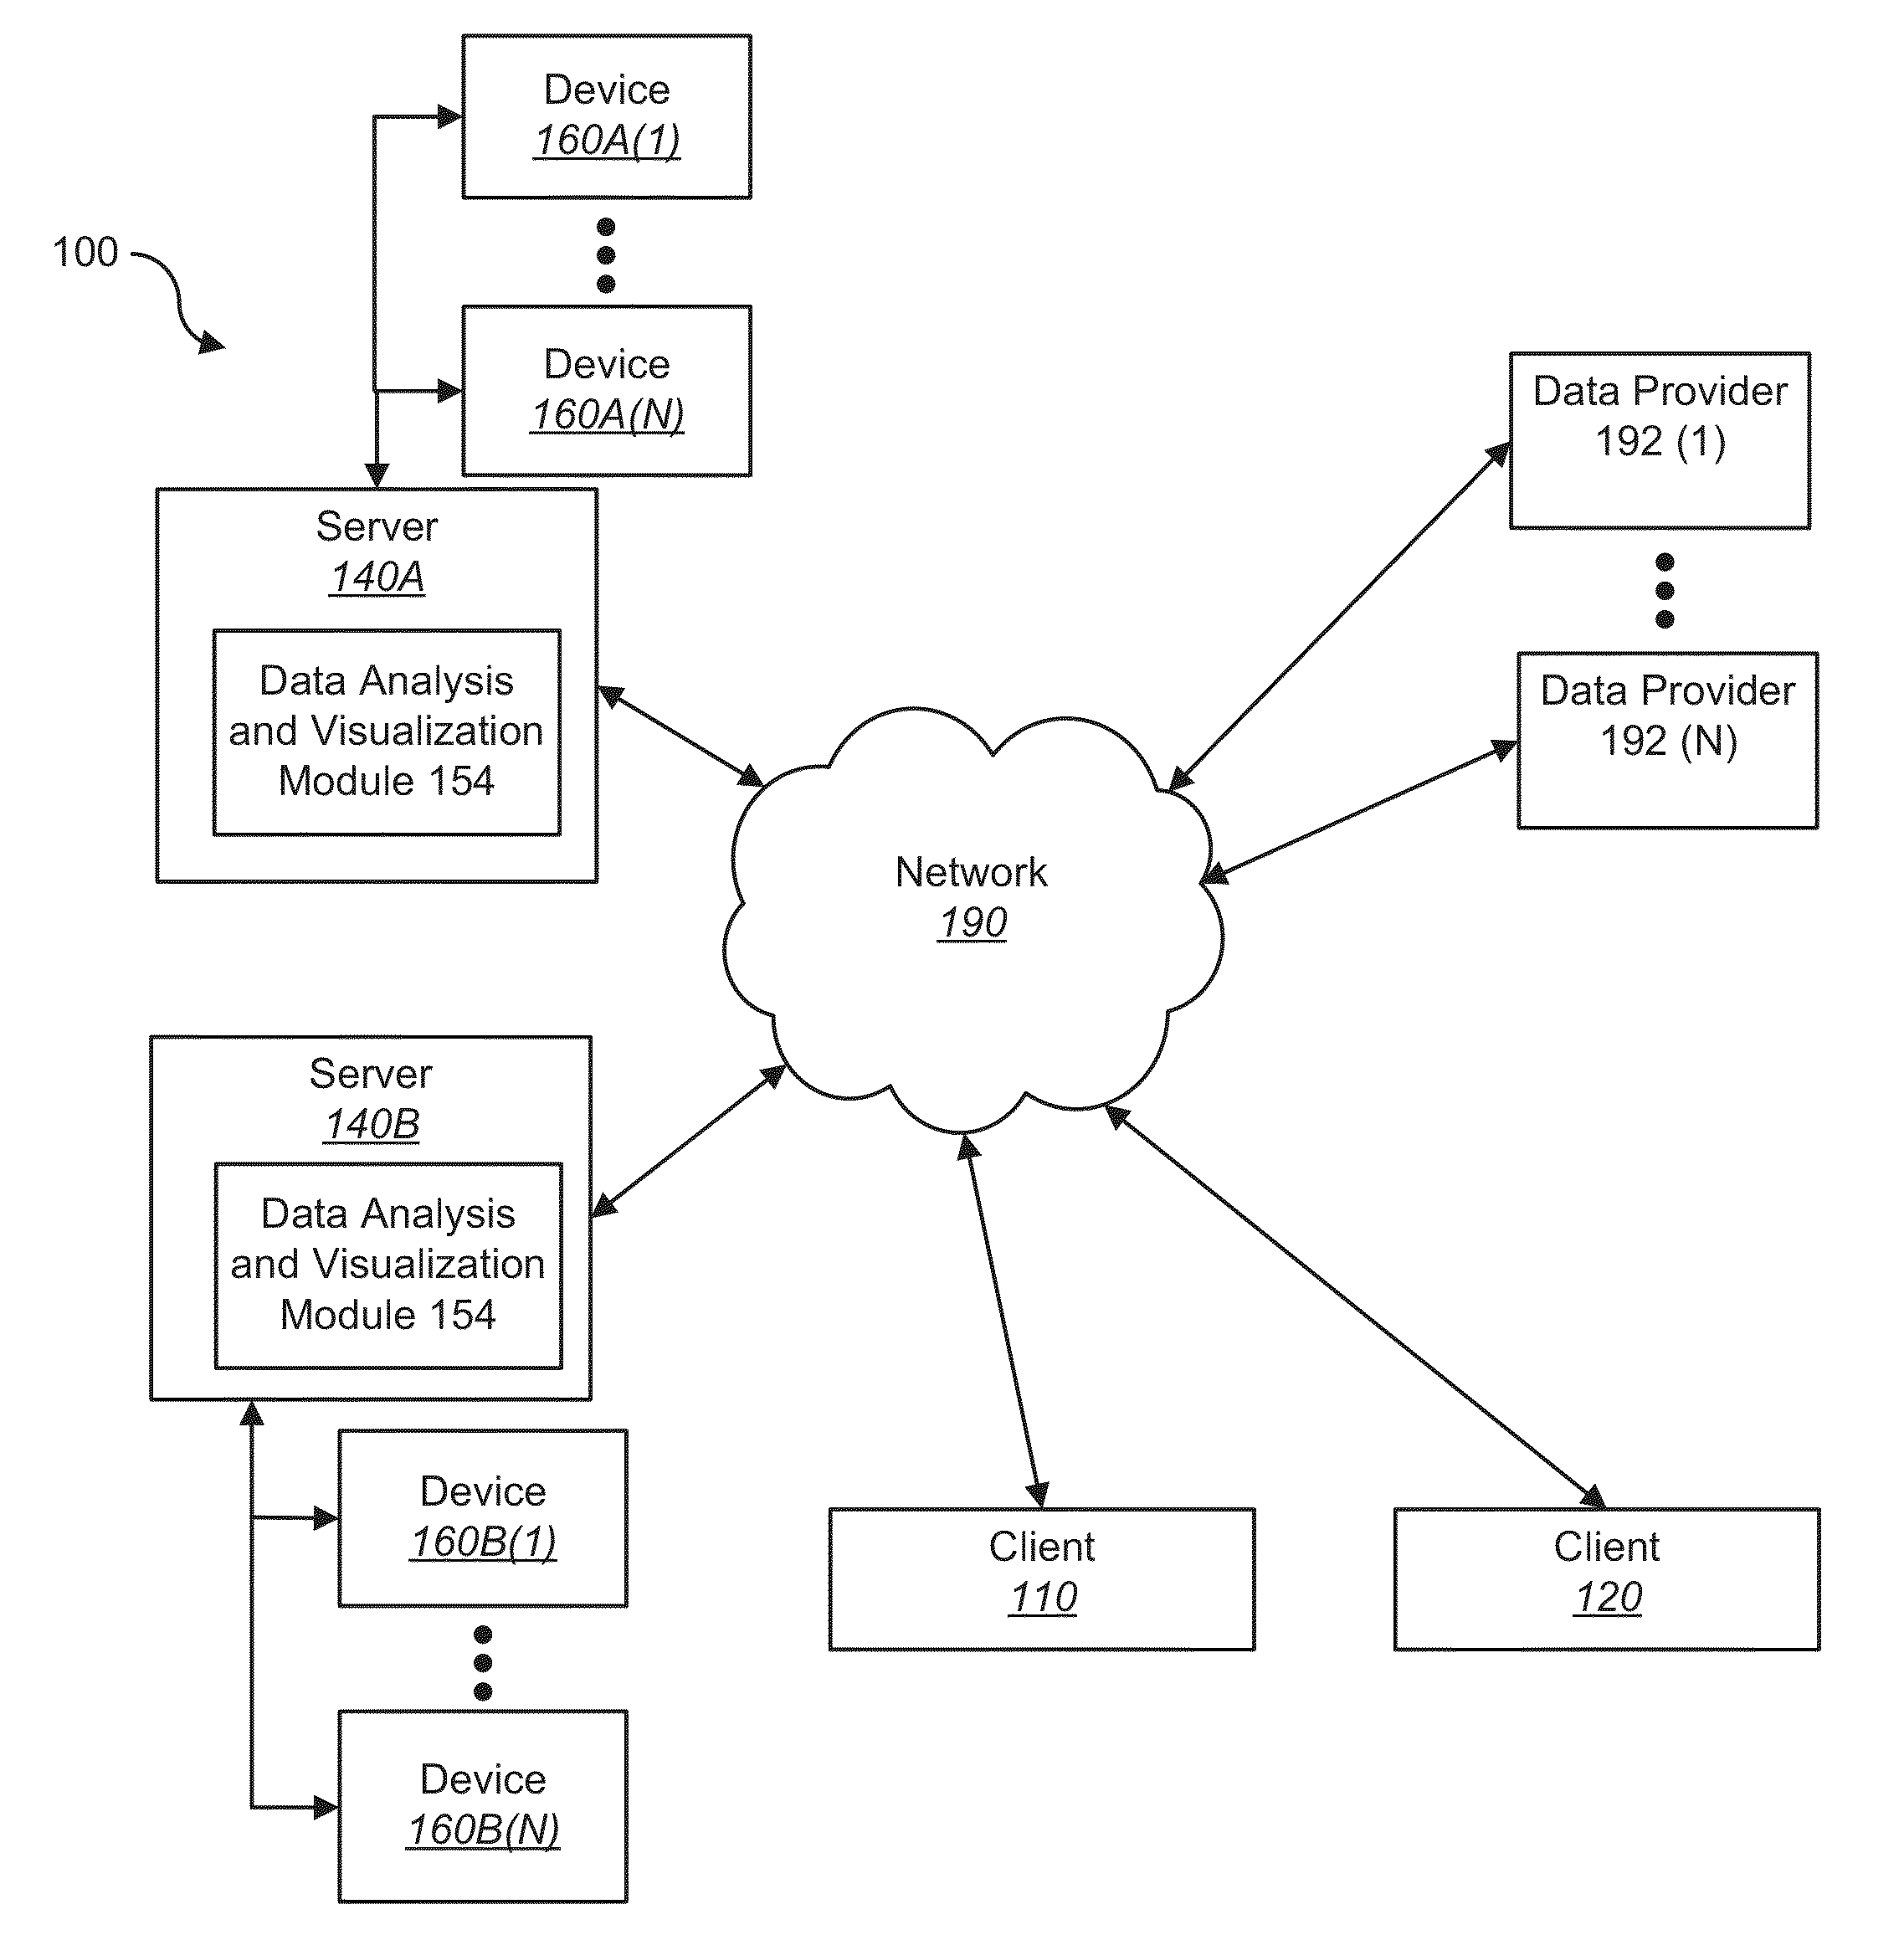
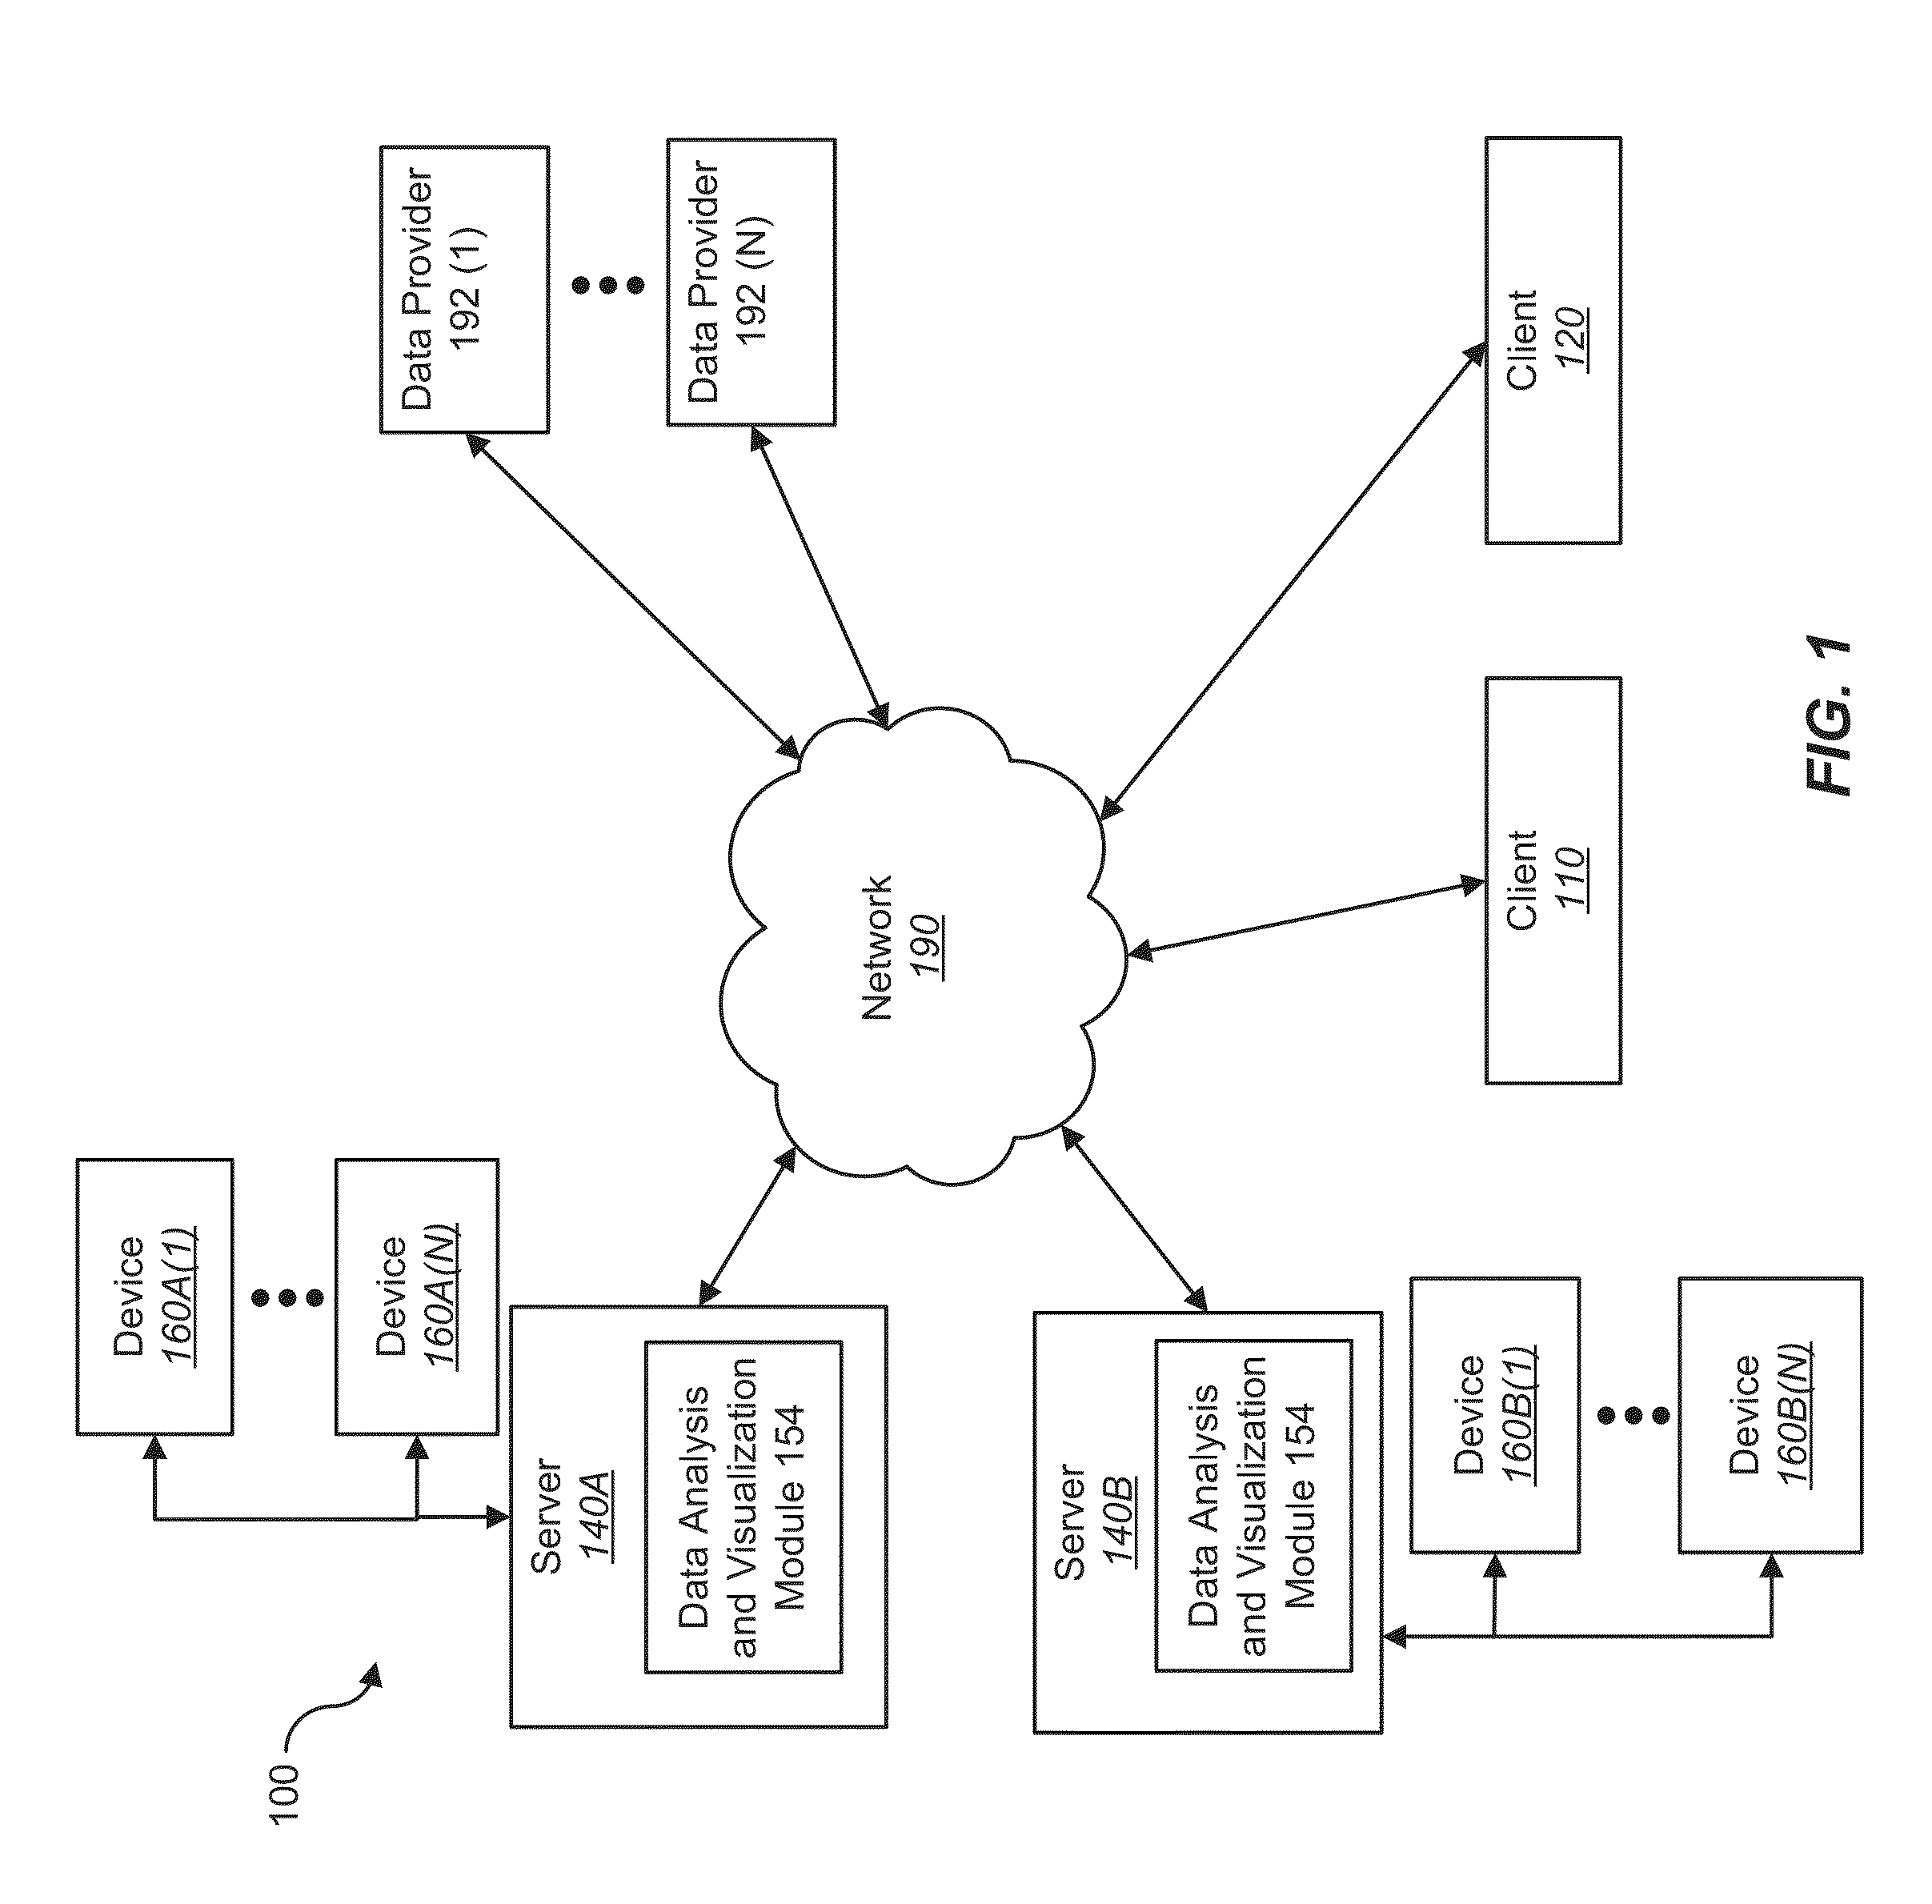
[0128]The present disclosure relates to systems for and methods of financial instrument attribute prediction and financial instrument visualization. According to some embodiments, a real-time performance evaluation and monitoring system may include providing a probability of a financial instruments price change based at least in part on historical and current market data. In one or more embodiments, financial instrument visualization may provide charts and analysis depicting variance in financial instrument returns versus an annualized return. Accurate estimations of the near-future performance of a financial instrument may help the owner or a financial instrument trader evaluate the risks and benefits of holding the financial instrument. The near-future performance of a financial instrument may be determined by way of mathematical models and a high-speed computational process, system, and method that may utilize extremely large historical market data-sets in real-time.

[0129]Turning...


PUM


Abstract

Techniques for prediction of financial instrument returns, identifying statistical history, the discovery of pricing anomalies, and financial instrument visualization are disclosed. In one particular exemplary embodiment, the techniques may be realized as a method for identifying financial instrument returns and pricing anomalies including matching, using at least one computer processor one or more portions of current market data associated with a financial instrument with historical market data, averaging outcomes of matched historical market data, and providing a probabilistic outcome for financial instrument returns, pricing anomalies, or other metrics based on the matched historical market data and the current market data. Techniques for financial instrument analysis may also include processing event data, correlating the event data using a large volume of historical market data to identify a predicted impact on returns of a financial instrument and / or pricing anomalies, and presenting the predicted impact to a user (e.g., in near real time).

Description

CROSS-REFERENCE TO RELATED APPLICATIONS[0001]This patent application claims priority to U.S. Provisional Patent Application No. 61 / 823,793, filed May 15, 2013, which is hereby incorporated by reference herein in its entirety.[0002]This patent application claims priority to U.S. Provisional Patent Application No. 61 / 899,649, filed Nov. 4, 2013, which is hereby incorporated by reference herein in its entirety.BACKGROUND[0003]The ability to monitor, track and predict financial instrument characteristics, including returns, is useful to make informed decisions about such financial instruments, especially in the service of managing risk, constructing diversified and balanced portfolios, and identifying excess returns. Identifying, analyzing, and conveying financial information in a meaningful and timely manner is a challenge due to the volume of the data to be analyzed and comprehended. Comparing financial data with non-financial statistics (e.g., events such as for example, weather) is ...

Claims


Application Information

Patent Timeline
Patent Type & Authority Applications(United States)
IPC IPC(8): G06Q40/06
CPCG06Q40/06G06Q10/067
Inventor NADLER, DANIEL
Owner KENSHO TECH INC
Why Eureka
Try Eureka