Methods Of Determining Allergen Response Using Microarray Immunoassay Techniques

a technology of immunoassay and microarray, which is applied in the field of determining the response of allergens using microarray immunoassay techniques, can solve the problems of cardiac collapse, failure to thrive, and severe impact on the quality of life of adults

Inactive Publication Date: 2015-06-18
MT SINAI SCHOOL OF MEDICINE
View PDF0 Cites 2 Cited by
  • Summary
  • Abstract
  • Description
  • Claims
  • Application Information

AI Technical Summary

Problems solved by technology

In anaphylaxis, immediate, severe and systemic hypersensitivity can bring about asphyxiation, produce cardiovascular collapse, and even result in death.
In young children, allergies to certain food products, e g., milk products, results in a failure to thrive.
Allergies to various food products also severely impact the quality of life in adults.
However, little is known about the extent of diversity of epitope recognition among individual patients, what might underlie the differences that exist, what consequence such diversity may have on immune function, and how these patterns change over time.
However, for the characterization of large numbers of individual patient allergen-specific IgE antibodies, this method has technical disadvantages.
Synthesis of large numbers of peptides is relatively time consuming, labor intensive, expensive and error-prone.
The SPOTS immunoassays require milliliter quantities of patient serum and although individual membranes can be stripped, they can only be reused for a limited number of patients.
For these reasons, identification of epitopes is often performed with pooled sera and evaluation of individual patients has generally been limited.
These technical considerations affect the experimental design since it is impractical to assay multiple controls in order to define positive cutoff values, or to perform replicates to determine assay variance.
Despite the wide-spread availability of various diagnostic tests, these tests are inadequate for evaluating the degree and severity of an allergic reaction.
As the serum samples are typically pooled, an individual response is difficult to assess.
Therefore, the tests available to date fail to predict the severity or degree of such a response and a need remains for new diagnostic tests for determining the severity of an immune response.

Method used


Image

  • Methods Of Determining Allergen Response Using Microarray Immunoassay Techniques
  • Methods Of Determining Allergen Response Using Microarray Immunoassay Techniques
  • Methods Of Determining Allergen Response Using Microarray Immunoassay Techniques

Examples


example 1

Materials and Methods

[0106]The present example provides exemplary methods and materials used in the preparation and testing of a microimmunoassay for determining the severity of an allergic response.

[0107]Collection and Processing of Patient Sera. Patient and control sera were selected retrospectively on the basis of detectable IgE to peanut as measured by Pharmacia Cap System FETA. Patients that exhibited some history of food allergenicity were recruited and detailed food reaction histories were prepared. Medical records were reviewed for history of reaction frequency and symptoms. Reaction severity was ranked on a scale of 0 to 6 as described previously (Sampson, Pediatrics, 111:1601-8, 2003). The age of peanut sensitized individuals at the time of recruitment ranged from 1.5 to 36 years (median 6.9 yrs, n=57). Peanut-specific IgE ranged from 1.97 to >100 kU / L (median >100). Of these patients, 38 had a history of positive DBPCFC or convincing history of clinical reaction. The rema...

example 2

Assay Validation

[0115]In order to assess assay characteristics, replicate experiments were performed using a pool of peanut-allergic patient sera to investigate inter- and intra-assay reproducibility. Each array also included whole recombinant Ara h1, Ara h2 and Ara h3. The same pooled sera were applied to four separate arrays. Intra-assay coefficient of correlation for any one of the four assays was >0.95 and the variance was homogenous. The inter-assay mean coefficient of variation for peptide binding was 3.4% with a range of 0.1% to 14%, which correlated with intensity of staining.

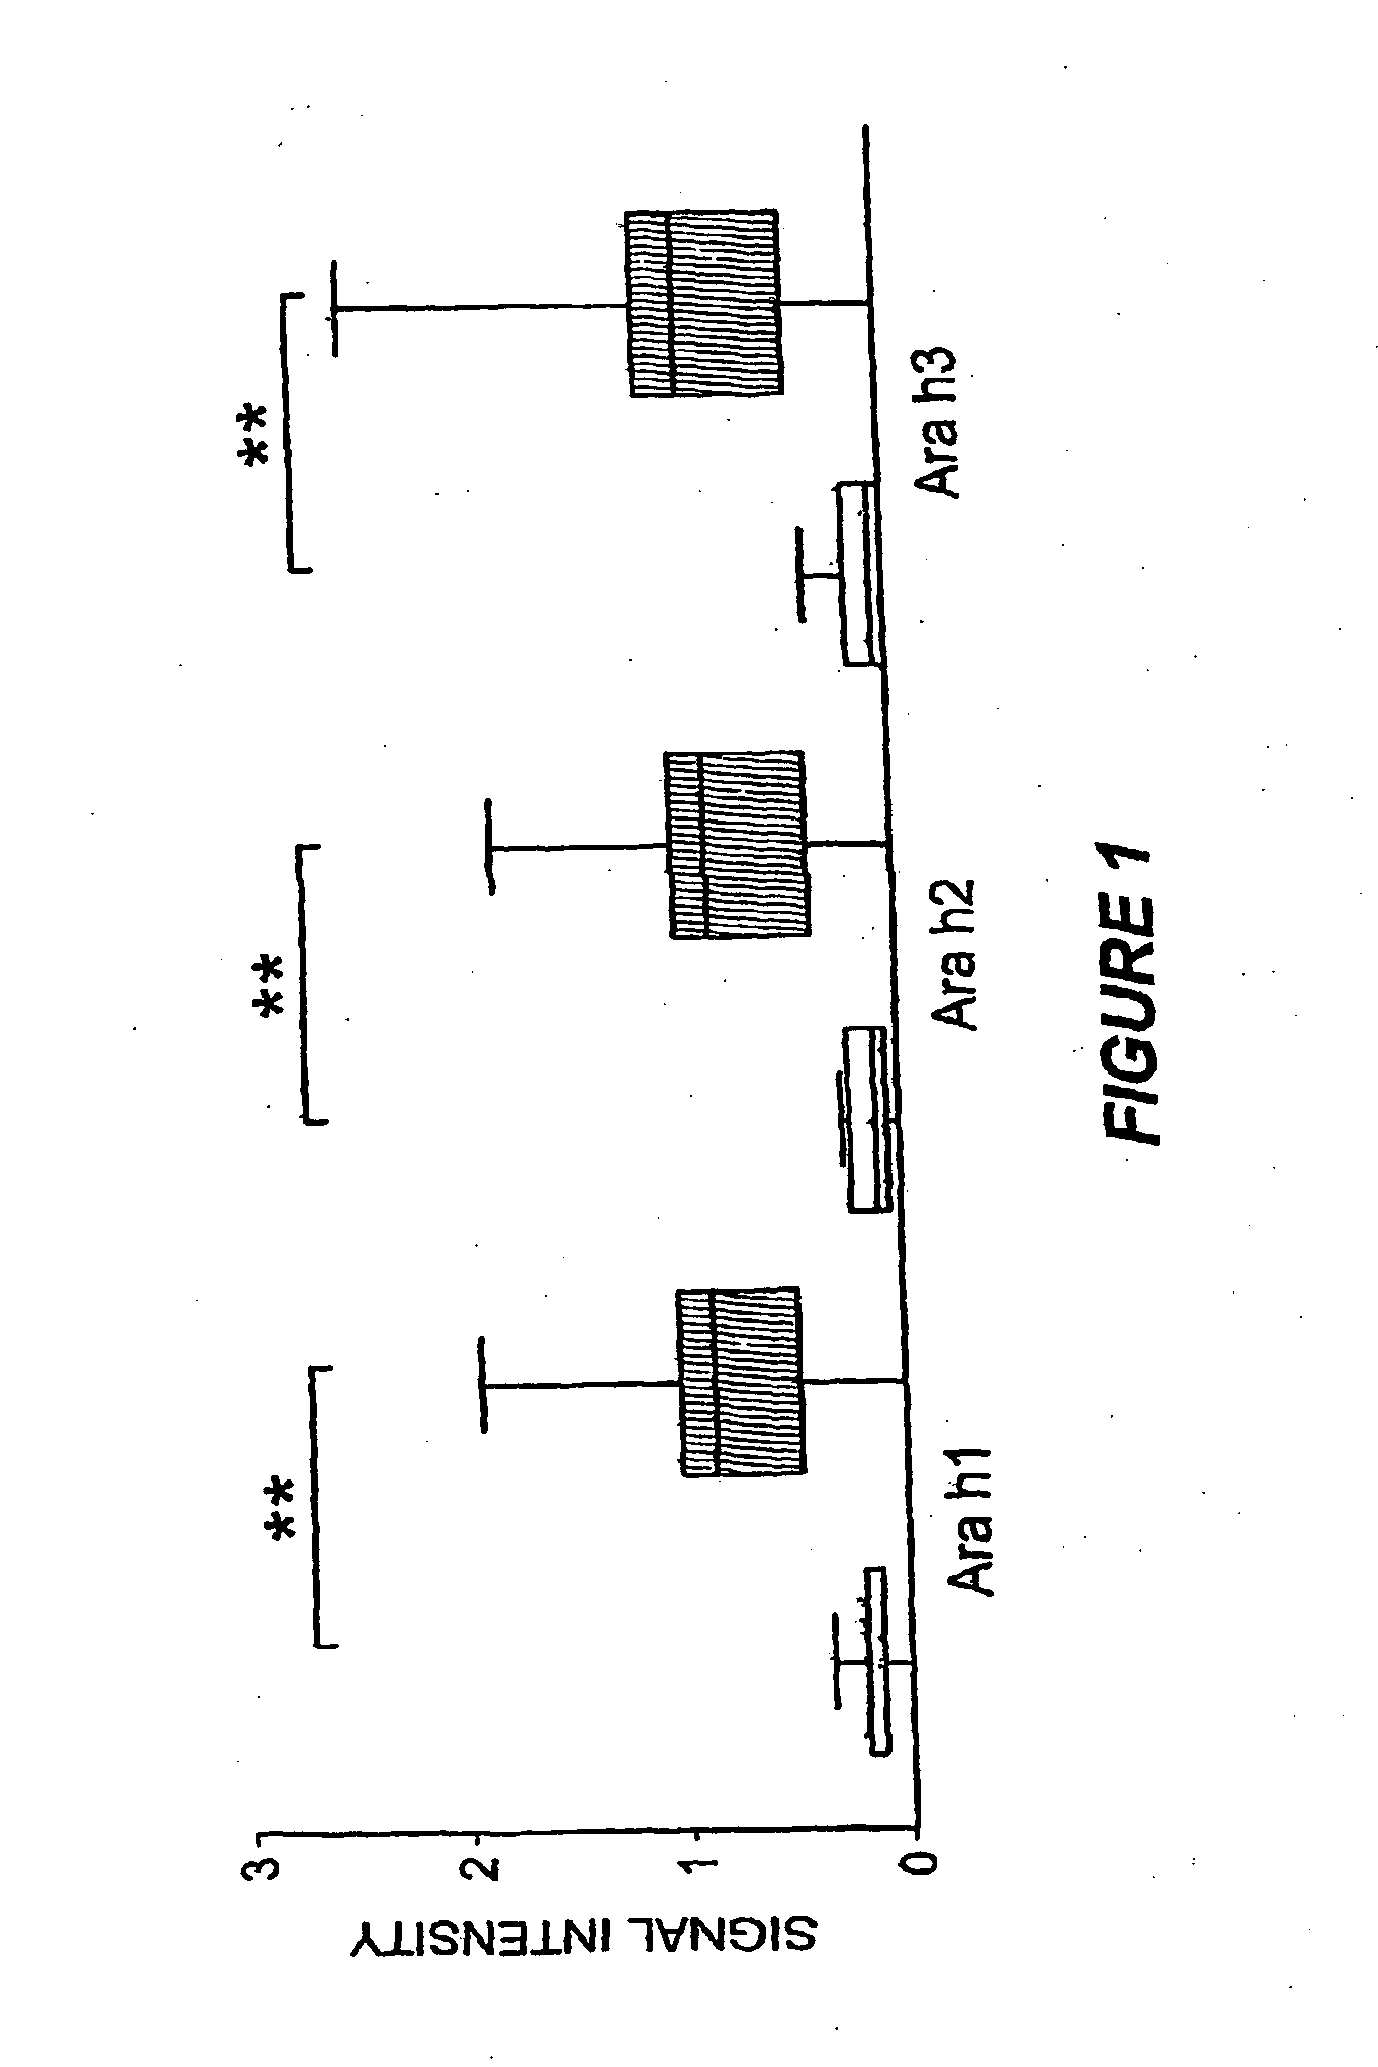
[0116]Ara h1, Ara h2 and Ara h3 have been previously described as major peanut allergens (Rabjohn et al., J. Clin. Invest., 103:535-4210, 1999; Burks et al., J. Allergy Clin. Immunol. 88(2):172-9, 1991; Burks et al., J. Allergy Clin. Immunol., 90:962-9, 1992). The MIA described herein allowed examination of the prevalence of IgE recognition of these allergens for a large number of patients (n=77). Consi...

example 3

Diagnostic Findings

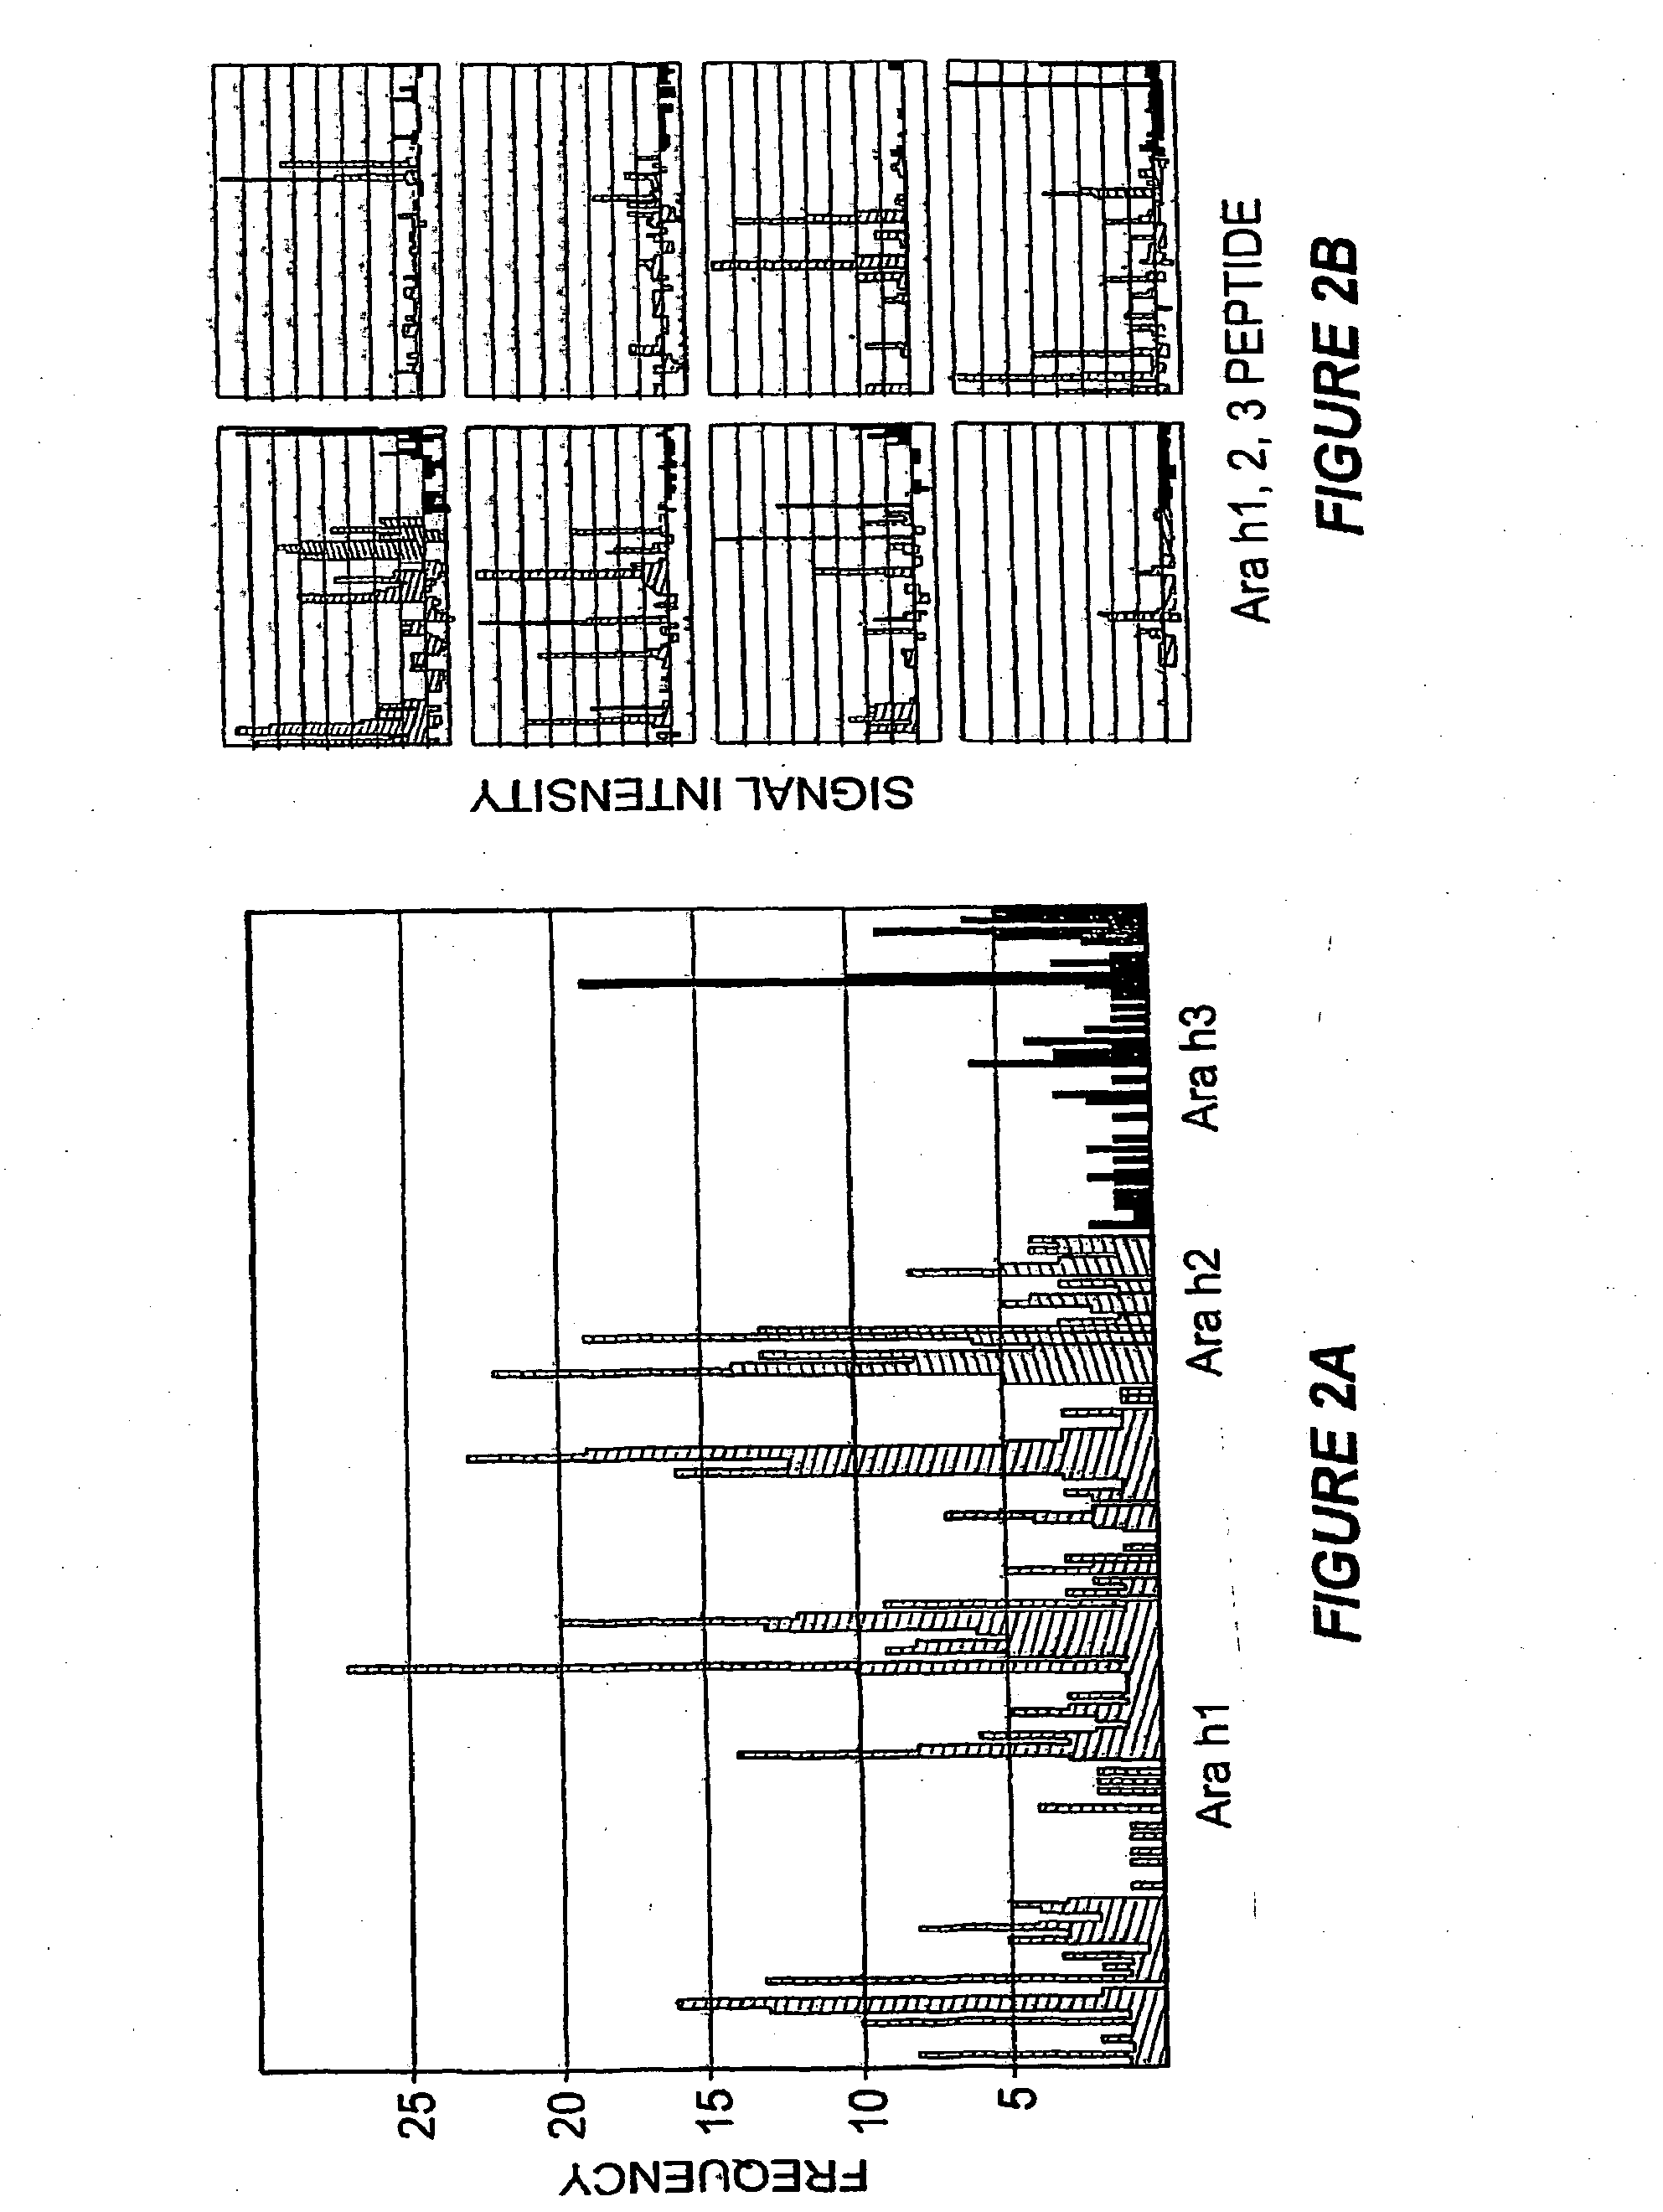
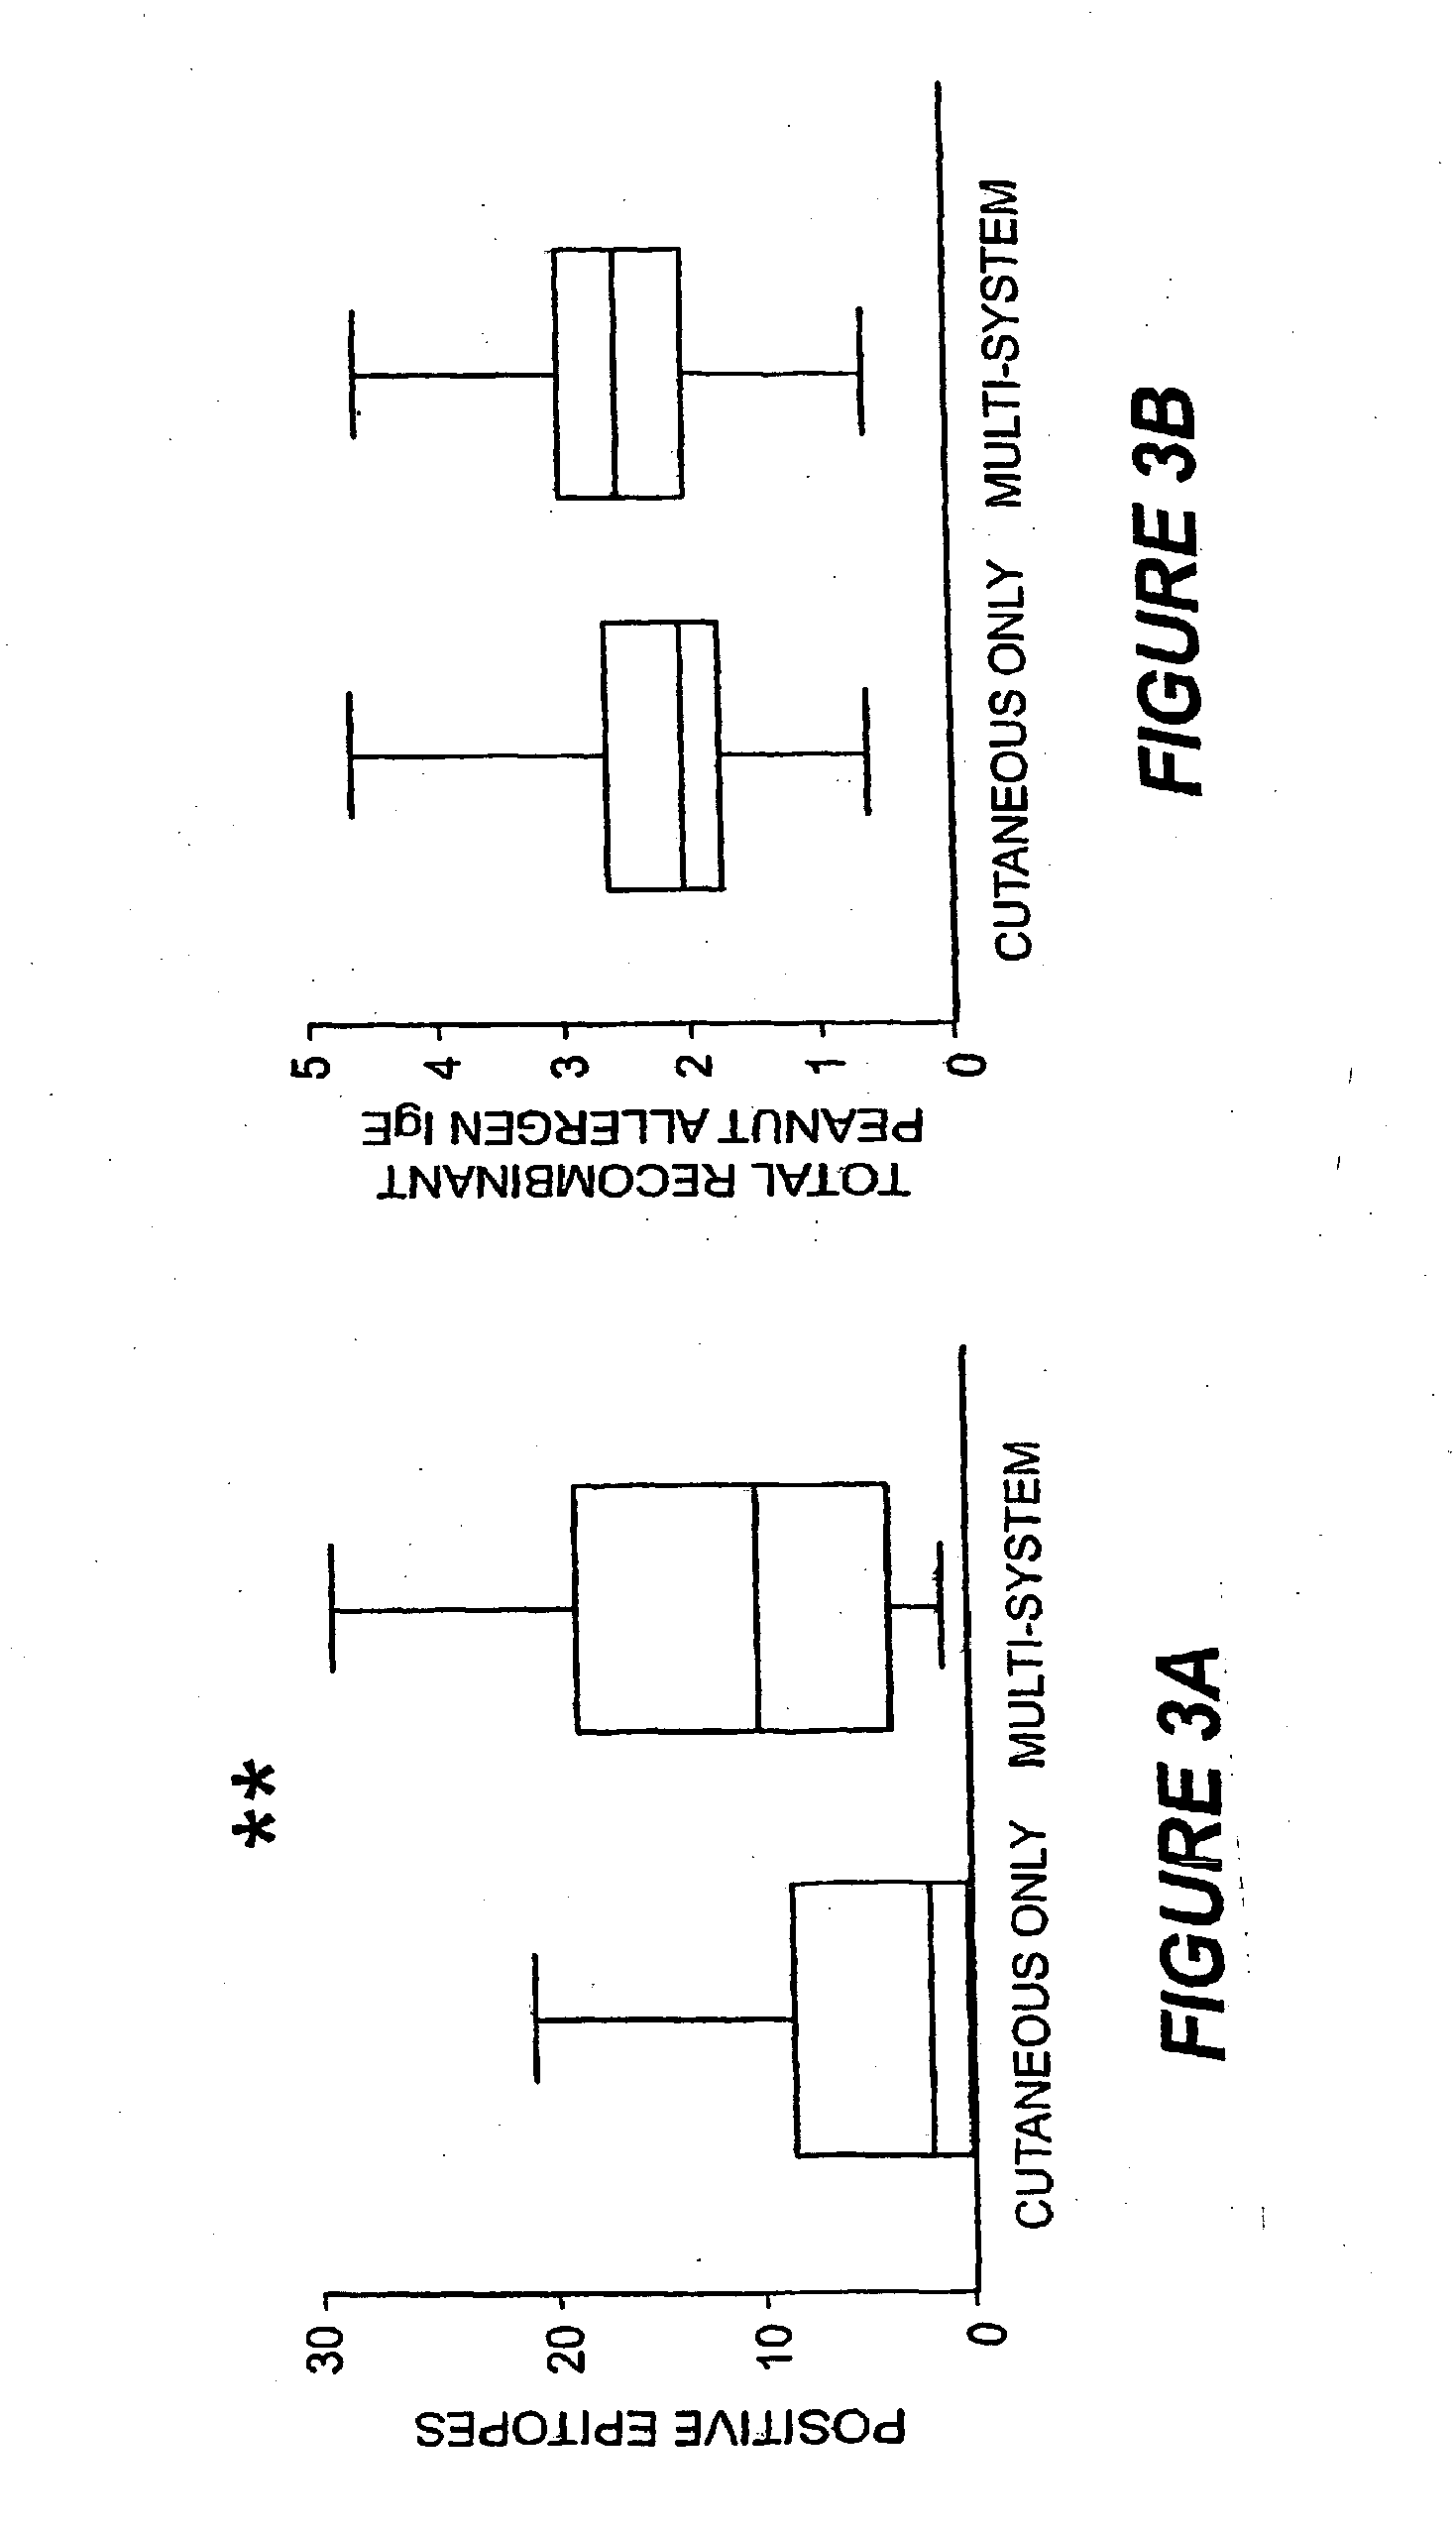
[0121]A striking feature of IgE binding revealed by MIA is the variability from patient-to-patient with respect to both the number of peptide epitopes recognized and the pattern of recognition. FIG. 2B shows eight representative graphs, plotting signal against peptide, that demonstrate this large degree of heterogeneity. These data demonstrate that the MIA methods used herein can be used to produce a map of an individual subject's heterogeneous patterns of IgE binding to various allergens. Such mapping will assist in therapeutic and prophylactic intervention of allergic responses of the subjects. In particular, the methods described herein demonstrate that greater IgE diversity with respect to epitope recognition corresponds to a history of greater reaction severity such that greater epitope diversity is a marker for more severe allergic reactions. Food antigen-specific IgE concentrations alone have been shown to have prognostic value for likelihood of reactivity ...


PUM

PropertyMeasurementUnit
temperaturesaaaaaaaaaa
wavelengthsaaaaaaaaaa

Abstract

The present invention is directed to materials and methods that may be used in diagnosing and / or characterizing allergies. More specifically, the specification describes methods and compositions for making and using a plurality of peptides having allergen epitopes that may be used in immunoassays e.g., microarray based immunoassays to predict the severity of an allergic response.

Description

BACKGROUND[0001]Some experimental data described herein was generated with the support of National Institutes of Health training grant T32 HD07537, and National Institutes of Health grant numbers AI43668, AI44236 and RR-00071.FIELD OF THE INVENTION[0002]The present invention is generally directed to methods and compositions for determining the severity of an allergic reaction.BACKGROUND OF THE INVENTION[0003]A large percentage of the population in North America and. Europe is affected by allergic reactions to a variety of environmental allergens, making a topic disorders one the most prevalent disorders in the industrialized world (Hanson and Telemo, Acta. Pediatr. 86:916-918, 1997).[0004]Allergic reactions are typically immune reactions initiated by IgE-dependent stimulation of tissue mast cells and related effector molecules (e.g., basophils). In such reactions, IgE molecules bind to basophils, mastcells and dendritic cells via a specific, high-affinity receptor, FcεRI (Kinet, Cur...

Claims


Application Information

Patent Timeline
Patent Type & Authority Applications(United States)
IPC IPC(8): G01N33/543G01N33/552G01N33/68
CPCG01N2800/24G01N33/54306G01N33/6854G01N33/6878G01N33/6893
Inventor SAMPSON, HUGH A.SHREFFLER, WAYNE G.BEYER, KRISTEN
Owner MT SINAI SCHOOL OF MEDICINE
Why Eureka
Try Eureka