Dynamic filling of shapes for graphical display of data
a data visualization and dynamic filling technology, applied in the field of data visualization, can solve the problems of not being able to easily modify, neither dynamic nor easily modified, and not being able to fill any complex shap
- Summary
- Abstract
- Description
- Claims
- Application Information
AI Technical Summary
Benefits of technology
Problems solved by technology
Method used
Image
Examples
Embodiment Construction
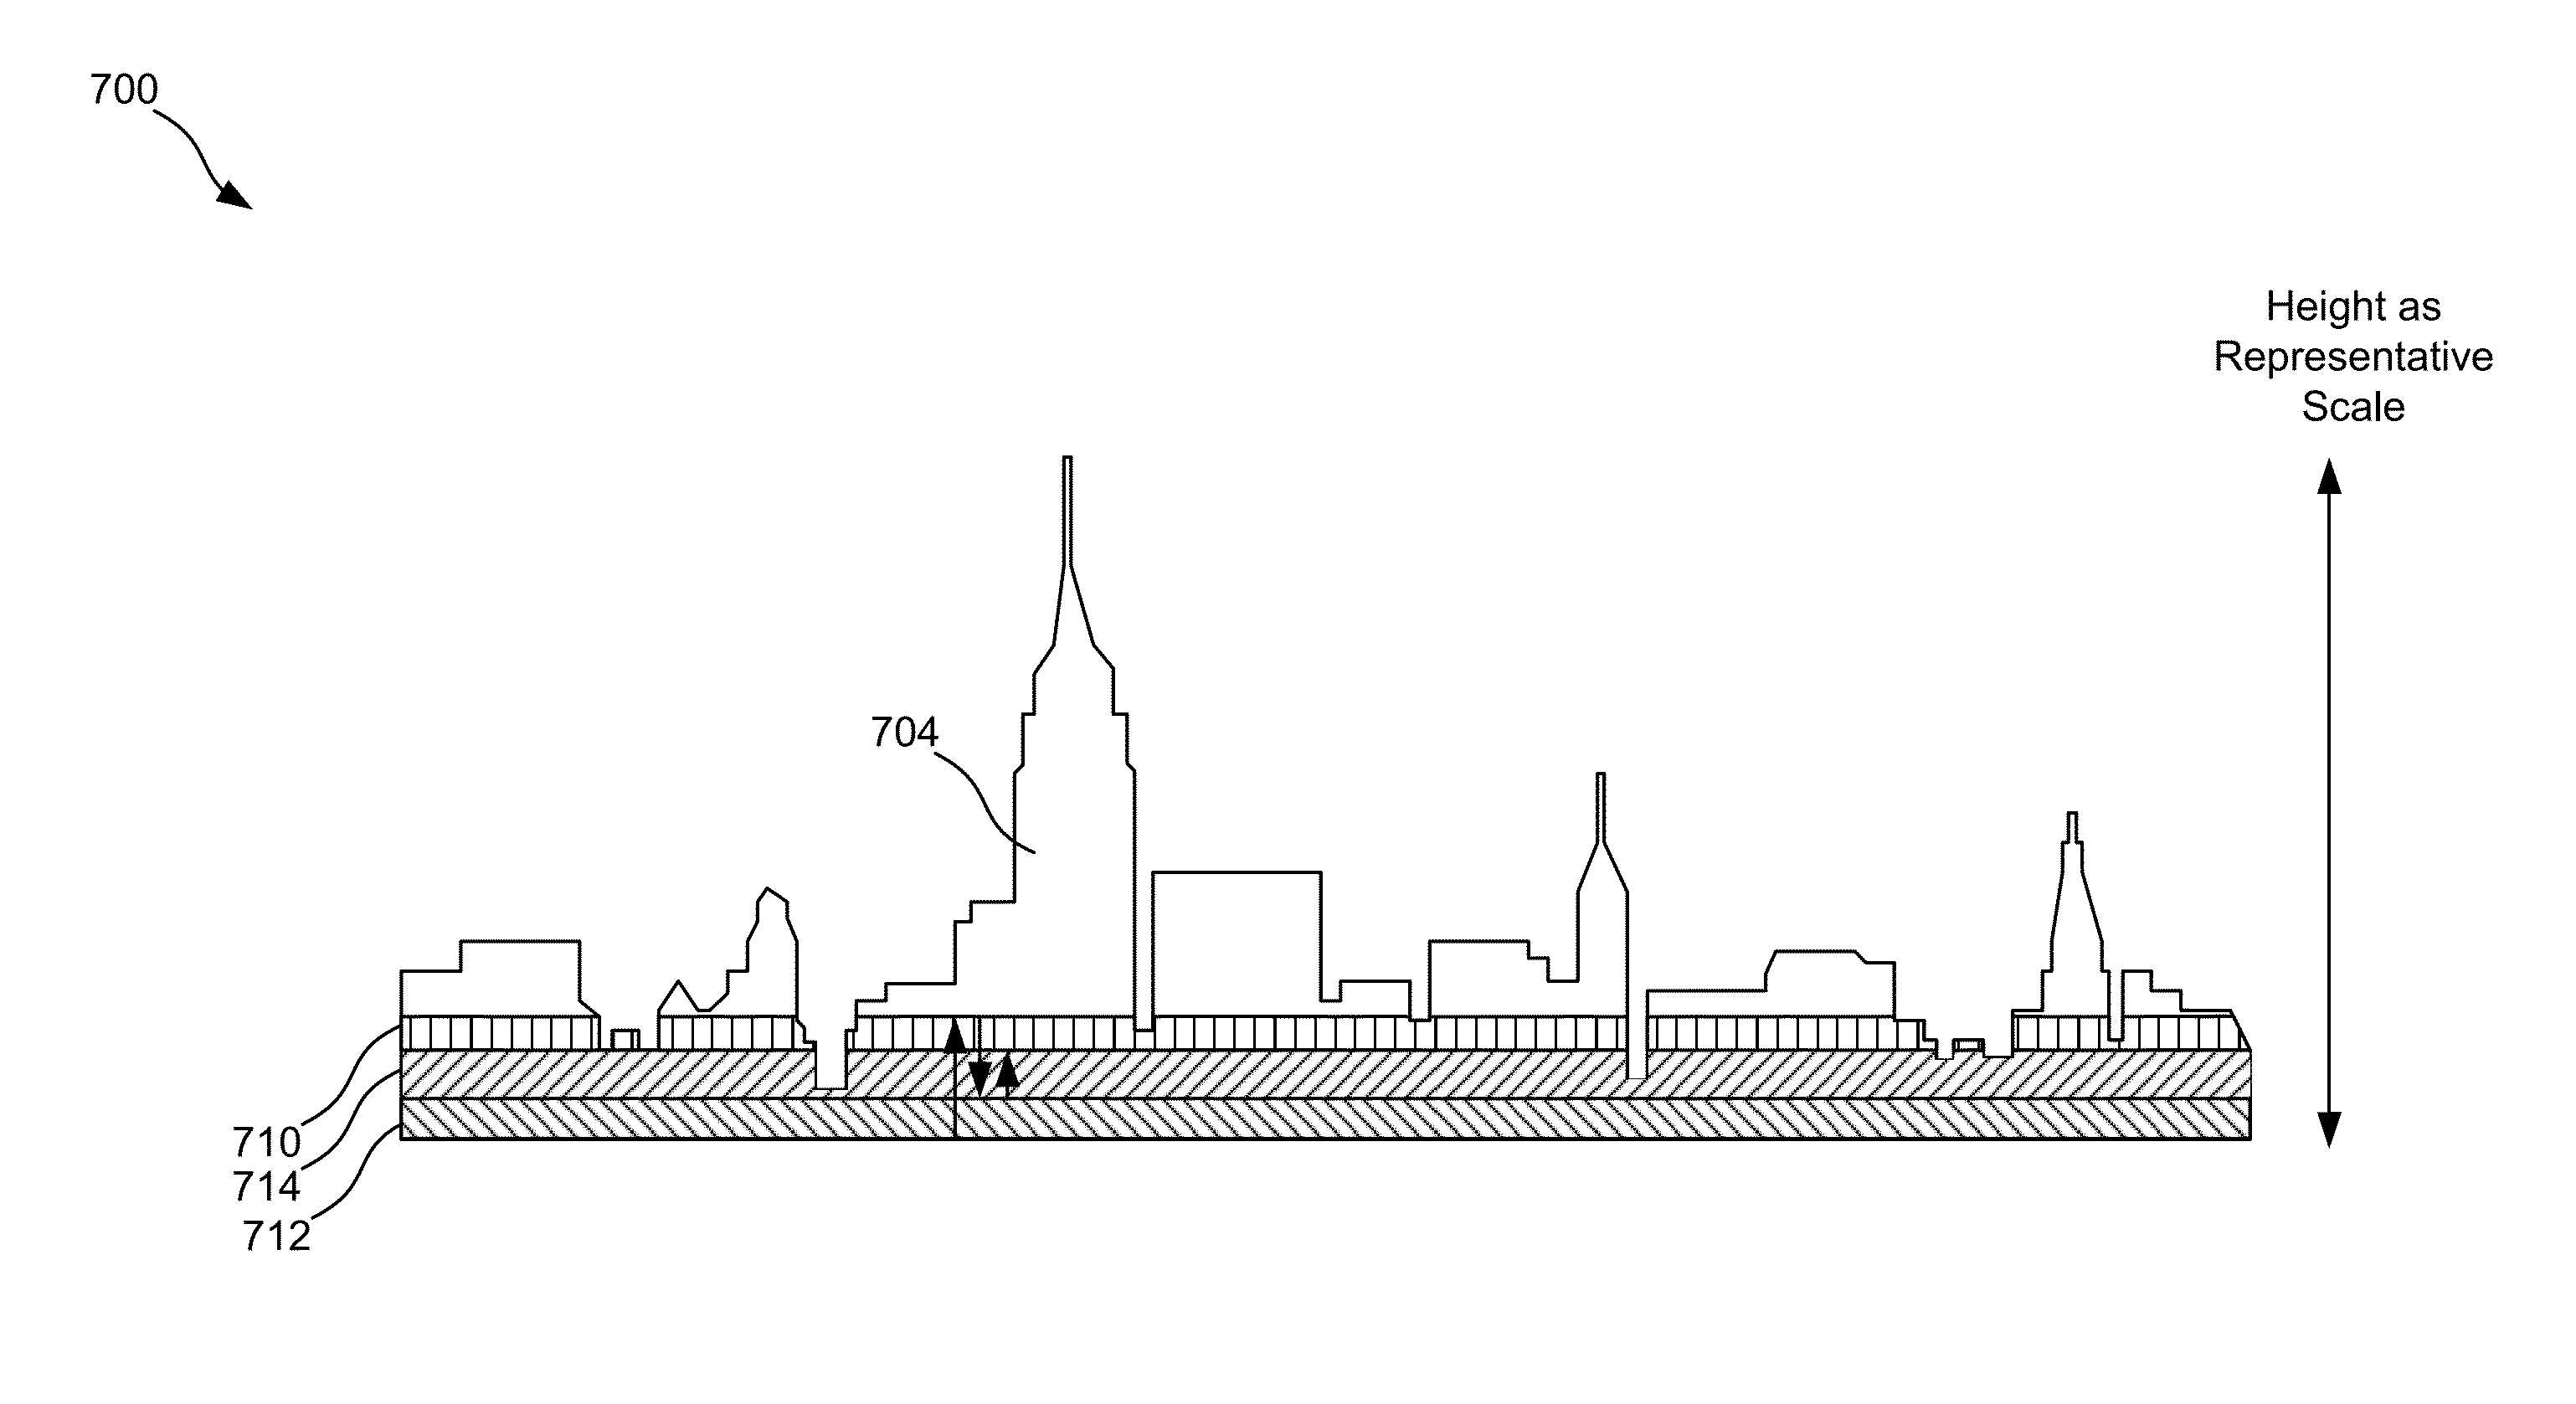
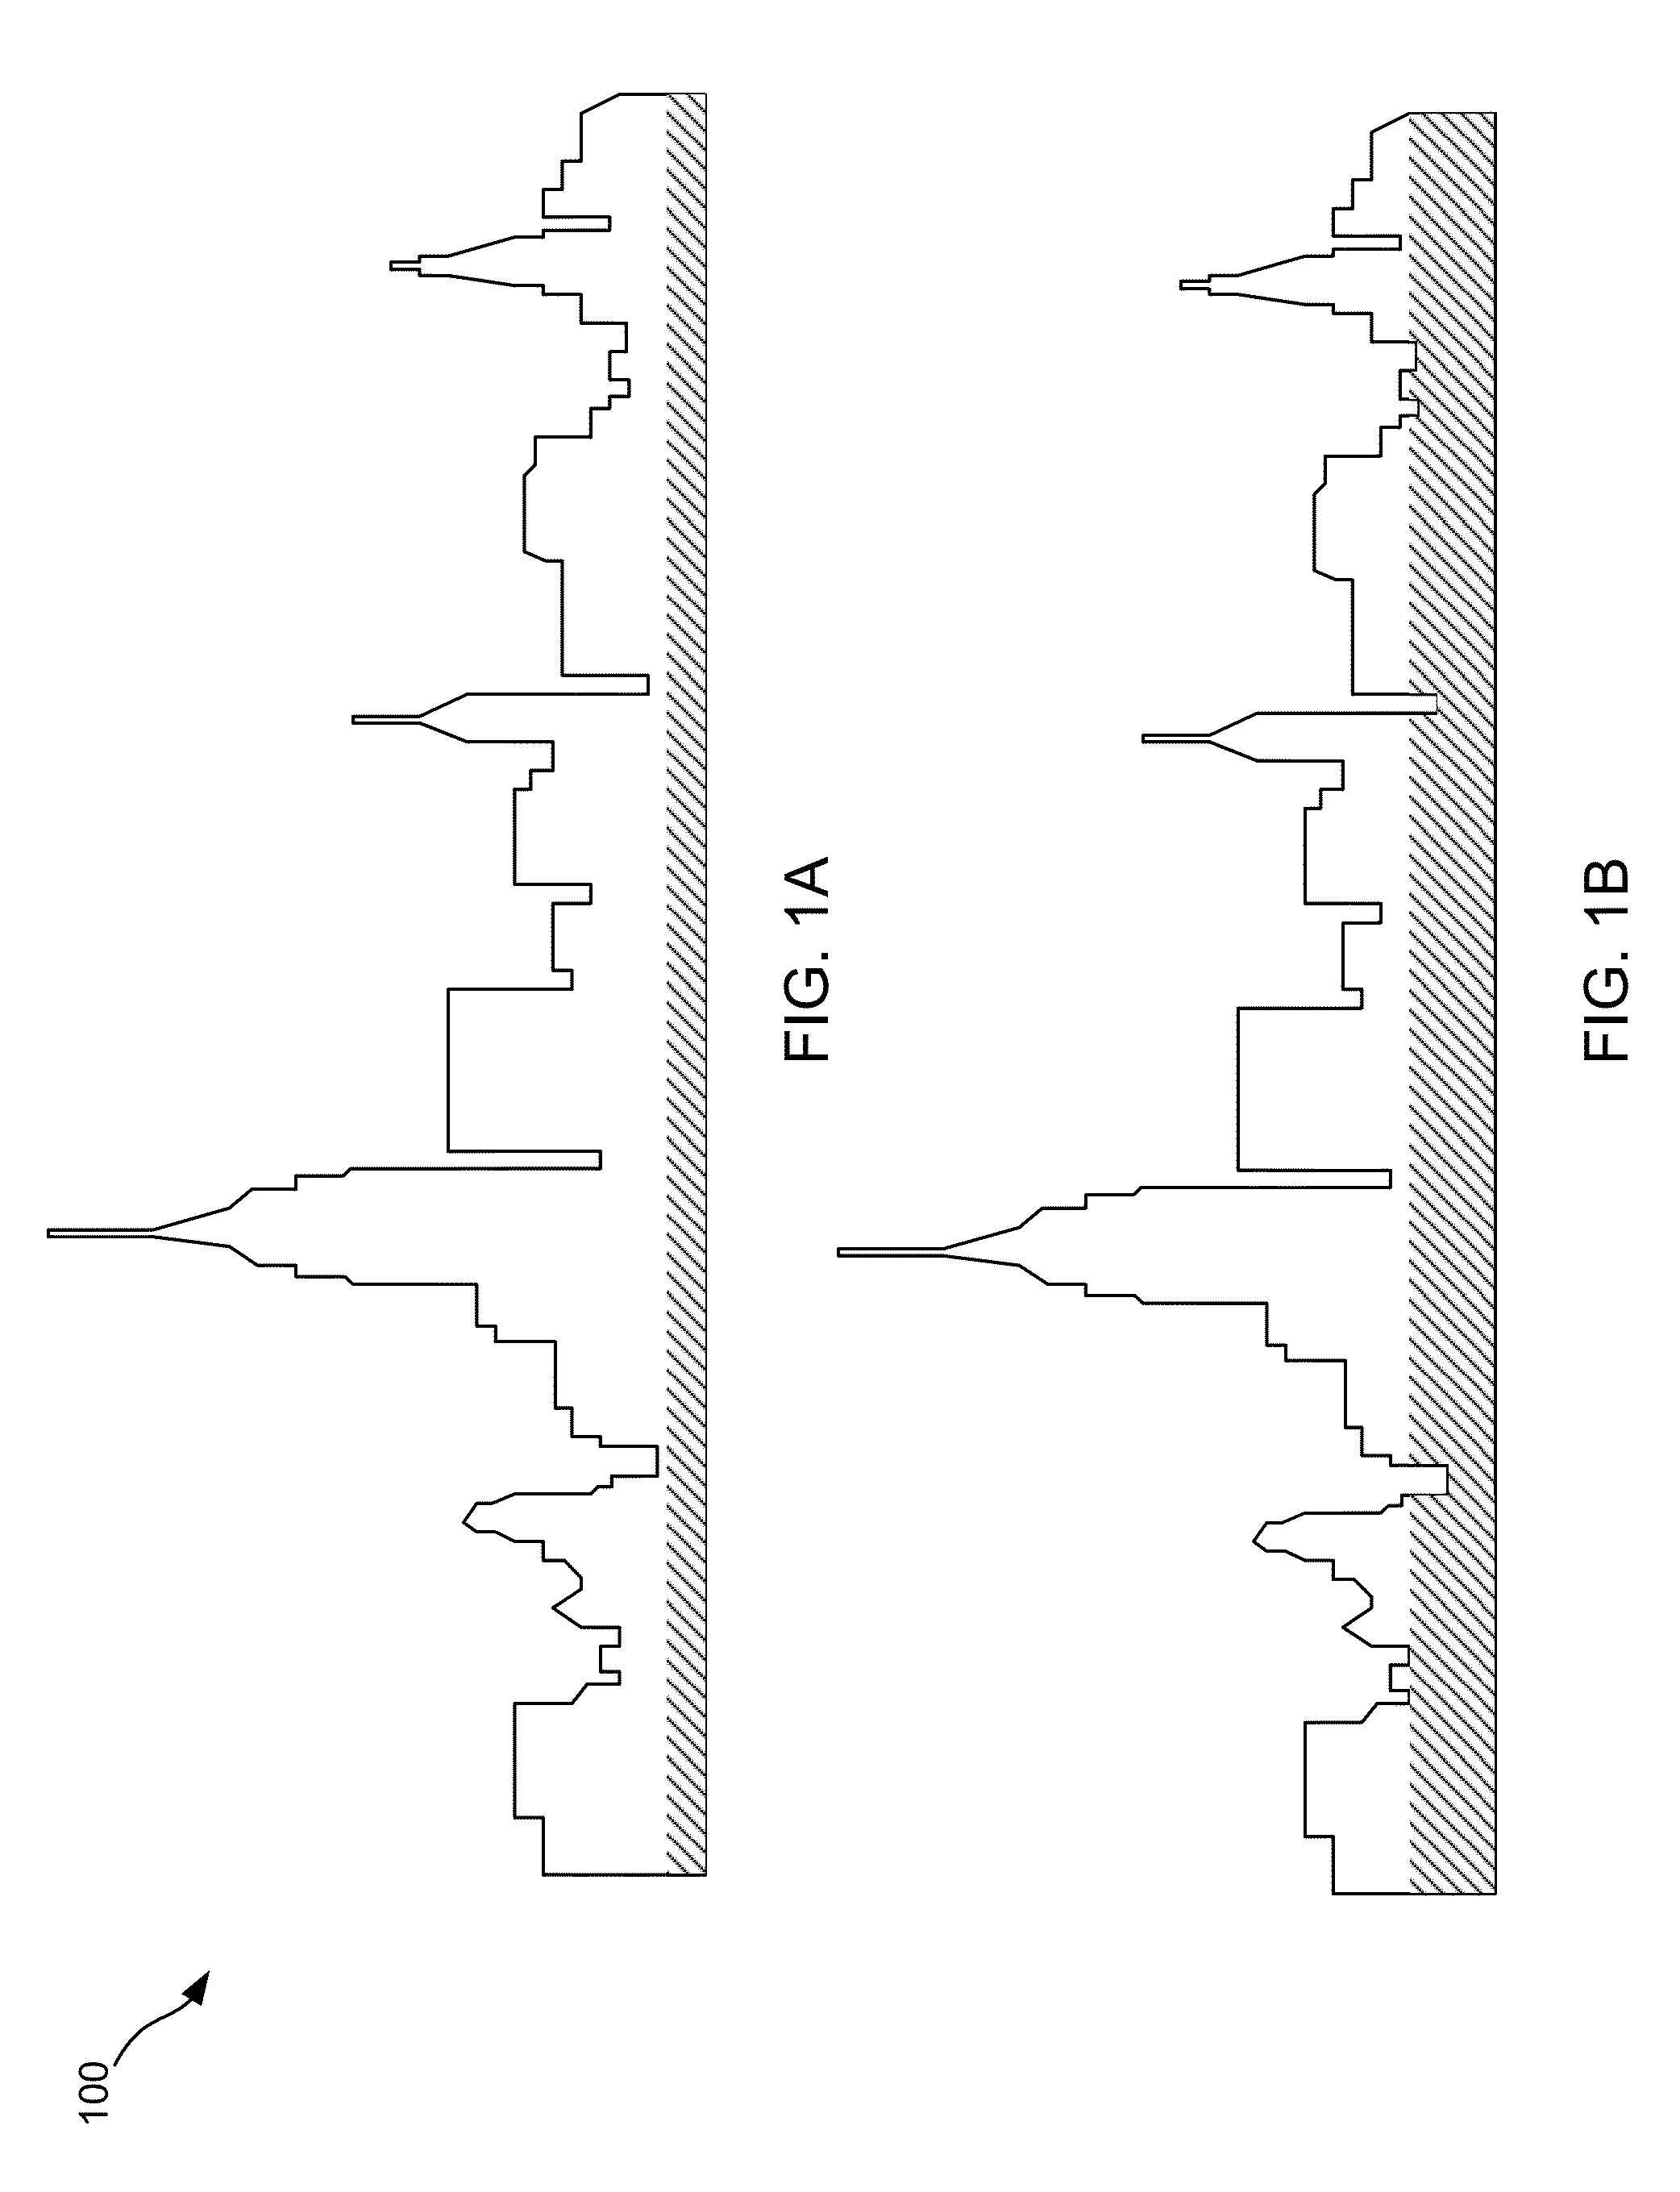
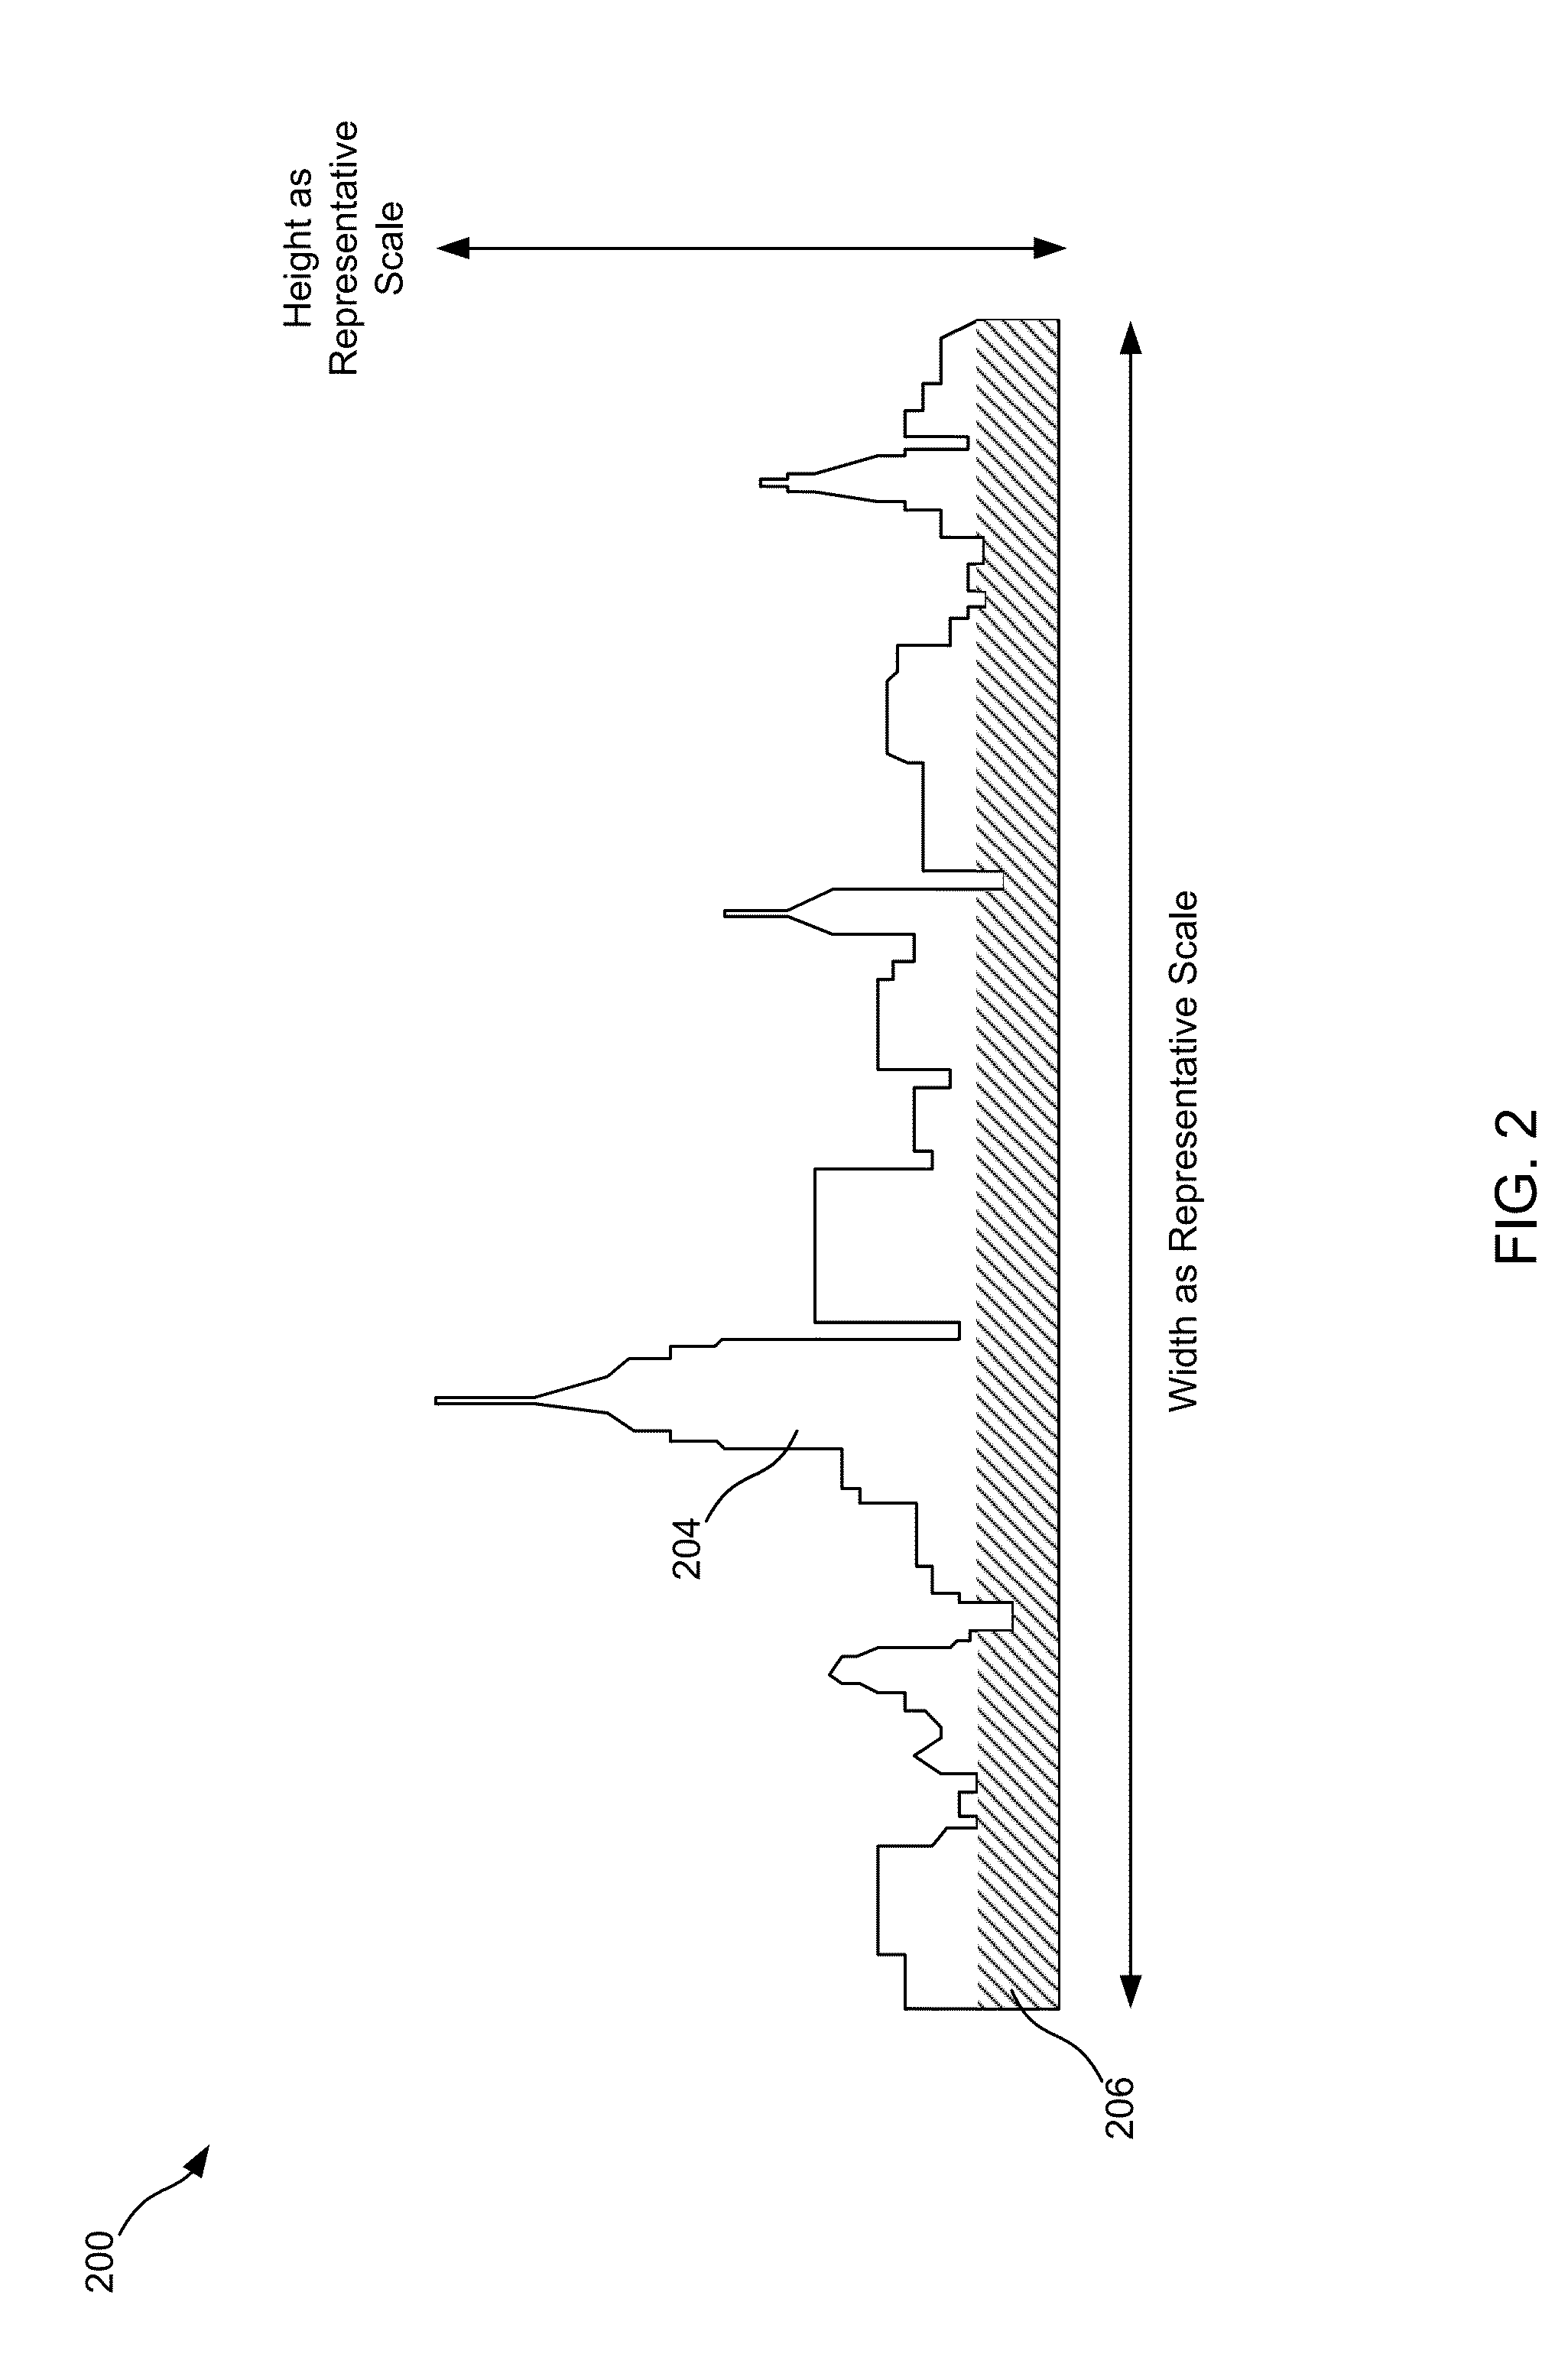
[0041]As noted in the Background, existing methods of creating infographics are either limited to simple shapes, such as the rectangles, circles, donuts, and pyramids that programmers have created via brute force scripting methods (e.g., using an equation to describe and fill a shape), or to complex shapes created by an artist that can only display previously-known data (i.e., at the time that an artist created the complex shapes). Yet, if one wants to fill a complex shape, such as a company logo, outline of a product, or geographic boundaries of sales regions with dynamic data that is ever changing, neither of the above solutions is viable. As a more specific example, take a company sales representative who wishes to show sales levels for different regions of the United States using an infographic of the United States. Traditional methods would require that an artist create images of the United States and the different sales regions, each using a different color, and a different im...
PUM
 Abstract
Description
Claims
Application Information
 - R&D
- Intellectual Property
- Life Sciences
- Materials
- Tech Scout
- Unparalleled Data Quality
- Higher Quality Content
- 60% Fewer Hallucinations
Browse by: Latest US Patents, China's latest patents, Technical Efficacy Thesaurus, Application Domain, Technology Topic, Popular Technical Reports.
© 2025 PatSnap. All rights reserved.Legal|Privacy policy|Modern Slavery Act Transparency Statement|Sitemap|About US| Contact US: help@patsnap.com


