
Method for Hematology Analysis

a hematology and analysis method technology, applied in the field of hematology analysis, can solve the problems of insufficient strength, artificially low white blood cell counts, and difficulties in the detection of red blood cells and white blood cells, and achieve the effects of reducing the complexity of hematology analyzers, reducing the overall cost, and reducing the error frequency of hematology analyzers

Active Publication Date: 2016-01-21
ABBOTT LAB INC
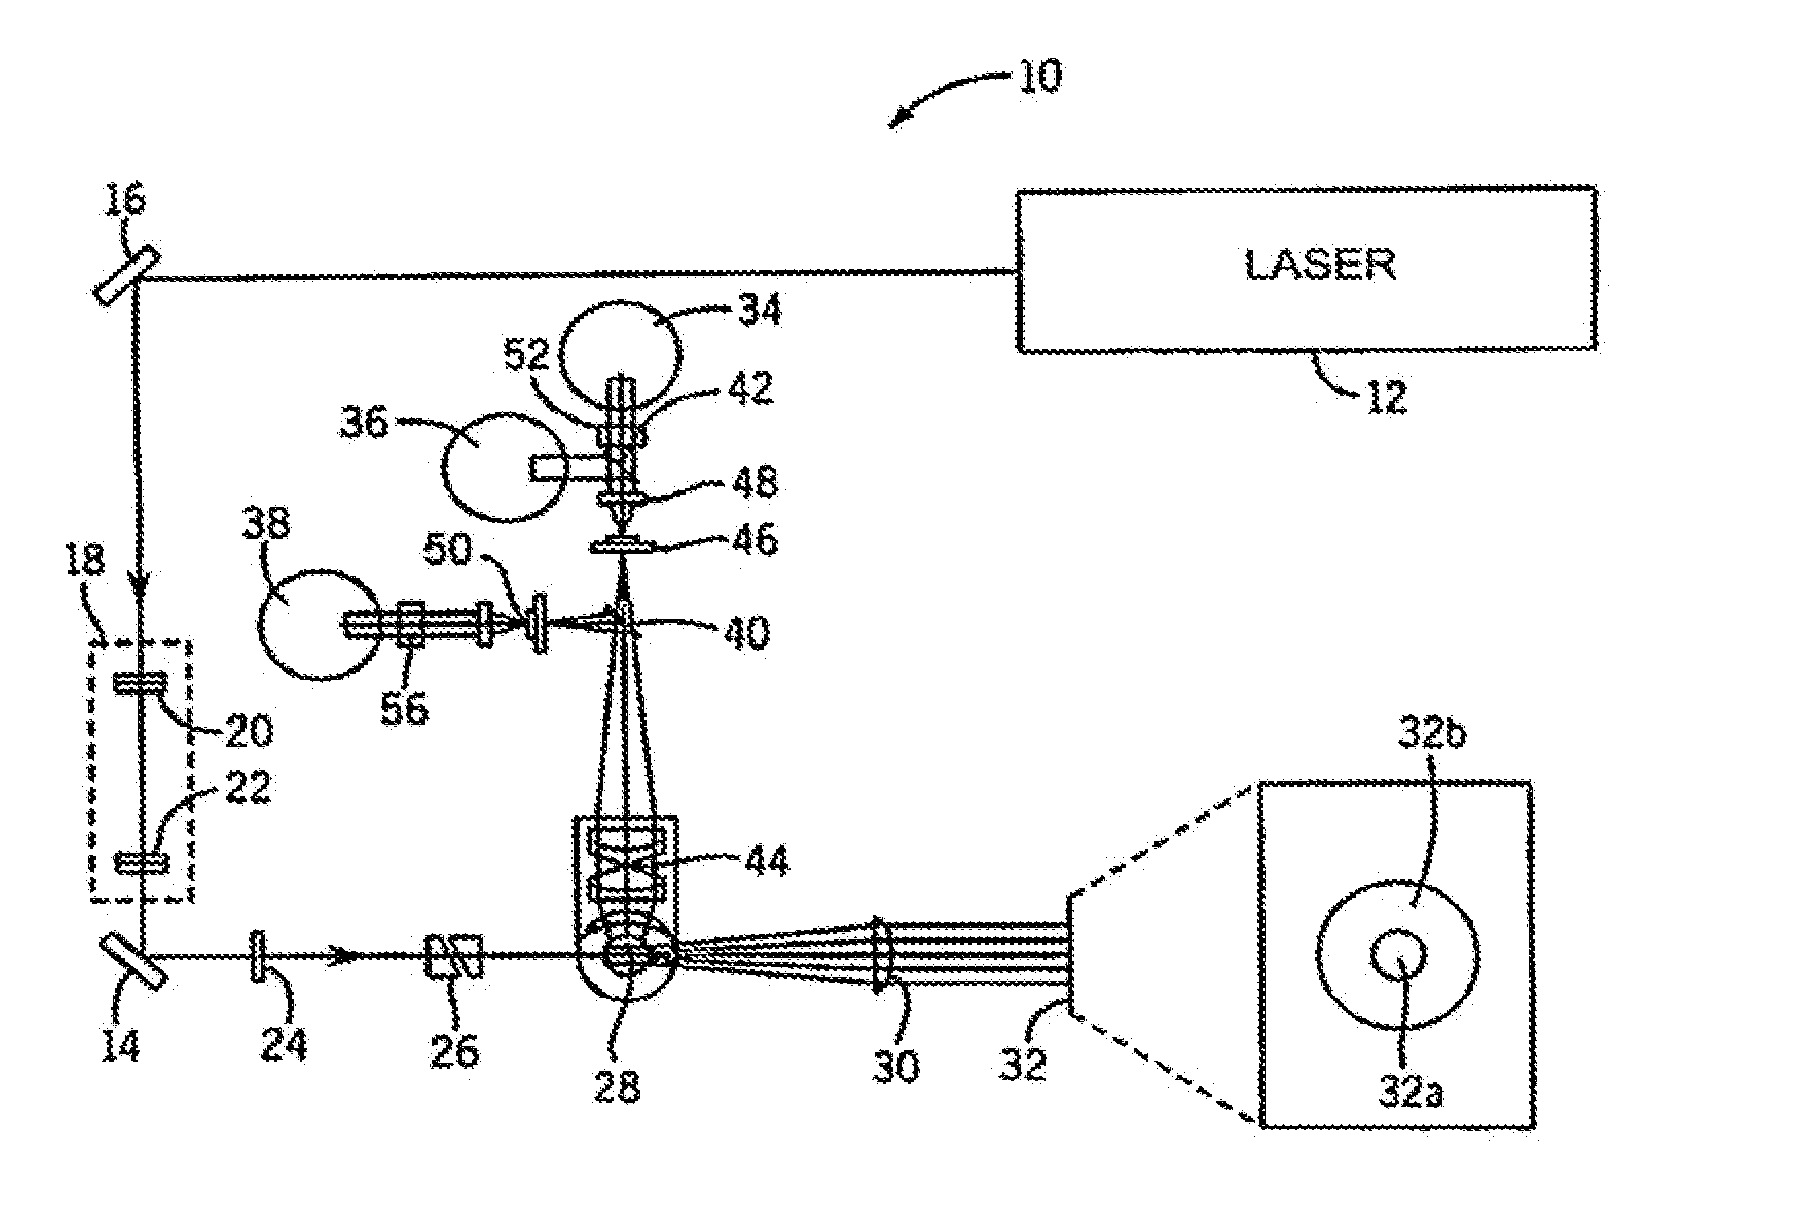
View PDF0 Cites 0 Cited by
  • Summary
  • Abstract
  • Description
  • Claims
  • Application Information

AI Technical Summary

Benefits of technology

The patent describes a method that simplifies the process of hematology analyzers, reducing the number of reagents needed and the complexity of the equipment. This method also reduces errors and improves accuracy, while also being cost-effective. Additionally, the method eliminates the negative effects of lysing agents on blood samples, even if red blood cells are resistant to lysis. The method can be used with both complete and partial lysis of red blood cells.

Problems solved by technology

However, the use of lysing agents to lyse red blood cells brings about certain difficulties and complications in the detection of red blood cells and white blood cells.
The lysing agent may be insufficiently strong, thereby resulting in red blood cells being counted as white blood cells.
Alternatively, the lysing agent may be excessively strong, thereby resulting in artificially low counts of white blood cells.
In hematological assays aimed at determining parameters from human whole blood, there are two physiological factors that present obstacles to simple, rapid, and accurate determination of cell counts.
Therefore, when determining red blood cells mainly by size discrimination, the asymmetry in concentration works in one's favor, since the occasional white blood cell misclassified as a red blood cell will not, generally, affect the overall accuracy of the measured concentration of red blood cells to any appreciable degree; however, the converse is not true, and any unaccounted for interference from red blood cells in determining the concentration of lymphocytes (and, by extension, the overall concentration of white blood cells) would yield very inaccurate results.
Both of these methods have drawbacks.
First of all, the lysing reagent used to dissolve the red blood cells can attack the white blood cells as well, reducing their integrity and eventually dissolving them.
This drawback is magnified with fragile white blood cells, which are abnormal on account of some type of pathological condition (such, as, for example, chronic lymphocytic leukemia).
Another drawback is attributable to certain types of red blood cells, such as, for example, those found in neonates, and in patients with thalassemia, sickle-cell anemia, and liver disease, which red blood cells are naturally resistant to lysis, and which red blood cells therefore tend to persist as interferents in white blood cell assays involving lysis.
This tailoring, however, is a complex solution, which additionally either requires prior knowledge of the state of the patient, or must be used as a reflex test following a standard complete blood count (CBC).
Turning to the previously mentioned fluorescence-based approach for discriminating red blood cells from lymphocytes, a major obstacle is the measurement rate.
This throughput is far lower than that achievable by most automated hematology analyzers commercially available today, severely limiting the commercial usefulness of the one pass method.
While it would technically be possible to count the white blood cells using this same assay, because they are sufficiently differentiated by fluorescence from either red blood cells or reticulocytes to obtain the desired accuracy, the relatively low concentration of white blood cells in the dilution used makes it an impractical option to achieve the required statistical precision.
The complex design often results in higher overall costs of hematology analyzers, as well as greater possibility of poor reliability of the hematology analyzers.

Method used


Image

  • Method for Hematology Analysis
  • Method for Hematology Analysis
  • Method for Hematology Analysis

Examples


example 1

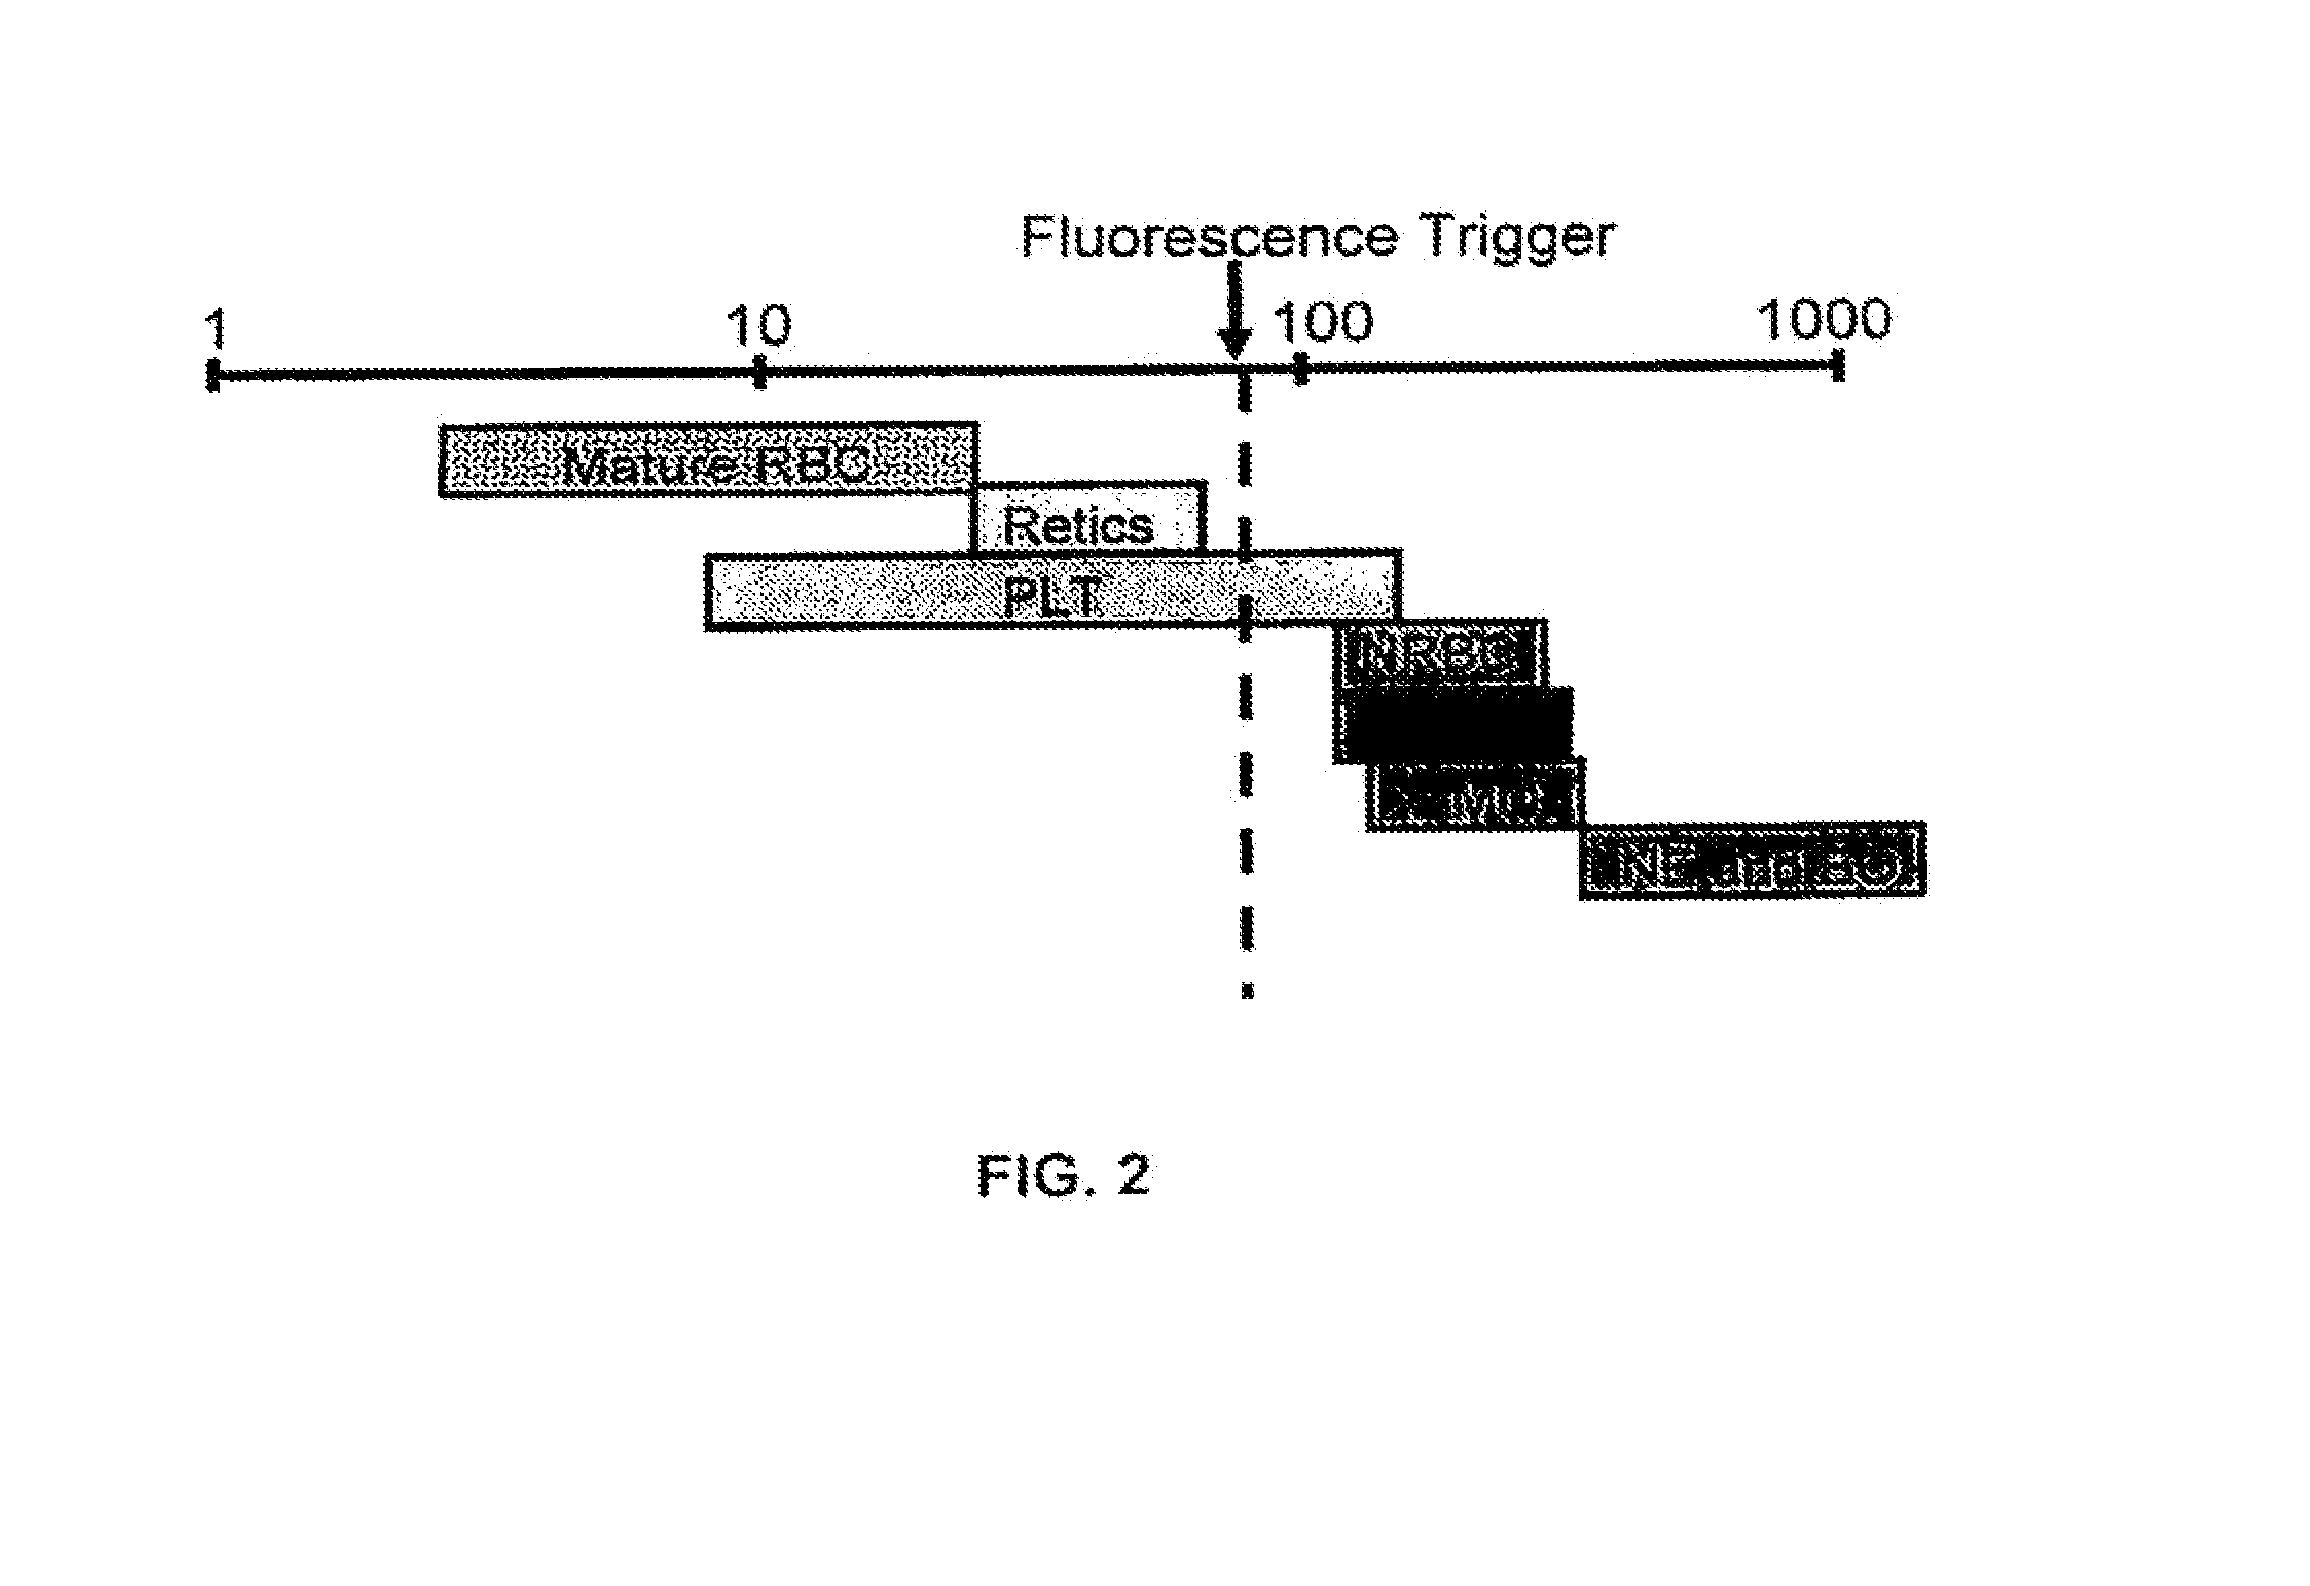
[0077]This example illustrates the capture of white blood cells and bright platelet events by means of a fluorescent trigger, following interactions of the sample of blood with dye molecules.

[0078]The following procedure, including apparatus, parameters, reagents, including diluents, was used for EXAMPLES 1-5, inclusive.

[0079]A fluorescent dye was used to stain and differentiate white blood cells (by means of DNA staining), nucleated red blood cells (by means of DNA staining), and reticulocytes (by means of RNA staining). A fluorescent trigger was used to generate two data blocks, thereby separating the highly fluorescent cells (white blood cells and nucleated red blood cells) from low fluorescent events (red blood cells and platelets). The first data block was used to analyze red blood cells, platelets, and reticulocytes. The second data block was used to identify white blood cells and nucleated red blood cells.

[0080]Each cell population was identified by means of a 407 nm flow cyt...

example 2

[0096]This example illustrates that the method described herein separates red blood cells and platelets from other components of a sample of blood. The sample set included 103 specimens of whole blood, namely, 35 normal samples, 68 abnormal samples, with 12 samples containing or suspected of containing nucleated red blood cells. Two runs were carried out for each sample of blood; CELL-DYN® Sapphire™ hematology analyzer was used as the primary reference, i.e., to determine to what degree the method described herein compares with a hematology analyzer that requires a lysing agent.

[0097]The apparatus, diluent, fluorescent dye, preparation of the sample, and conditions for measurement were the same as that described in EXAMPLE 1.

[0098]The plot in FIG. 5 illustrates the correlation between the CELL-DYN® Sapphire™ hematology analyzer and a hematology analyzer using the method described herein for counting red blood cells. The slope of the best linear fit was 0.899 (R2=0.933). The approxim...

example 3

[0100]This example illustrates the analysis of a white blood cell differential. The apparatus, diluent, fluorescent dye, preparation of the sample, and conditions for measurement were the same as that described in EXAMPLE 1.

[0101]The data, triggered by fluorescent signals (FL), were collected in 20 seconds for all events having a fluorescent signal (FL) higher than 75, including all white blood cells, nucleated red blood cells, if there were any, and a small fraction of bright platelets. 8586 white blood cell events, equivalent to a white blood cell count of 6.48×10³ white blood cells / μL, were captured for a specimen of whole blood having a white blood cell count of 6.29×10³ white blood cells / μL (based on the reference value from a CELL-DYN® Sapphire™ hematology analyzer). The subpopulations of white blood cells, including neutrophils, lymphocytes, monocytes, and eosinophils, were analyzed by means of the signals obtained from a plurality of optical channels.

[0102]The cytogram of FI...


PUM


Abstract

A method whereby one or more fluorescent dyes are used to bind and stain nucleic acids in certain blood cells, such as, for example, white blood cells, nucleated red blood cells, and reticulocytes, and to induce fluorescent emissions upon excitation of photons from a given source of light, such as, for example, a laser, at an appropriate wavelength. More particularly, this invention provides a method whereby a fluorescent trigger is used in a data collection step for collecting events that emit strong fluorescence, in order to separate white blood cells and nucleated red blood cells from red blood cells and platelets without the need for using a lysing agent.

Description

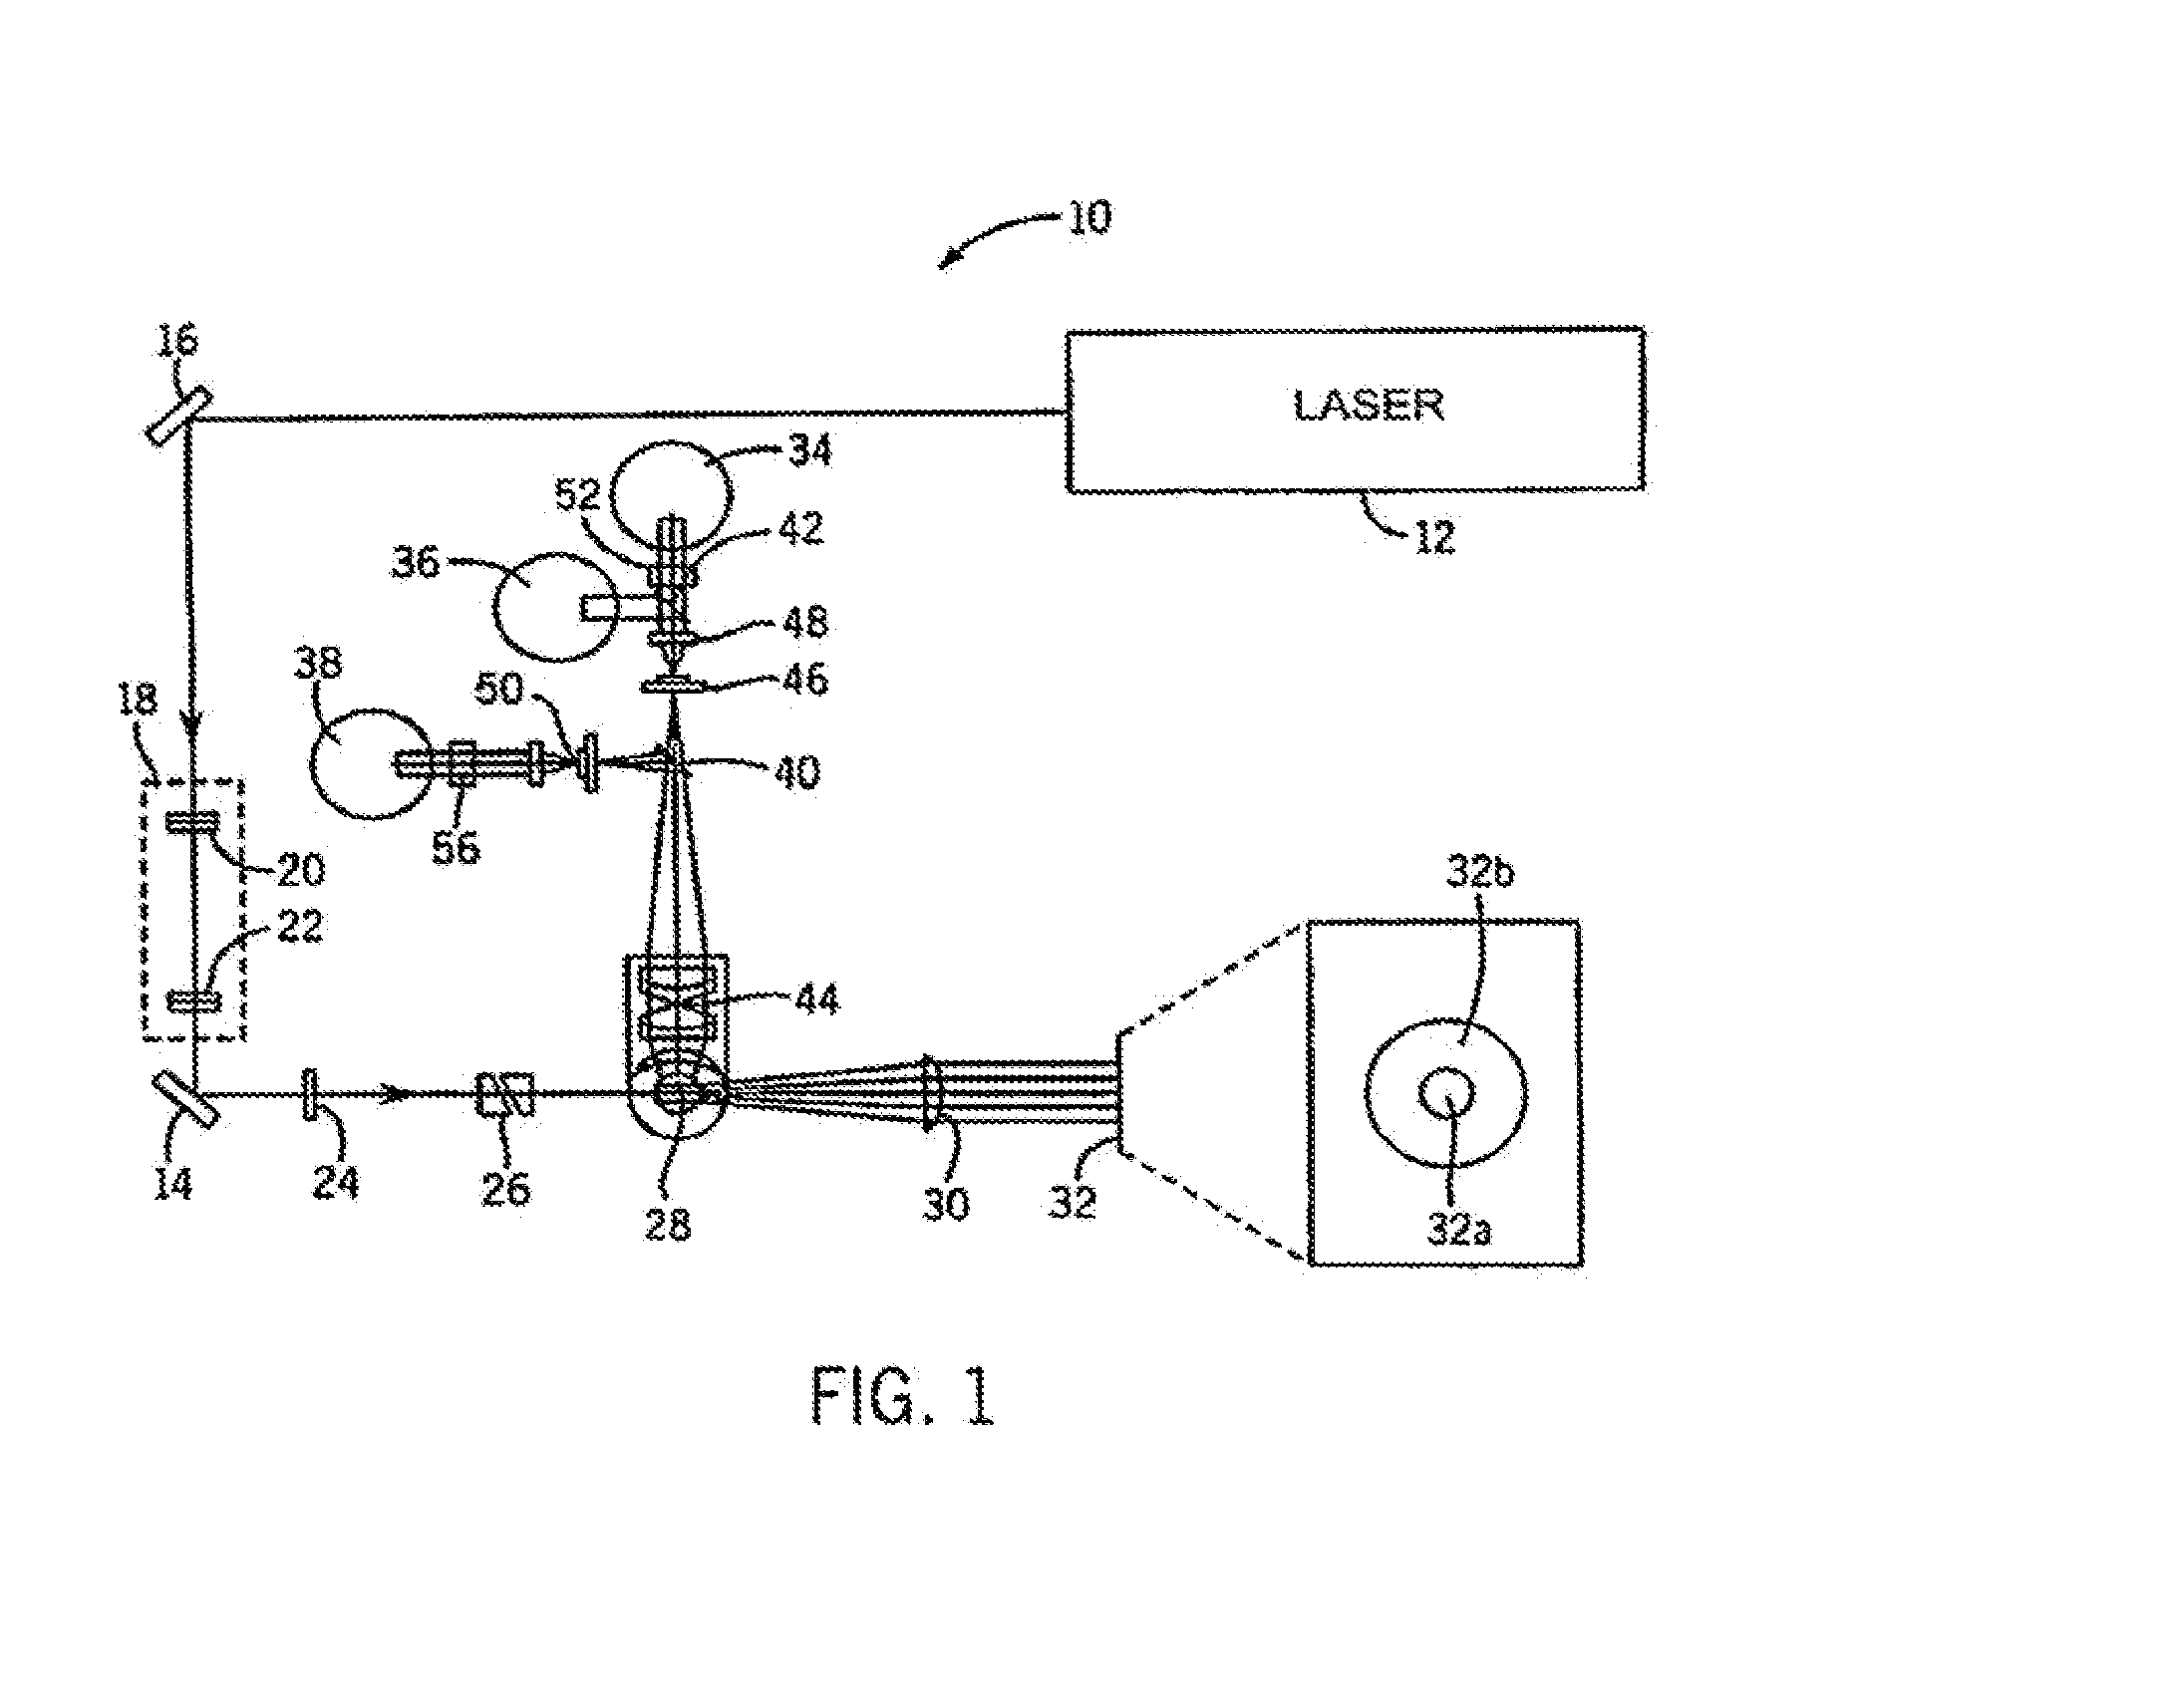
RELATED APPLICATIONS[0001]The present application claims priority from of co-pending U.S. Provisional Patent Application No. 61 / 331,516, filed May 5, 2010 and co-pending U.S. Provisional Patent Application No. 61 / 331,867, filed May 6, 2010.BACKGROUND OF THE INVENTION[0002]1. Field of the Invention[0003]This invention relates to a method for hematology analysis, wherein fluorescent dyes are used to distinguish various components of a sample of blood.[0004]2. Discussion of the Art[0005]The CELL-DYN® Sapphire™ automated hematology analyzer, as well as the CELL-DYN® 4000 automated hematology analyzer, both of which are commercially available from Abbott Laboratories, Santa Clara, Calif., are equipped with an optical bench that can measure multi-angle light scatter and fluorescence, as described in U.S. Pat. Nos. 5,631,165 and 5,939,326, both of which are incorporated herein by reference. Furthermore, U.S. Pat. Nos. 5,516,695 and 5,648,225, both of which are incorporated herein by refere...

Claims


Application Information

Patent Timeline
Patent Type & Authority Applications(United States)
IPC IPC(8): G01N15/14G01N21/64G01N35/10
CPCG01N15/147G01N33/5047G01N33/5094G01N33/582G01N2015/0065G01N2015/149G01N2021/6439G01N2015/1006G01N2015/0069G01N35/1002G01N21/6428G01N15/1434G01N2015/1486G01N15/01G01N15/149G01N2015/011
Inventor WU, JIONGVACCA, GIACOMO
Owner ABBOTT LAB INC
Learn More