Multiple device correlation

a multi-device, correlation technology, applied in the direction of probabilistic networks, instruments, location information based services, etc., can solve the problems of time-consuming initial data collection, poor performance of subsystems, prone to a large number of false positives and false negatives, etc., to achieve accurate user counts

Inactive Publication Date: 2016-08-04
VODAFONE IP LICENSING
View PDF0 Cites 12 Cited by
  • Summary
  • Abstract
  • Description
  • Claims
  • Application Information

AI Technical Summary

Benefits of technology

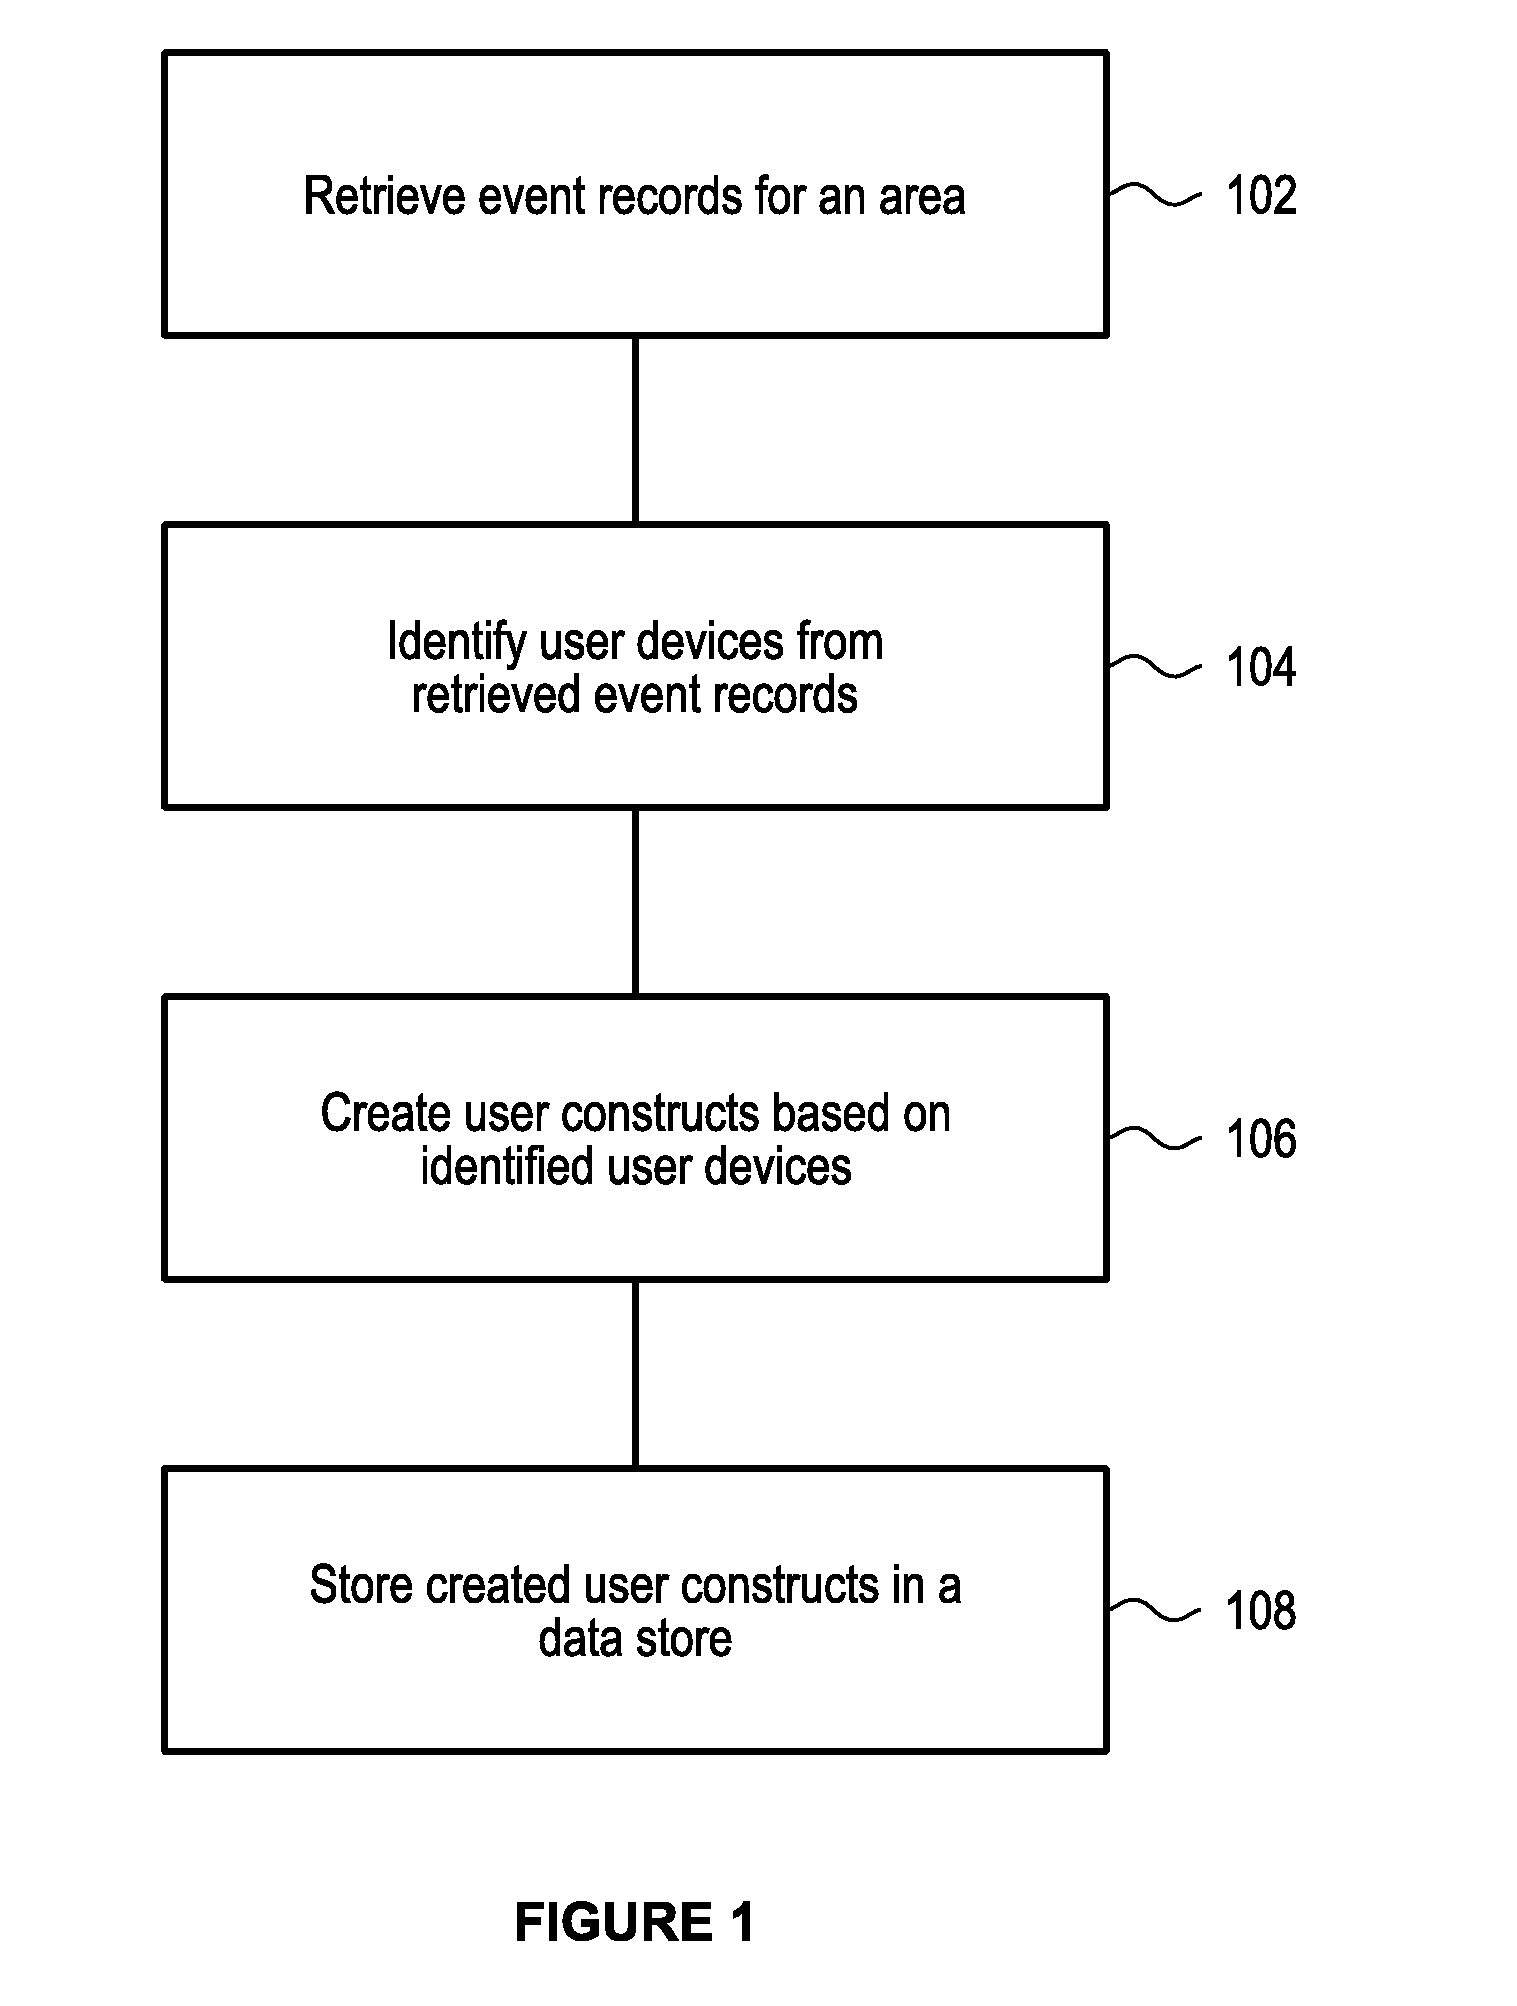
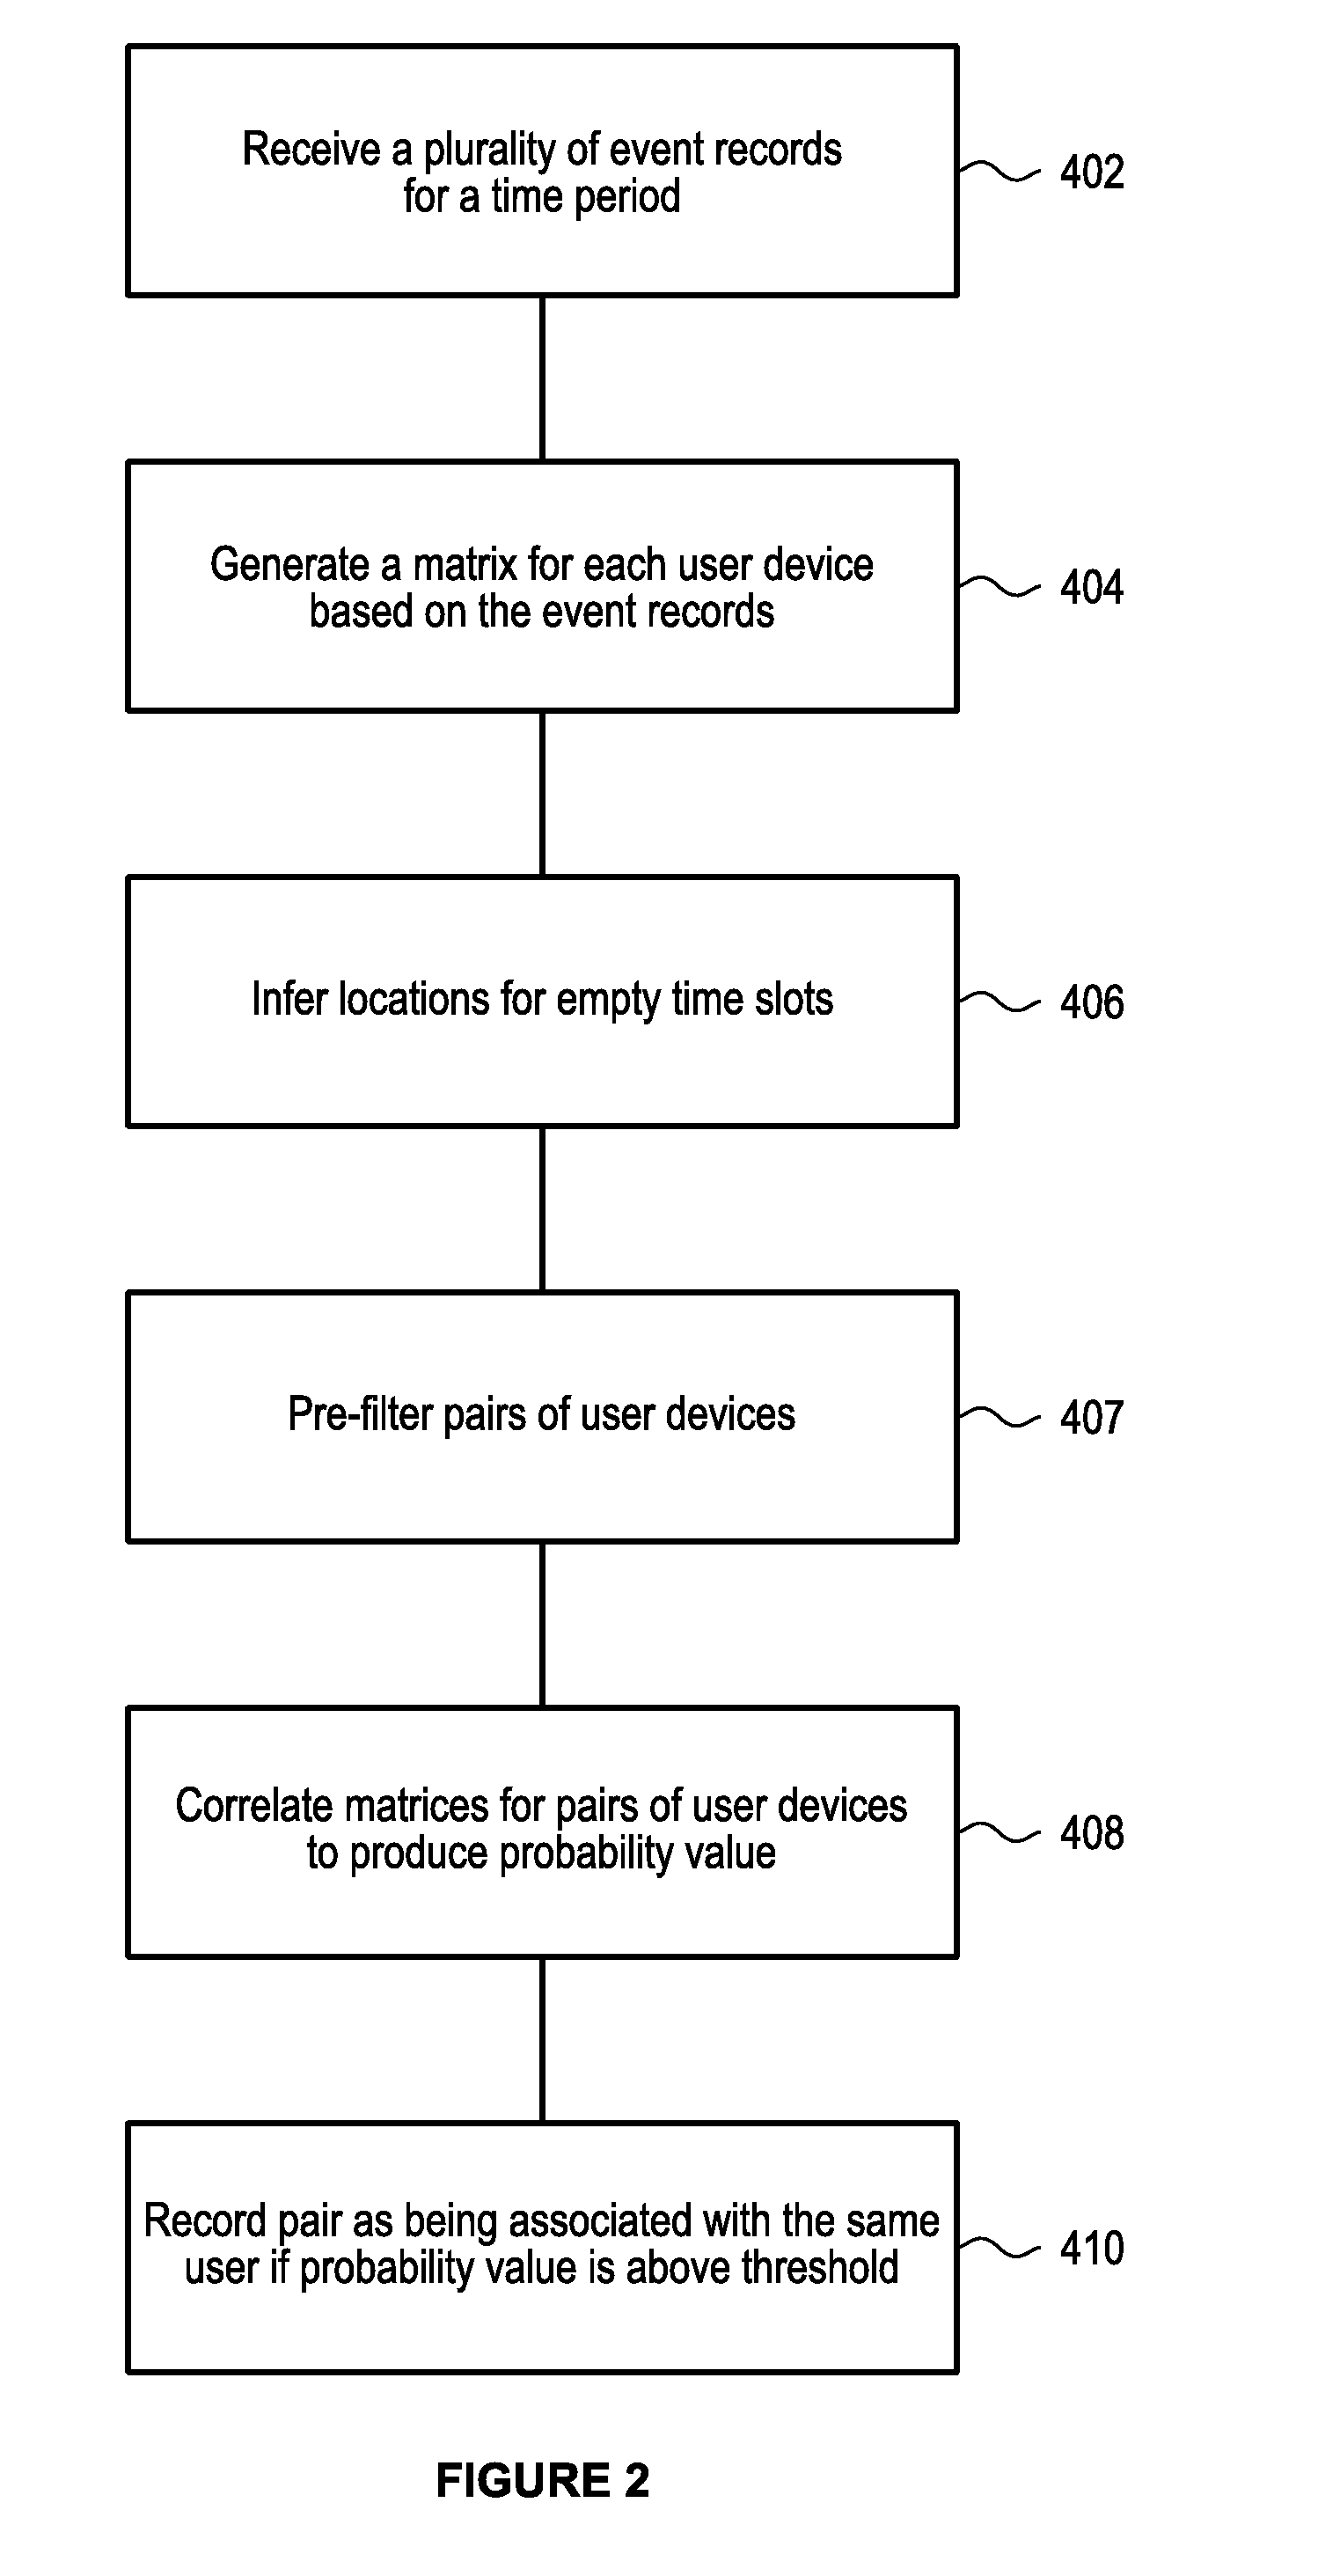
[0009]According to a first aspect, there is provided a method for detecting a common user of a plurality of user devices in a network. First, a plurality of event records is received. Each of the event records corresponds to an event in a network (such as a telecommunications network) and comprises a device identifier and event information. A correlation can then be calculated between a first subset of the plurality of event records having a first device identifier and a second subset of the plurality of event records having a second device identifier different from the first device identifier. Based on the correlation, it is then calculated whether the first and second device identifiers relate to user devices associated with the same user. In this manner, two otherwise unrelated user devices can be calculated as being related to the same user. This can then allow for a more accurate user count, by avoiding the double-counting that would otherwise occur.
[0016]Comparing the first matrix and the second matrix may comprise selecting a mask based on a type of cohort; applying the mask to the first matrix to generate a first masked matrix; applying the mask to the second matrix to generate a second masked matrix; and comparing the first masked matrix and the second masked matrix. This allows the cohort inference to based only on a selection of the time slots in each matrix. This reflects that certain time slots are more likely to be correlated with certain cohorts (such as day time slots are likely to relate to co-workers), thereby improving the accuracy of the inference.
[0023]In preferred embodiments, prior to calculating a correlation, the method may further comprise: calculating a most common location for the first device; calculating a most common location for the second device; comparing the most common location for the first device with the most common location for the second device; and based on the comparison, determining whether the first and second devices could be associated with the same user. This provides a fast pre-filter to eliminate pairs of user devices where it is practically impossible that they relate to the same user. This reduces the overall computational complexity of the method.

Problems solved by technology

However, a key weakness with this manual process is that it is a very time-consuming to initially gather the data.
Further, because the data is not at all real-time, and in fact relies on a past sample being extrapolated for future occasions, it can be very inaccurate, causing poor performance of the subsystems.
Although accurate footfall analytics would provide the best basis for automated control of subsystems, the difficulty with gathering the data has led to attempts in the prior art to consider other approaches.
However, such an approach is only suitable where there is an easily measured output, and in any case requires monitoring infrastructure to be installed and maintained.
However, this does not provide any indication of the number or kind of people who are present, and is prone to a large number of false positives and true negatives.
Such methods therefore are only appropriate in very limited situations where accuracy and precision is not so important.
For example, it is very difficult (or even practically impossible) to determine whether a person is a repeat visitor.
While it may be possible for such sensors to determine whether a person is an adult or a child (based on the size of the person), even this is typically very inaccurate and unreliable.
Any further analysis is generally impossible.
This reduces the overall computational complexity of the method.

Method used


Image

  • Multiple device correlation
  • Multiple device correlation
  • Multiple device correlation

Examples


Embodiment Construction

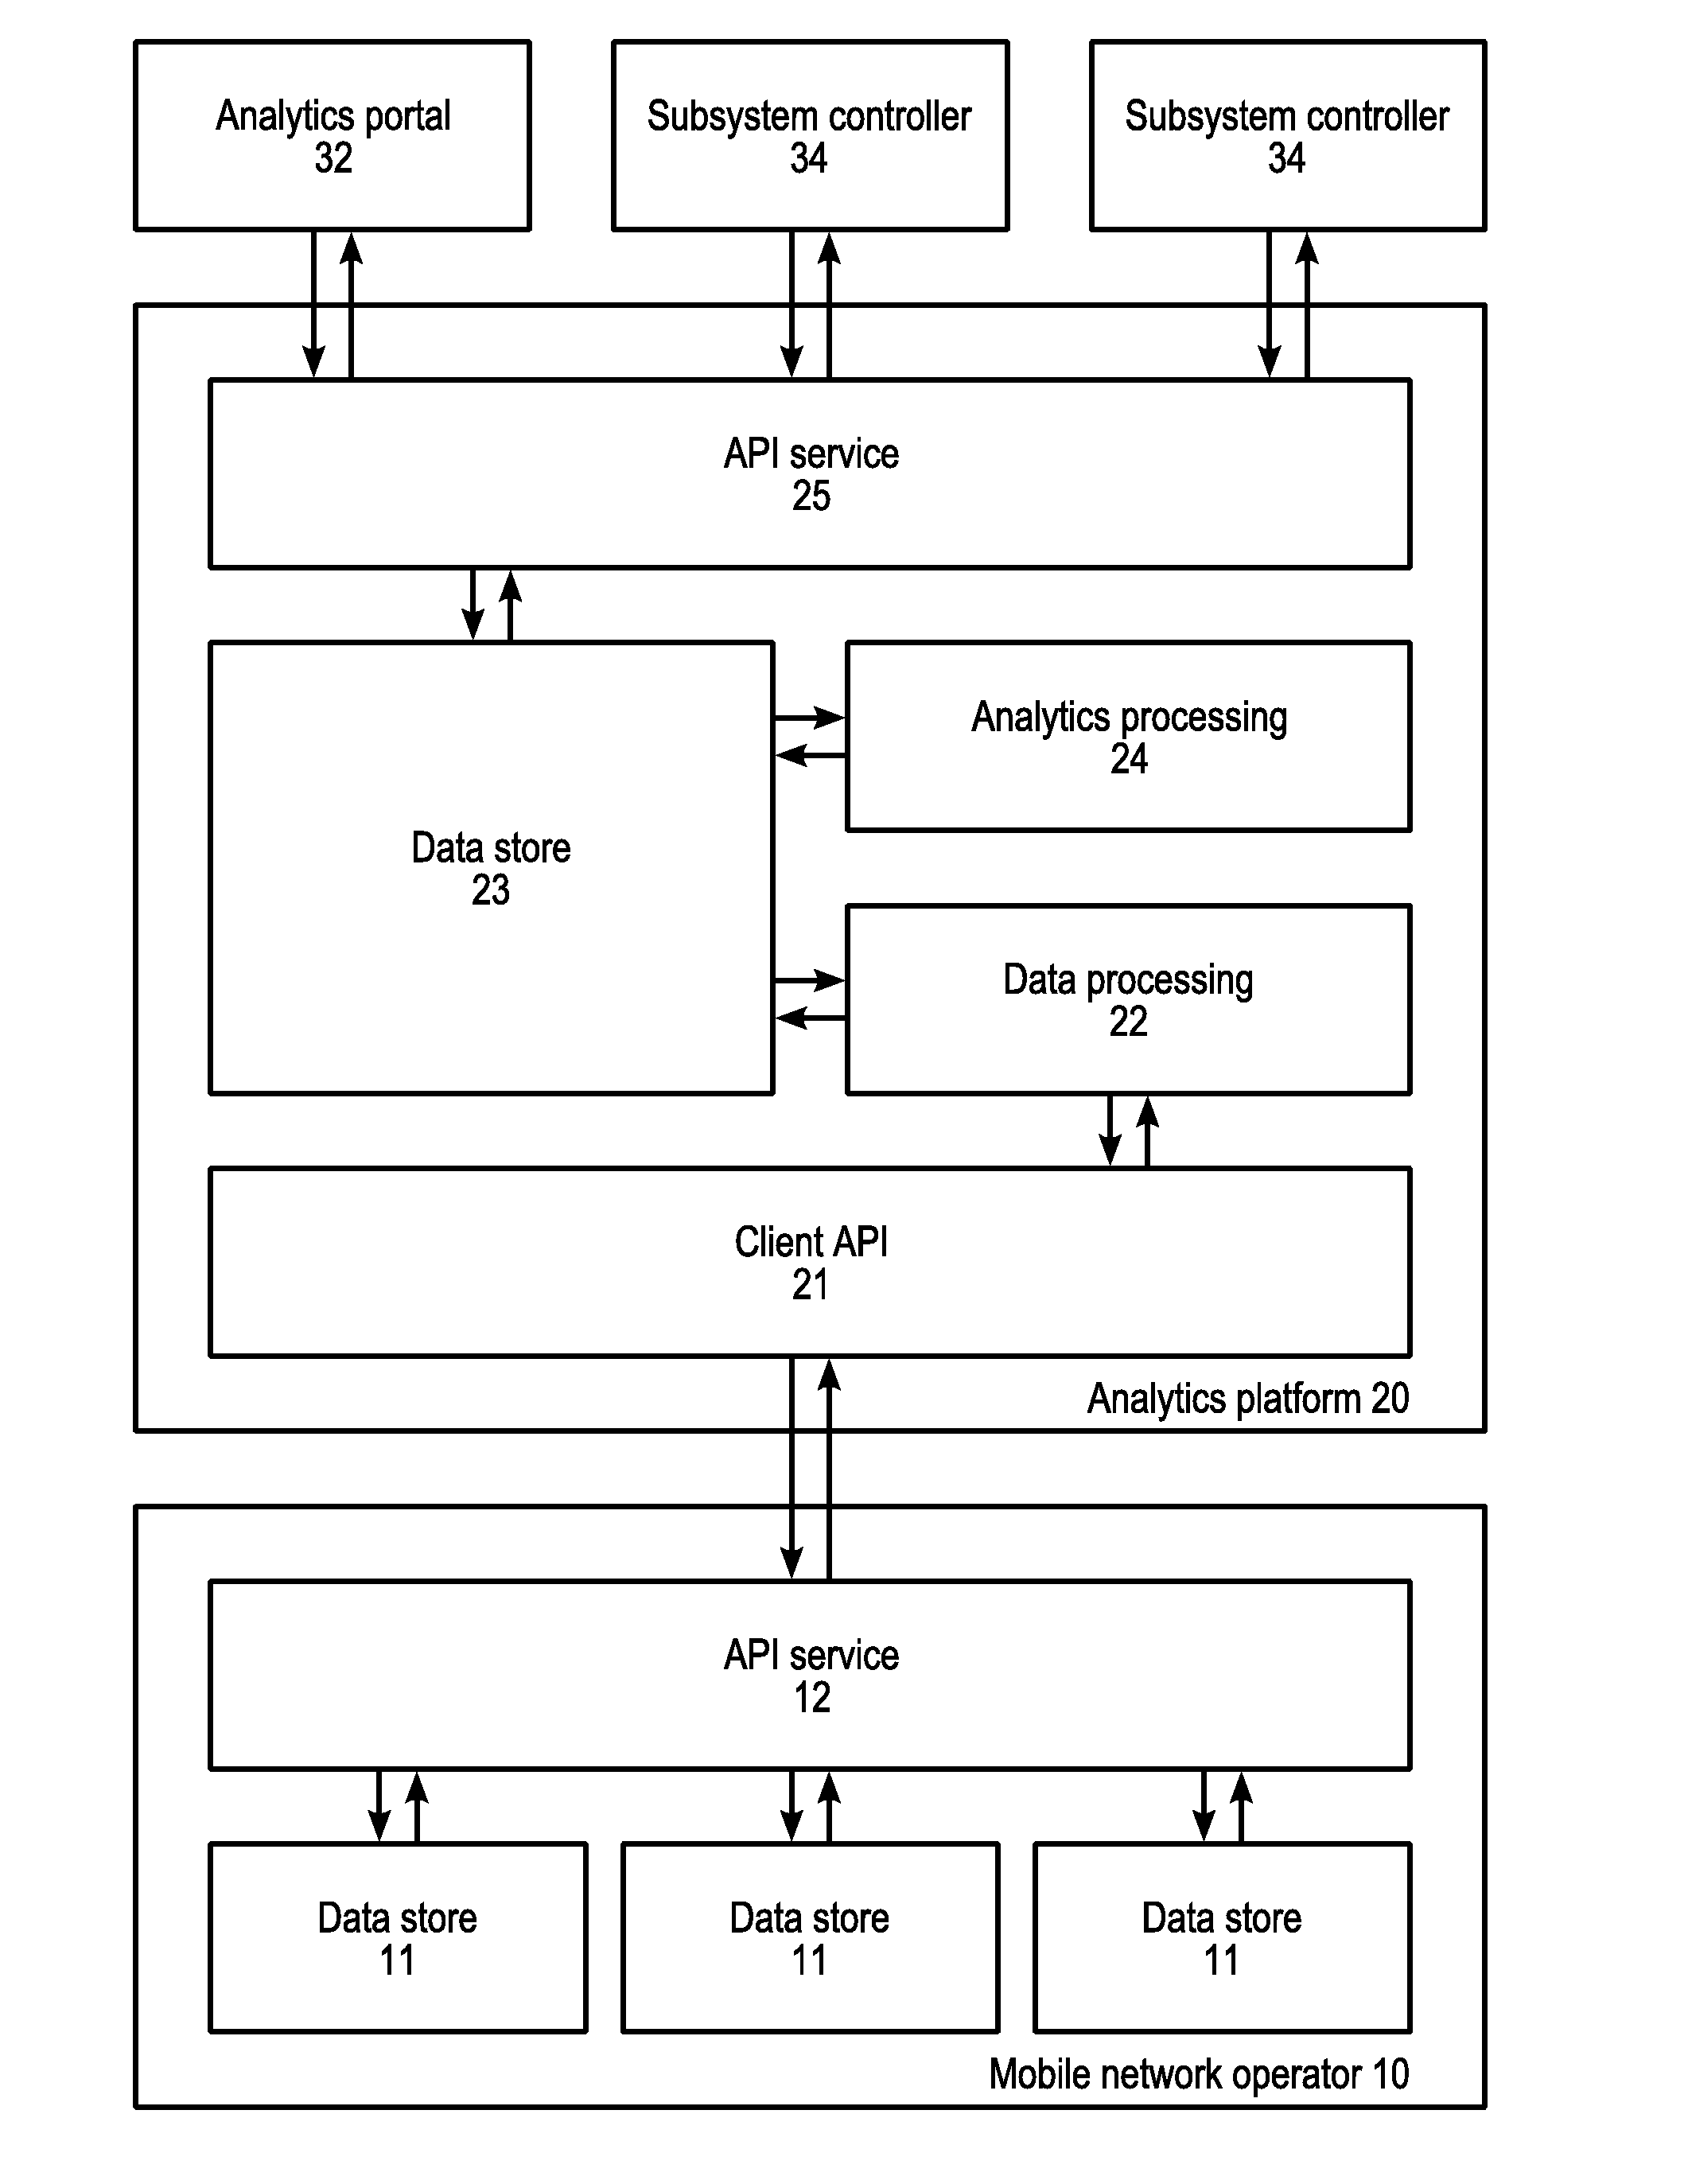
[0036]In order to achieve any useful footfall analytics, the relevant data must first be gathered. In practice, the vast majority of people carry one or more devices with them which communicate with a base station (or telecommunications node) for mobile services and the like. Typically, a device communicates with the nearest base station.

[0037]Based on this, if a device is connected to a base station, it can be reasoned that the device is located within the area around the base station which is closer to the base station than to any other base station. This analysis can be modelled mathematically using a Voronoi algorithm to divide a large aeoaraohical area with a plurality of base stations into cells. Of course, other methodologies can be used to map mobile telecommunication cells and / or communication coverage areas into geographical areas. Each cell can therefore be mapped to a geographical area which will typically be centred on the base station.

[0038]The base station can be a co...


PUM


Abstract

Methods for detecting a common user of a plurality of user devices in a network and for detecting a common cohort for a plurality of users are disclosed. The methods comprise receiving a plurality of event records. Each of the event records corresponds to an event in a network and comprises a device identifier and event information. A correlation is then calculated between a first subset of the event records having a first device identifier and a second subset of the event records having a second device identifier. Based on the correlation, it is then calculated whether the first and second device identifiers relate to user devices associated with the same user, and whether the first and second device identifiers relate to user devices associated with users belonging to a common cohort.

Description

BACKGROUND[0001]Every business or service operates within a spatial dimension—whether this is a physical location such as a retail outlet or a virtual location via a website. In order to effectively operate the business or service, it is essential to understand the demographics and psychographic behaviour of the customers and the users of the business or service. This process is known as “footfall analytics”.[0002]Typically, footfall analytics are performed within the retail business sector and are concerned with measuring the number of visitors to a retail outlet and the demographics of those visitors, and ideally how these translate to sales.[0003]Footfall analytics is not just limited to the retail environment however. For example, a hospital may wish to understand the movements of its patients, a local authority may wish to understand the impact of a planned event or an online retailer may wish to understand where their customers are when using the service.[0004]One area where f...

Claims


Application Information

Patent Timeline
Patent Type & Authority Applications(United States)
IPC IPC(8): G06N7/00H04L29/08H04W4/029
CPCH04L67/22G06N7/005G06N5/04H04W4/028G06Q30/02H04W4/029H04L67/535G06N7/01G06N5/048
Inventor SCARR, KEVIN
Owner VODAFONE IP LICENSING
Why Eureka
Try Eureka