
Geographically smoothed demographic cartograms and cartogram server

a cartogram server and demographic cartography technology, applied in the field of geographic smoothing demographic cartograms and cartogram servers, can solve the problems of difficult recognition of the magnitude of the measurement and interpretation, difficulty in understanding certain aspects of the presented data for the viewer of a choropleth map, and the failure of viewers of euclidean choropleths to recognize, so as to minimize the introduction of distortions and improve visual expression.

Active Publication Date: 2016-12-01
OPENHEALTH CO
View PDF1 Cites 8 Cited by
  • Summary
  • Abstract
  • Description
  • Claims
  • Application Information

AI Technical Summary

Benefits of technology

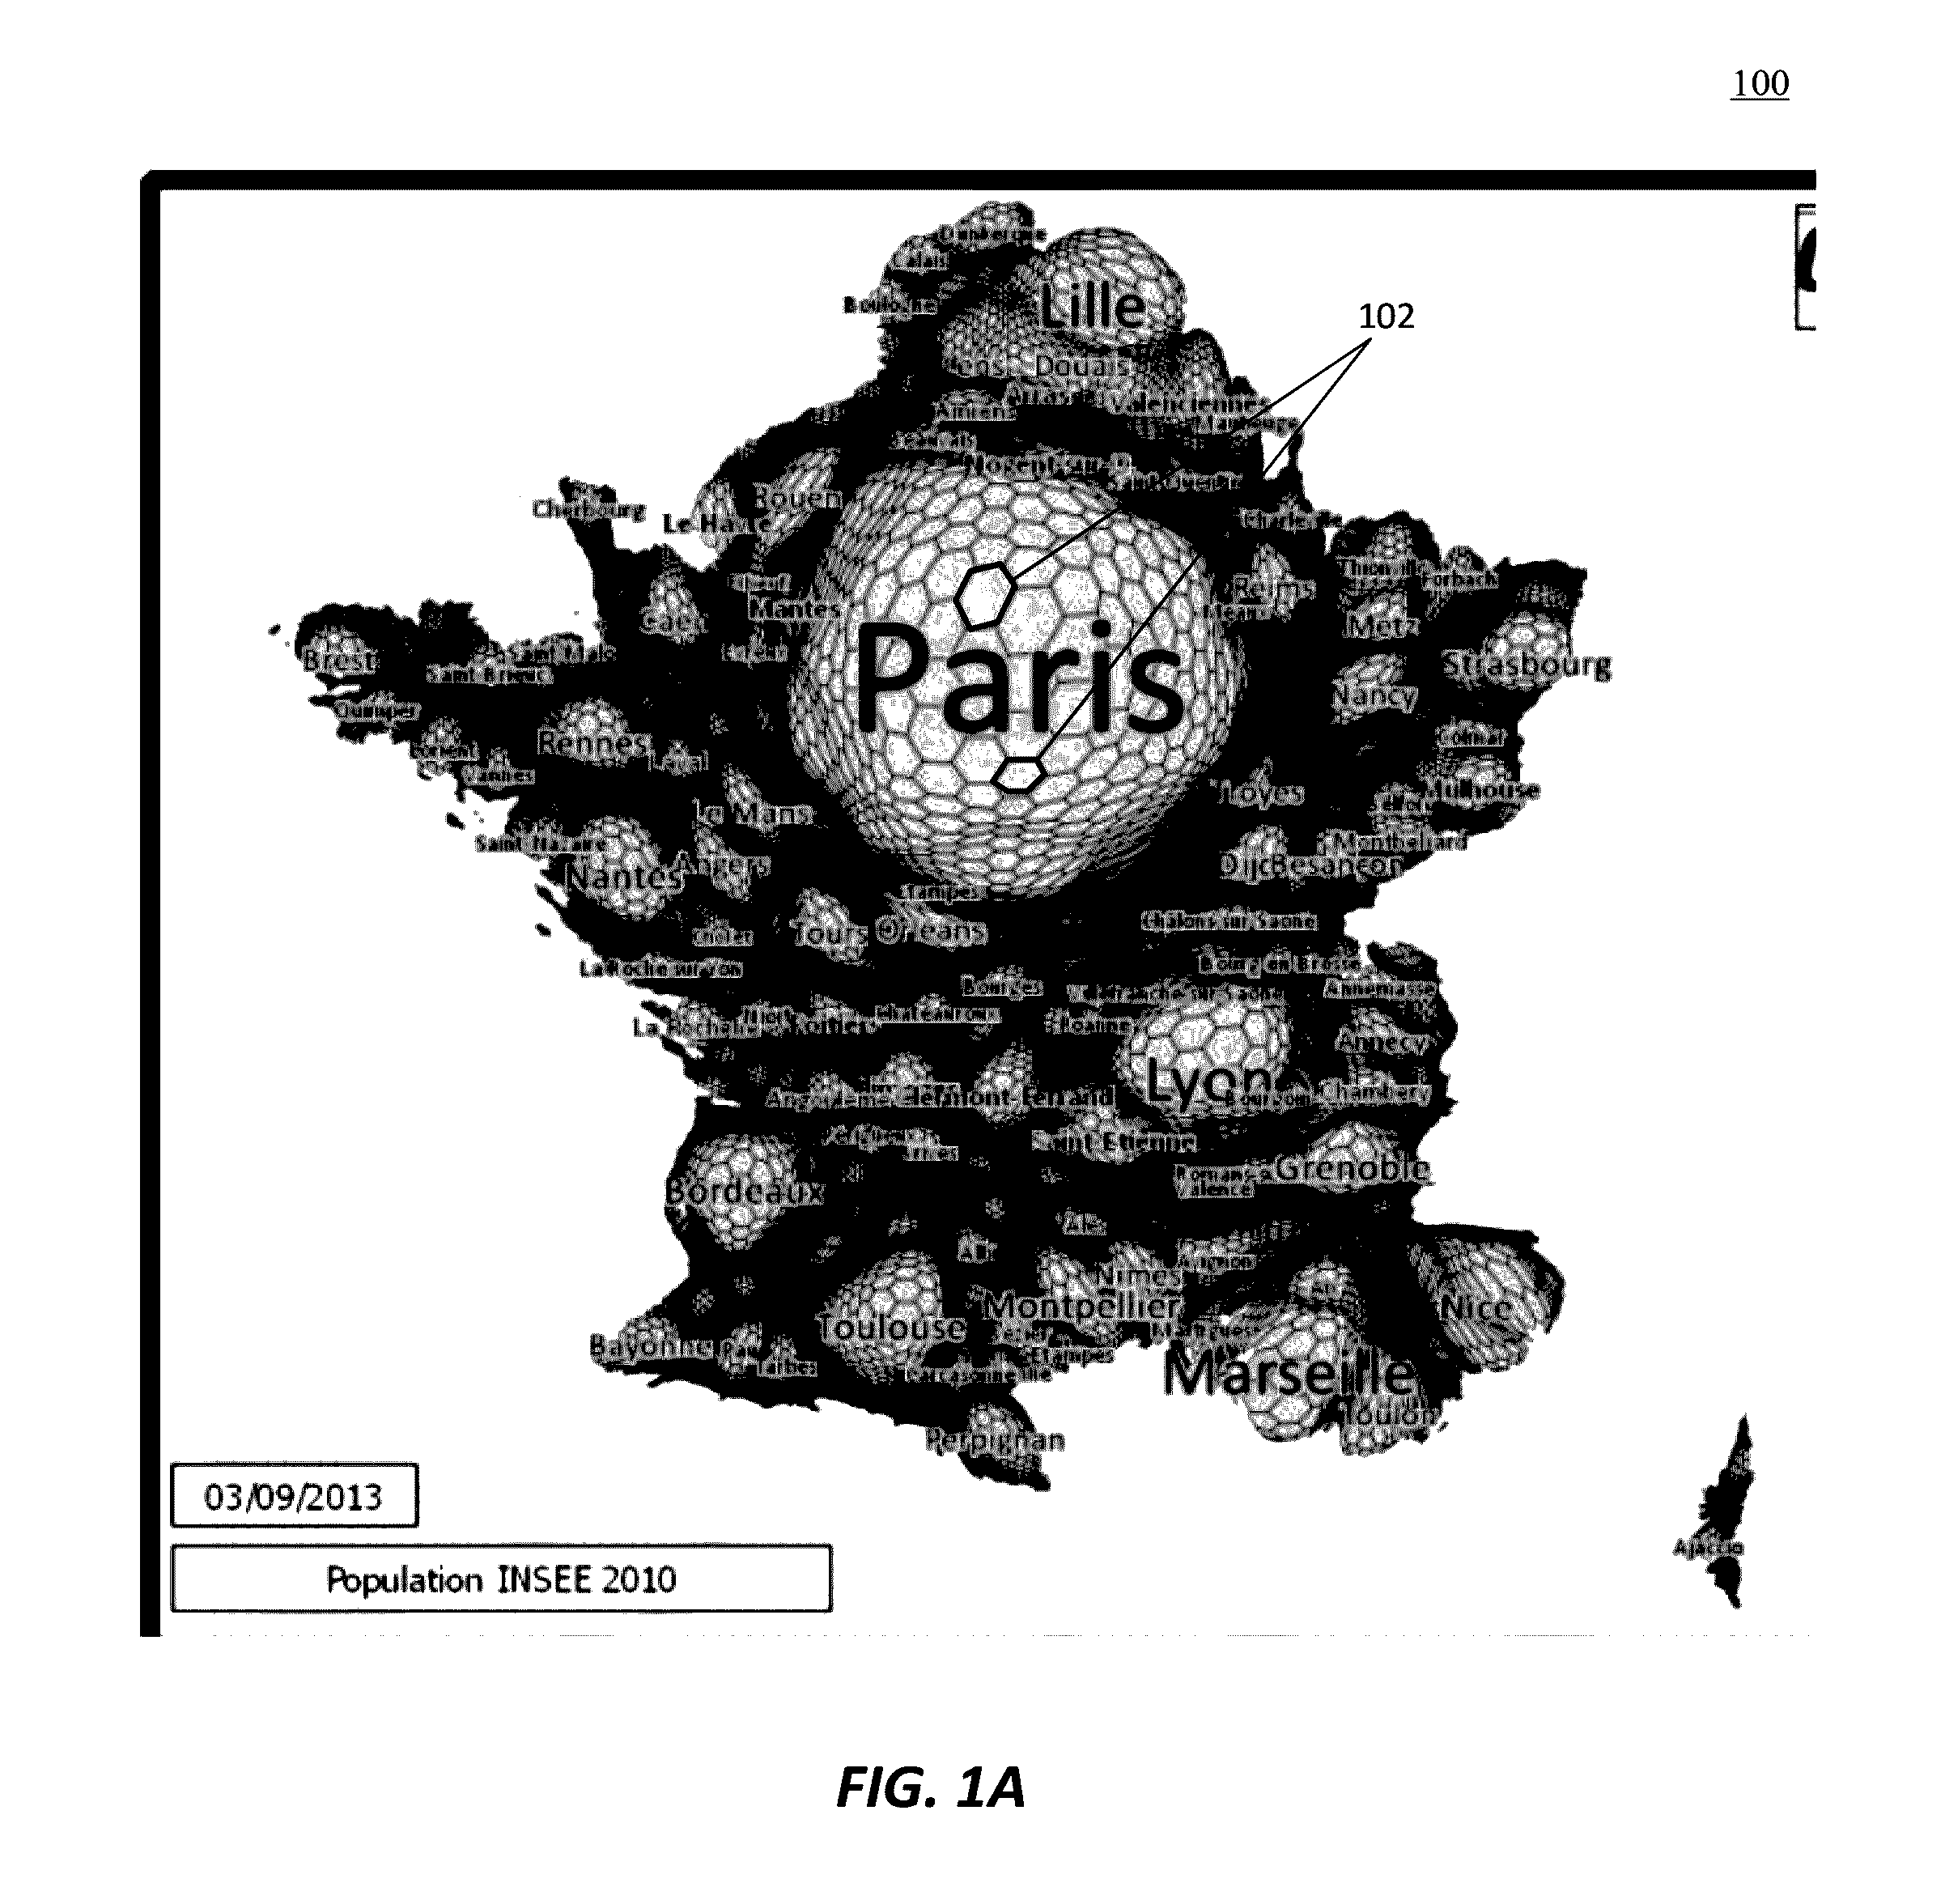
The patent describes a method for creating and distributing health indication cartograms across geographical regions with varying population density patterns and variations in the distribution of available geographical collection units. The method allows an organization to visualize epidemiological or health indication data across a geographical region with minimal distortions introduced by administrative boundaries and data distribution. The technical effect is improved visual expression and minimized distortions of health indication data with a flexible rendering across geographical regions.

Problems solved by technology

However, it may be difficult for the viewer of a choropleth map to understand certain aspects of the presented data, especially under certain conditions relating to the distribution of the demographic variable.
For example, if the demographic variable is not distributed evenly across the map, it is difficult to recognize the magnitude of the measurement and interpret the results because a large accumulation of data points could potentially be represented by a relatively small amount of space on the map.
Viewers of Euclidean choropleths may fail to recognize this, especially if they are unfamiliar with the geography and density of the geographic area.
In a contiguous cartogram, the topology between objects is maintained, but, as a group, the objects may lose their shape, giving the cartogram a “pinched” appearance, depending on the amount of distortion.
Contiguous cartograms may render the depicted geographical area unrecognizable to a viewer if there are physical geographical areas that have little or no measurement of the underlying thematic variable.
These cartogram rendering methods, however, suffer from a drawback that impairs the presentation of the underlying data.
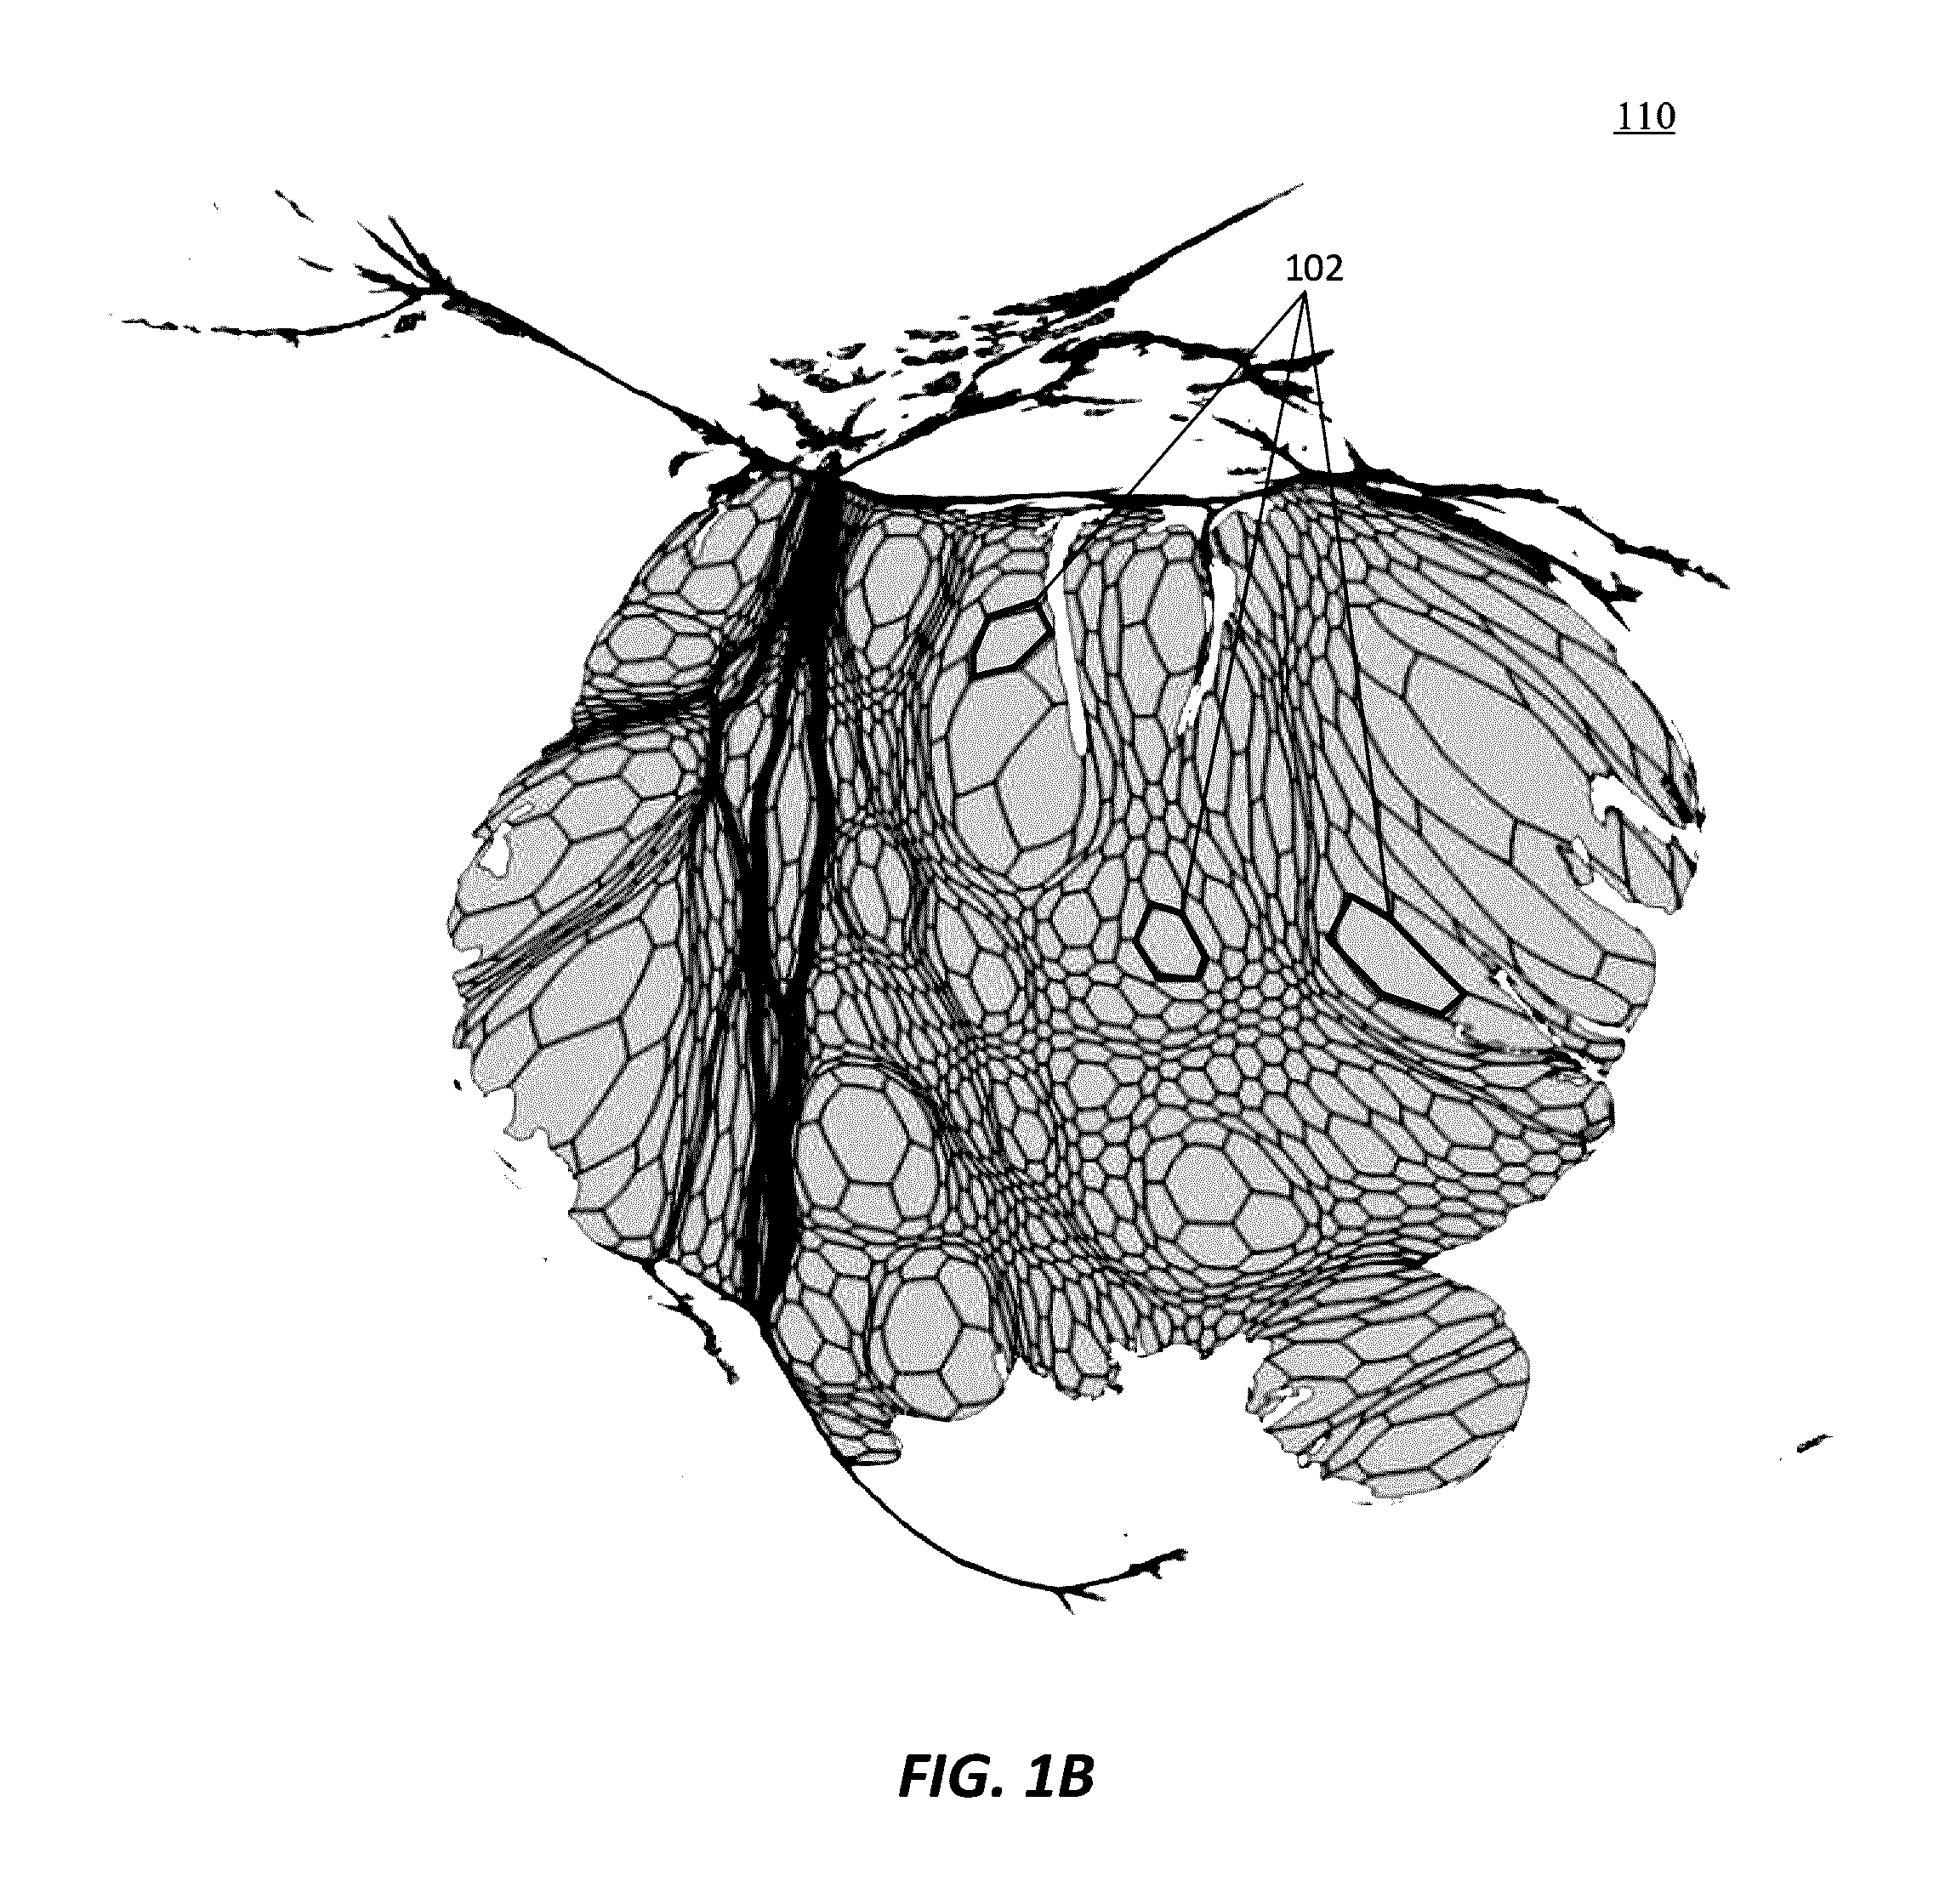
These zones may introduce abrupt transitions in the shading pattern of the map due to issues such as meshing or border effects.
Adjusting the size of zones does not provide a satisfactory solution to the problem.
On one hand, if the zones are chosen to be small units to obtain good geographical accuracy and avoid the meshing and border effects, the map will take on an inlaid effect that will make it difficult for the viewer to read and interpret.
On the other hand, if the zones are enlarged, then the map will be easy for the viewer to read, but will diminish accuracy and a reduce resolution of information conveyed to the viewer.

Method used


Image

  • Geographically smoothed demographic cartograms and cartogram server
  • Geographically smoothed demographic cartograms and cartogram server
  • Geographically smoothed demographic cartograms and cartogram server

Examples


Embodiment Construction

[0023]The present invention is described in connection with preferred embodiments. The demographic cartograms are an intuitive solution for researchers and cartographers to display data, or sets of data, associated with a geographical area. The cartograms may provide visibility into the effects of any measurable variable across a geographical area, and will assist viewers to evaluate the implications of the measured variable without interference from obfuscations typical on choropleths and cartograms including meshing and border effects by geographically smoothing the shaded data points.

[0024]In one aspect, multiple cartograms may be stacked into a chronological slideshow to animate changes of the underlying variable over time. The present embodiments recognize the value to researchers, public health officials, observers, citizens, and other interested parties to understand the changes to an underlying mapping variable over time. For instance, if the measured variable is incidence o...


PUM


Abstract

A contiguous cartogram is distorted proportionally to demographic data associated with geographical areas. The cartogram is associated with an underlying data set (such as health indication data or epidemiological data) that is geographically smoothed to avoid meshing and border effects, and shaded according to a predetermined shading scale. The cartogram may be stacked with other cartograms associated with underlying data sets collected at different times to form a chronological cartogram slideshow to illustrate changes in the underlying data set over time. The chronological cartogram slideshows may be transmitted from a map server via a communications interface to a requesting client.

Description

FIELD OF THE INVENTION[0001]The present invention relates generally to rendering visual geographical depictions of underlying statistical data, and, more particularly, to rendering demographically-based cartograms shaded to depict health or epidemiological data according to geographically smoothed data points based on the distorted distances between epidemiological or health data points on the cartogram surface rather than based on their Euclidean distances. The invention is also related to a map server for rendering and distributing cartograms including the creation and transmission of chronological series of cartograms.BACKGROUND OF THE INVENTION[0002]Cartographers often use Euclidean maps to illustrate the measurement of an underlying statistical or thematic variable across a geographical area, usually by shading the Euclidean map according to a shading scale corresponding to the measured value of the underlying variable. The shading scale is usually chosen as a progression from ...

Claims


Application Information

Patent Timeline
IPC IPC(8): G06F19/00G16Z99/00
CPCG06F19/3493G06F19/3443G09B29/007G16H50/70G16H50/80G16Z99/00G06T11/206
Inventor GUERIN, PATRICK
Owner OPENHEALTH CO
Learn More