Learning mobility user choice and demand models from public transport fare collection data

a technology for public transportation and demand models, applied in knowledge representation, instruments, computing models, etc., can solve the problems of increasing the challenge, and increasing the challenge of urban transportation,

Active Publication Date: 2016-12-15
CONDUENT BUSINESS SERVICES LLC
View PDF1 Cites 34 Cited by
  • Summary
  • Abstract
  • Description
  • Claims
  • Application Information

AI Technical Summary

Problems solved by technology

Improving the transportation of urban areas is a constant challenge for any transportation authority.
This challenge is becoming even larger within the fast growing mega cities over the world.
However development of infrastructure is costly, time consuming, and heavy work for a city.
This approach is very time consuming and expensive, and therefore, it often has the disadvantages to rely only on very partial data (only few thousands of people surveyed) or non-up-to-date data (e.g., global census of 5 years ago).
The cost / precision ratio of simulations built from these custom studies is therefore not optimal.
Currently, this collected ticketing data has been very limitedly used for understanding mobility patterns of a city.

Method used


Image

  • Learning mobility user choice and demand models from public transport fare collection data
  • Learning mobility user choice and demand models from public transport fare collection data
  • Learning mobility user choice and demand models from public transport fare collection data

Examples


Embodiment Construction

[0022]One or more embodiments will now be described with reference to the attached drawings, wherein like reference numerals are used to refer to like elements throughout. Aspects of exemplary embodiments related to systems and methods for re-ranking trips on an associated transportation network are described herein.

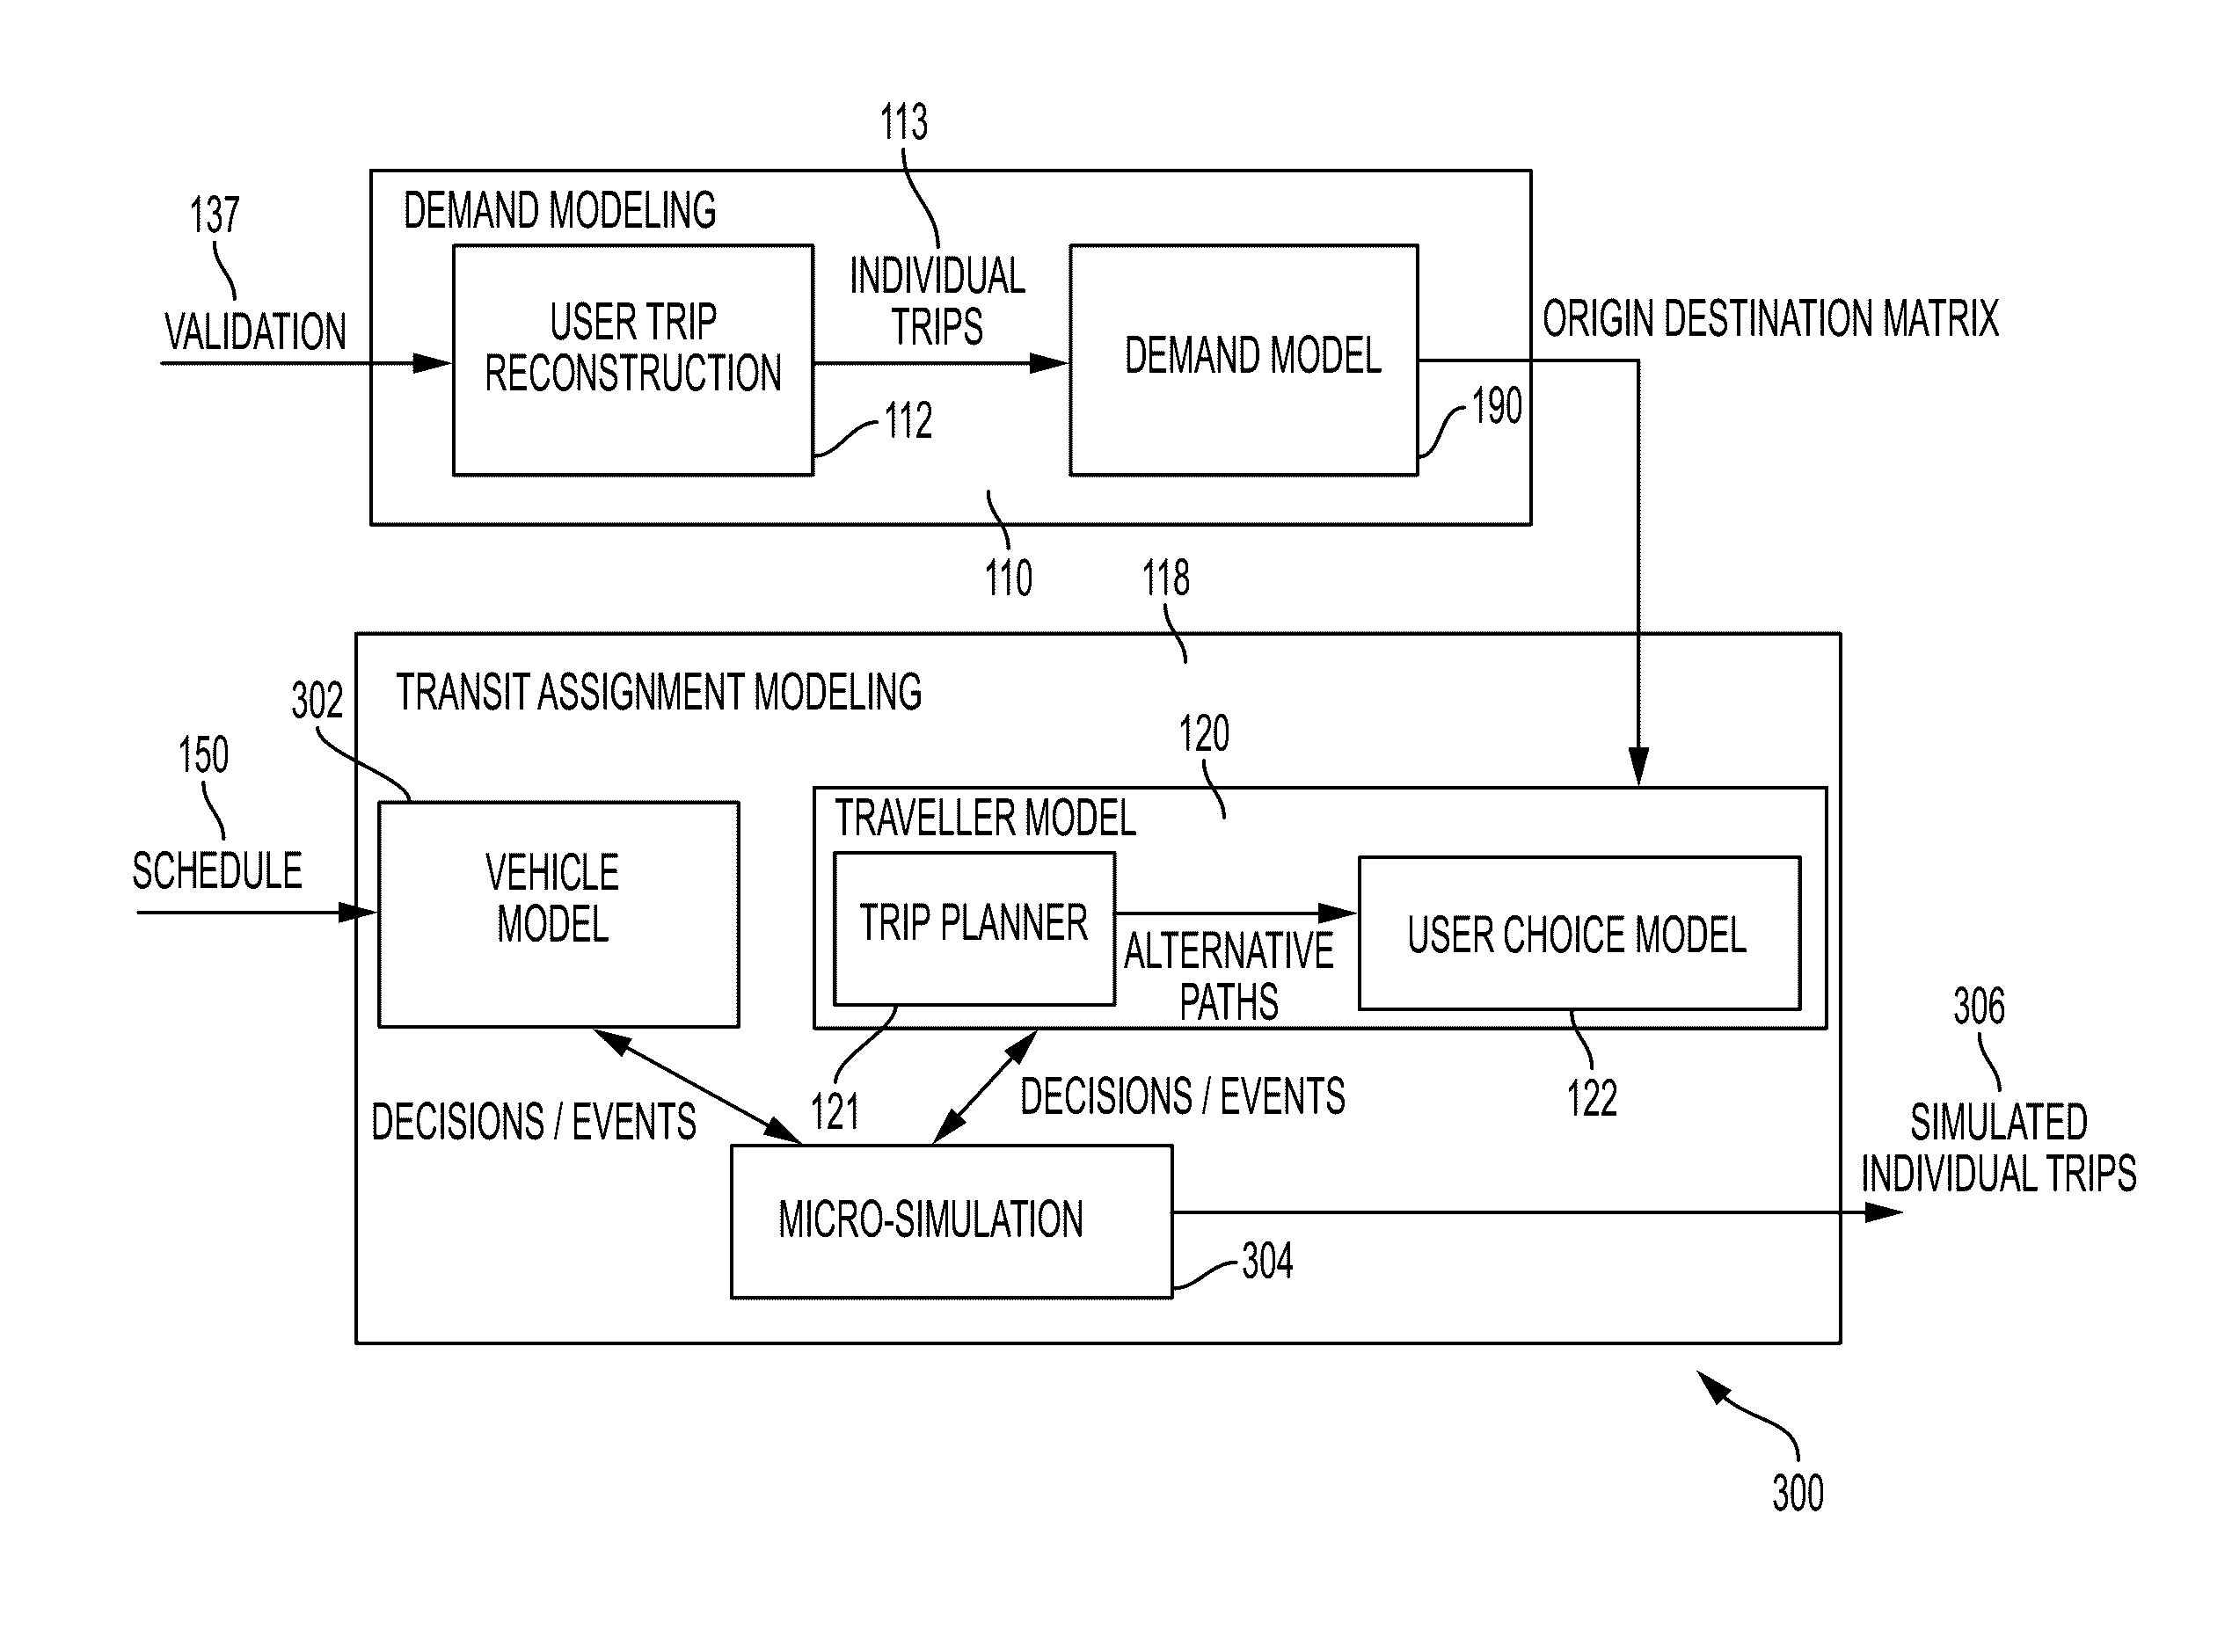
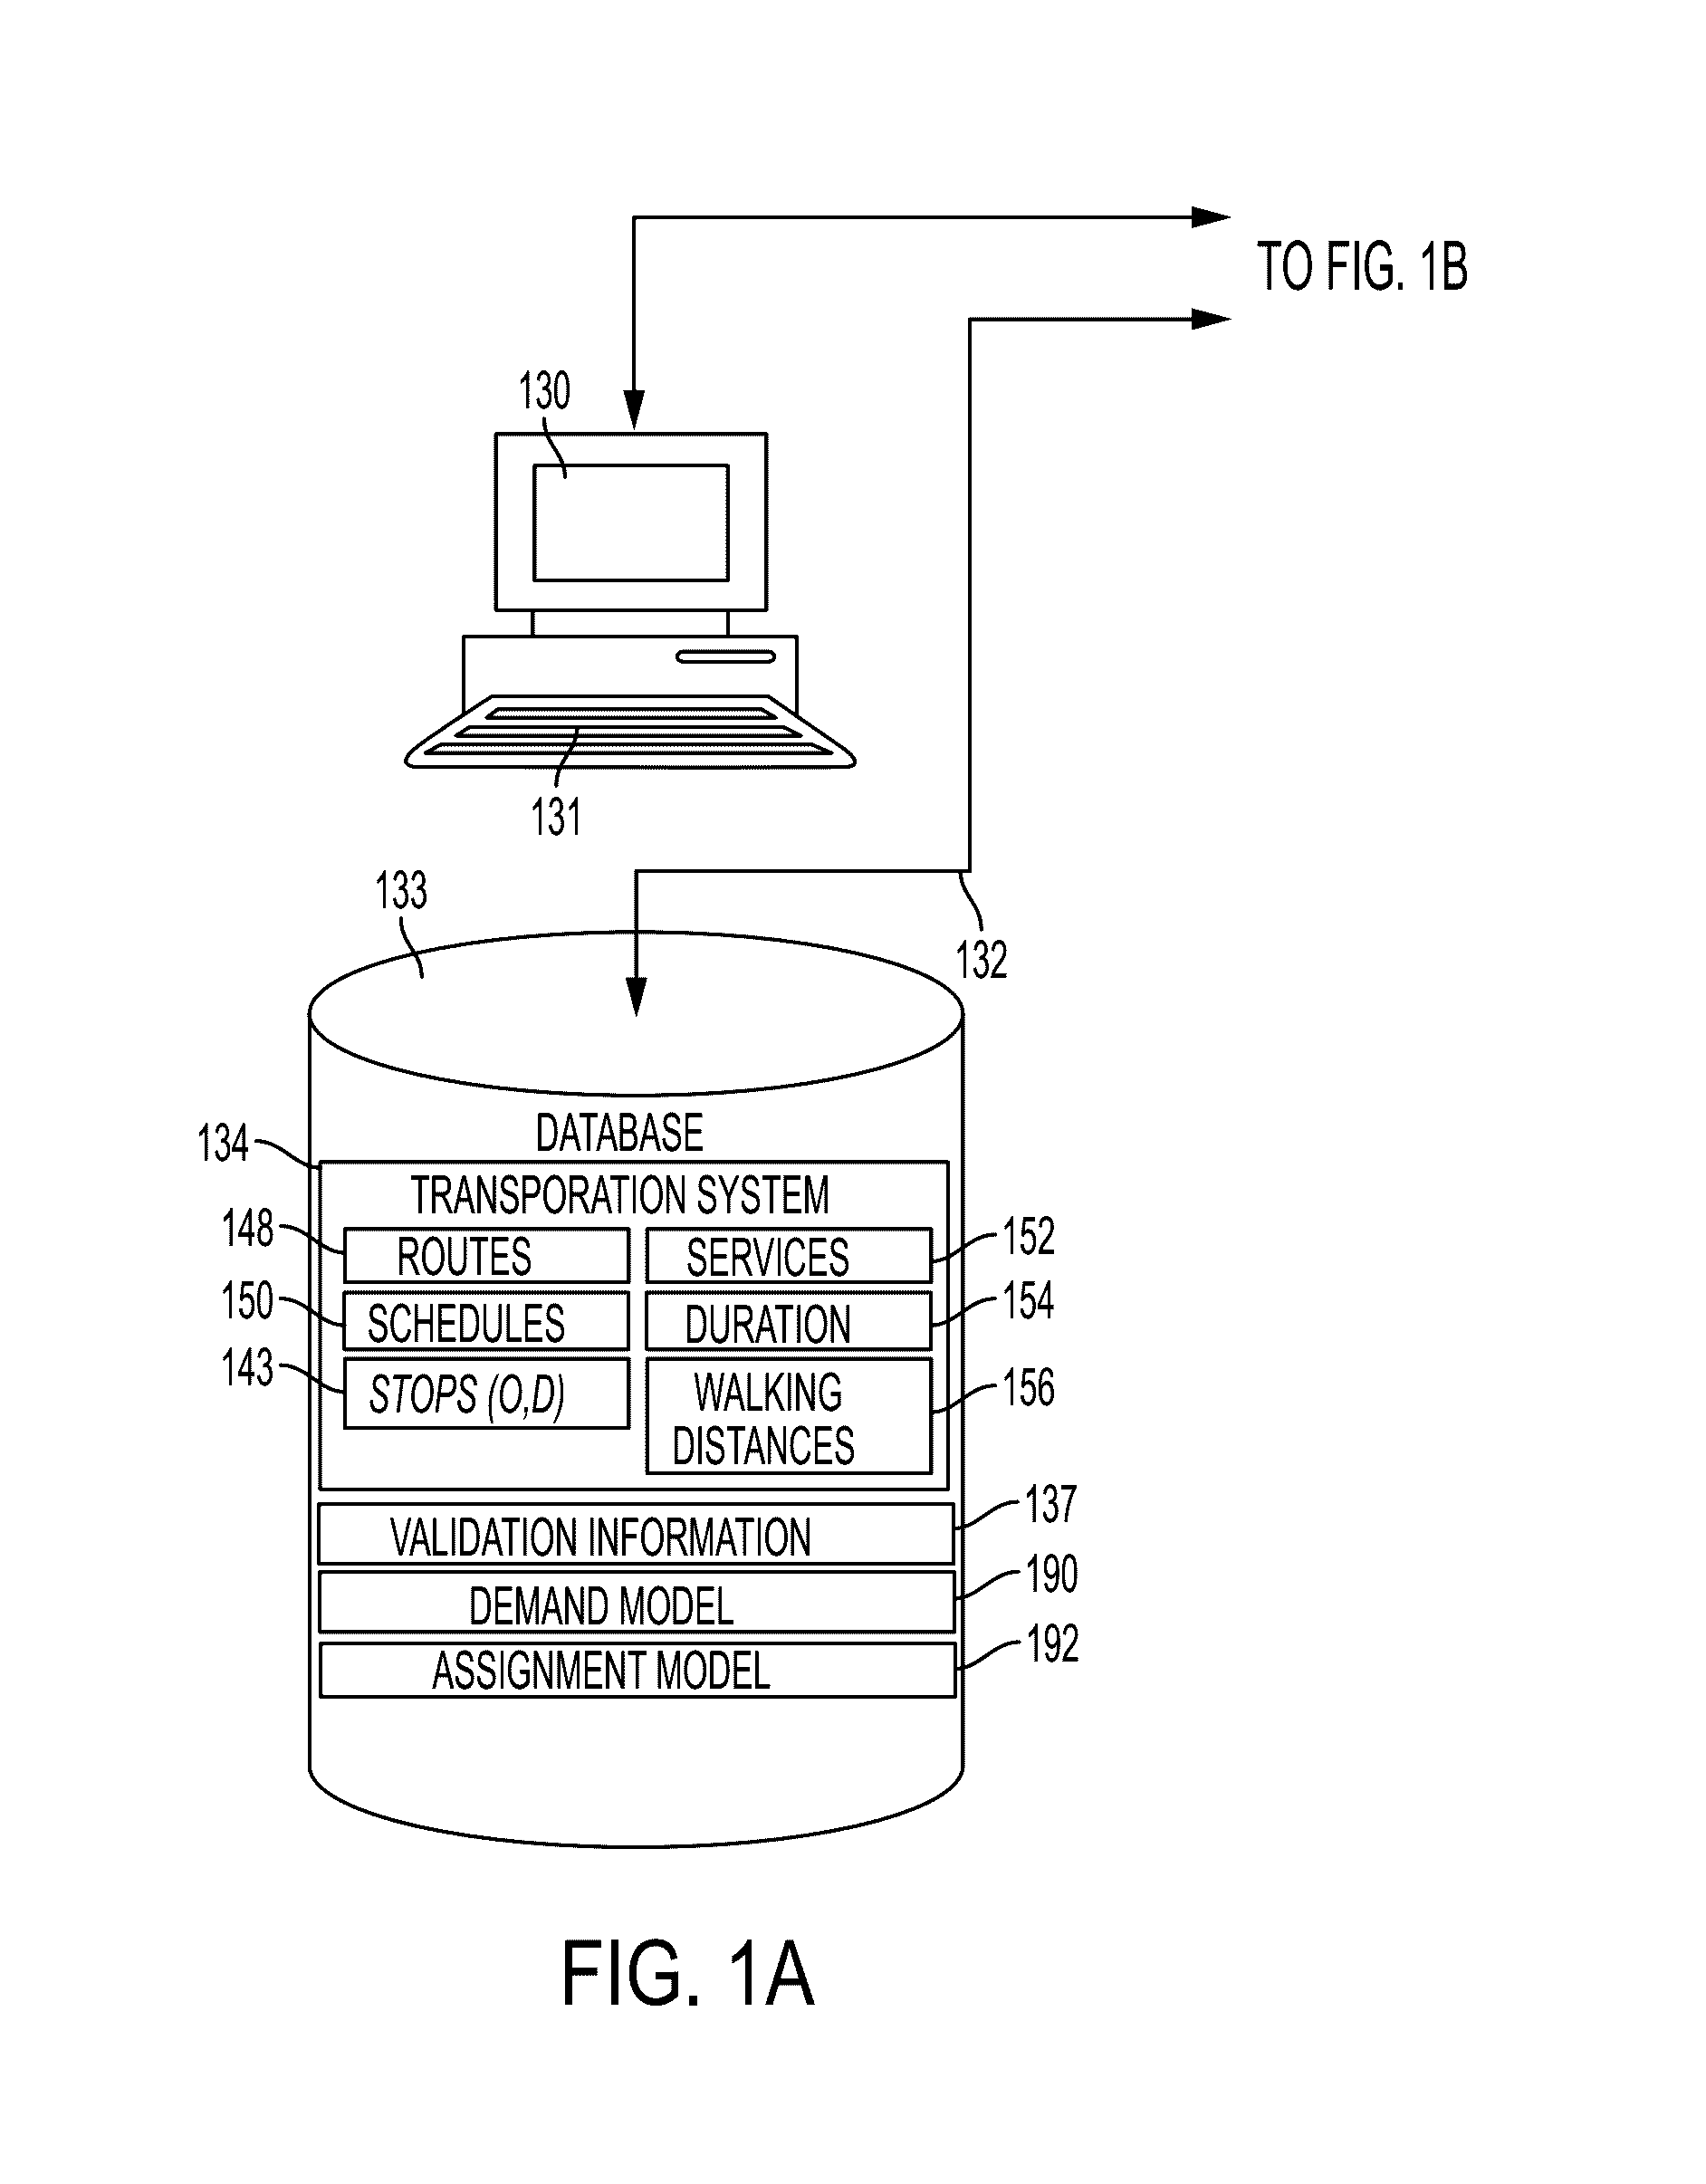
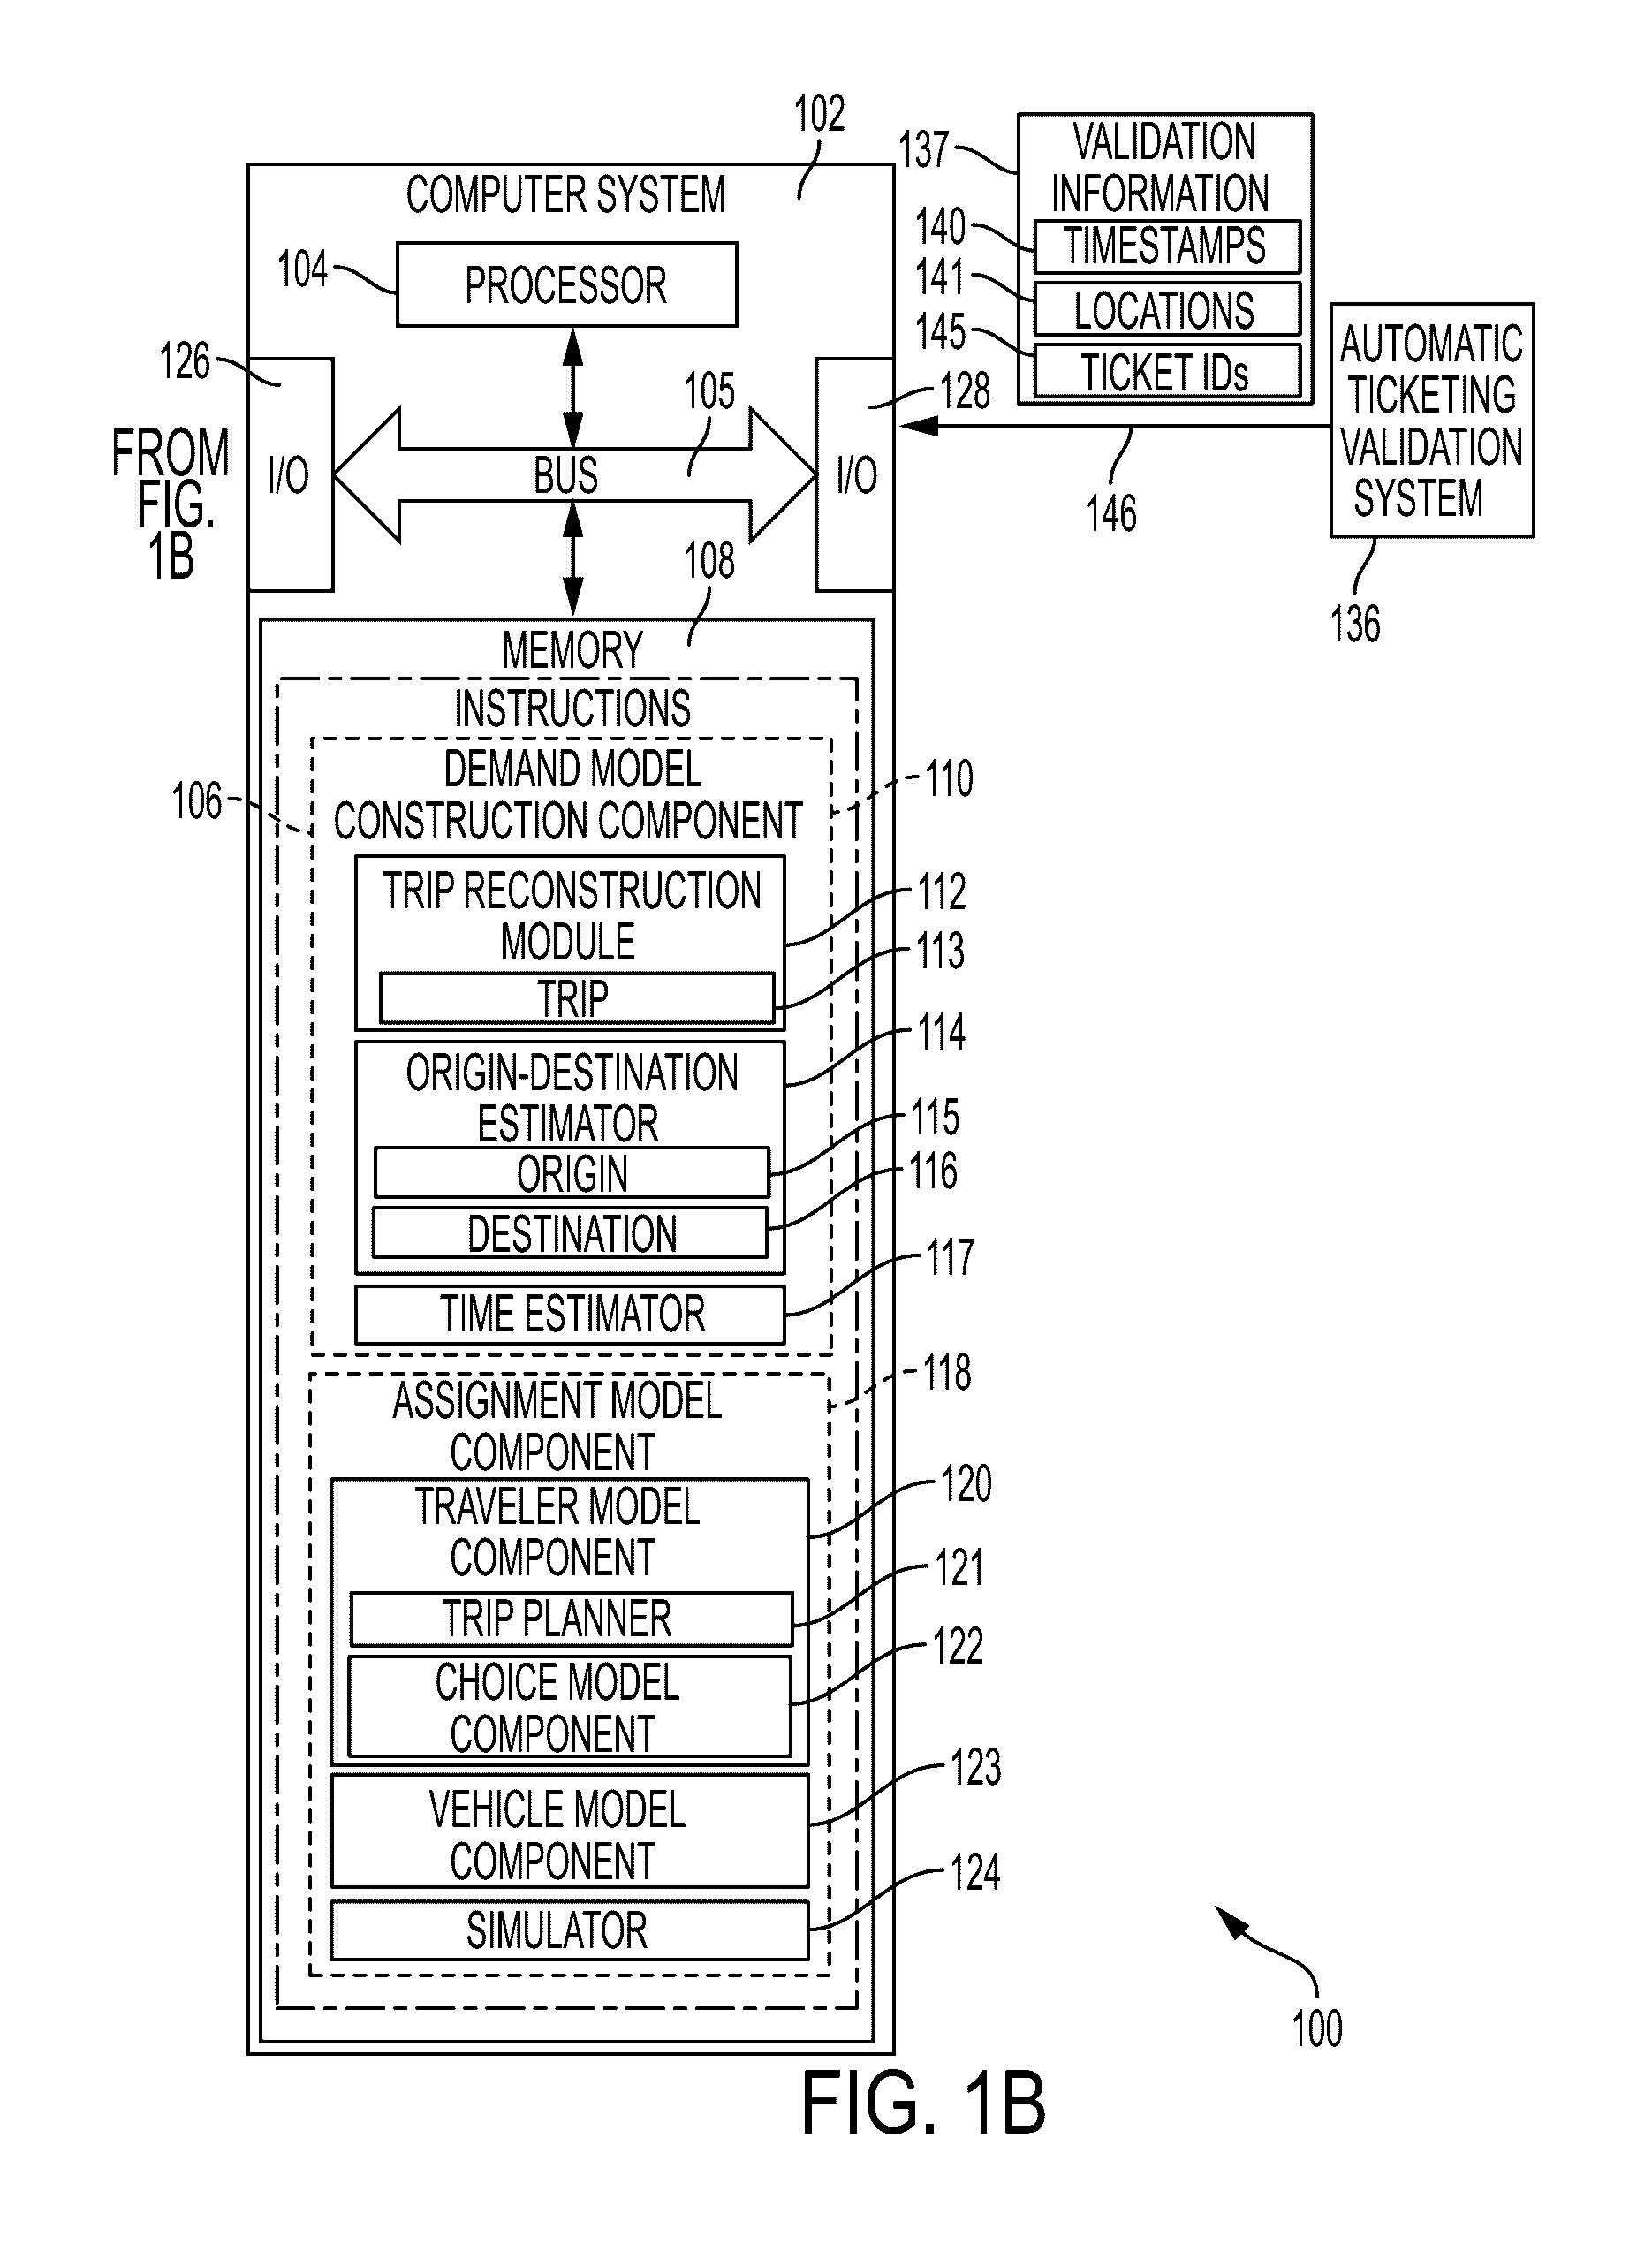
[0023]The systems and methods set forth herein utilize fare collection data, i.e., validation information 137, in order to build both the demand model and to learn optimal user choice and demand model parameters. Automatic fare collection data systems provide the full list of validations made by passengers through their use of the transportation systems. In most of the transportation systems people will validate when they enter a vehicle (check-in). Few systems will also ask to validate when they leave the vehicle (check-in / checkout). In many systems regular users will use a transportation medium such as a smart card that will provide a unique identifier of the user for ...


PUM


Abstract

A method and system are disclosed for learning a demand model and simulation parameters from validation information. Validation information is received from automatic fare collection systems and trips are reconstructed from the validation information. Origins, destinations, and arrival/departure times are estimated from the reconstructed trips. A demand model is then generated from the origins, destinations, and times. Assignment model parameters are then learned from the received validation information and demand model via iterative simulations. Infrastructure changes are made to a simulated transportation network based on the assignment and demand model using the learned parameters. A simulated response of the transportation network to the infrastructure change is then output.

Description

BACKGROUND[0001]The transportation arts, transportation system arts, the public transit infrastructure arts, the data processing arts, the data analysis arts, the transportation modeling arts, the predictive arts, and the like.[0002]Improving the transportation of urban areas is a constant challenge for any transportation authority. This challenge is becoming even larger within the fast growing mega cities over the world. These fast growing cities will have to solve the issues of traffic congestion and pollution if they want to stay attractive and continue their economic growth. Planning new infrastructure, in particular for public transit, is one important dimension where transportation authorities can act. However development of infrastructure is costly, time consuming, and heavy work for a city. Past such development required therefore a very careful study of the mobility needs and simulation of different alternatives before taking such decision.[0003]Currently, the planning of a...

Claims


Application Information

Patent Timeline
Patent Type & Authority Applications(United States)
IPC IPC(8): G06N5/02G06F17/50G06Q10/04G08G1/01G06N20/00
CPCG06N5/02G06Q10/047G06F17/5009G08G1/0129G08G1/005G08G1/0116G08G1/207G06N20/00G06F30/20
Inventor ULLOA PAREDES, LUIS RAFAELBOUCHARD, GUILLAUME M.ROULLAND, FREDERICCARDENAS, ARTURO MONDRAGON
Owner CONDUENT BUSINESS SERVICES LLC
Why Eureka
Try Eureka