
System and method for interactive visual analytics of multi-dimensional temporal data

a multi-dimensional temporal data and interactive technology, applied in the field of interactive analysis of multi-dimensional temporal data, can solve the problems of ineffective and flexible analysis systems, limited presentation of large-scale complicated data, and inability to provide intuitive analysis

Inactive Publication Date: 2017-05-04
STATE STREET CORPORATION
View PDF0 Cites 7 Cited by
  • Summary
  • Abstract
  • Description
  • Claims
  • Application Information

AI Technical Summary

Benefits of technology

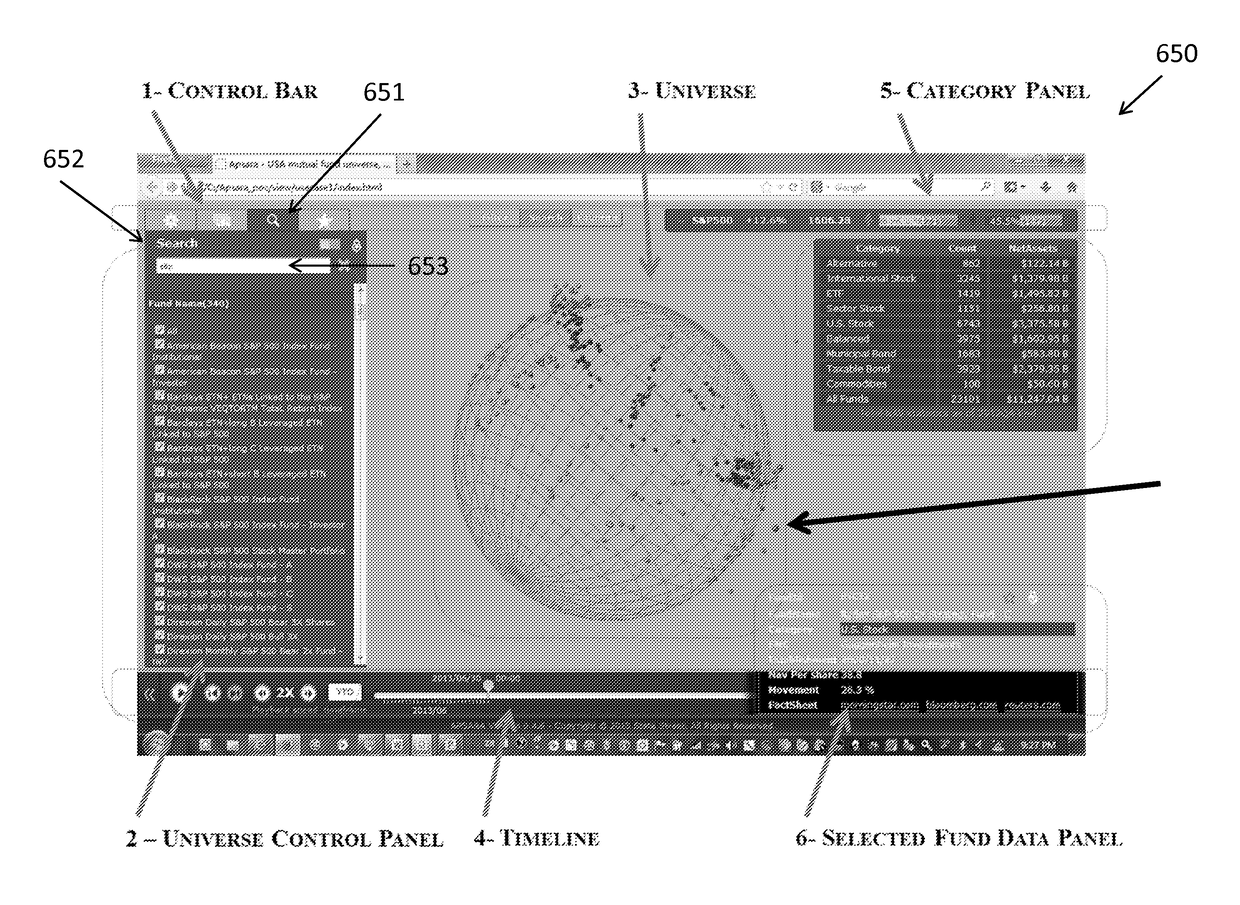
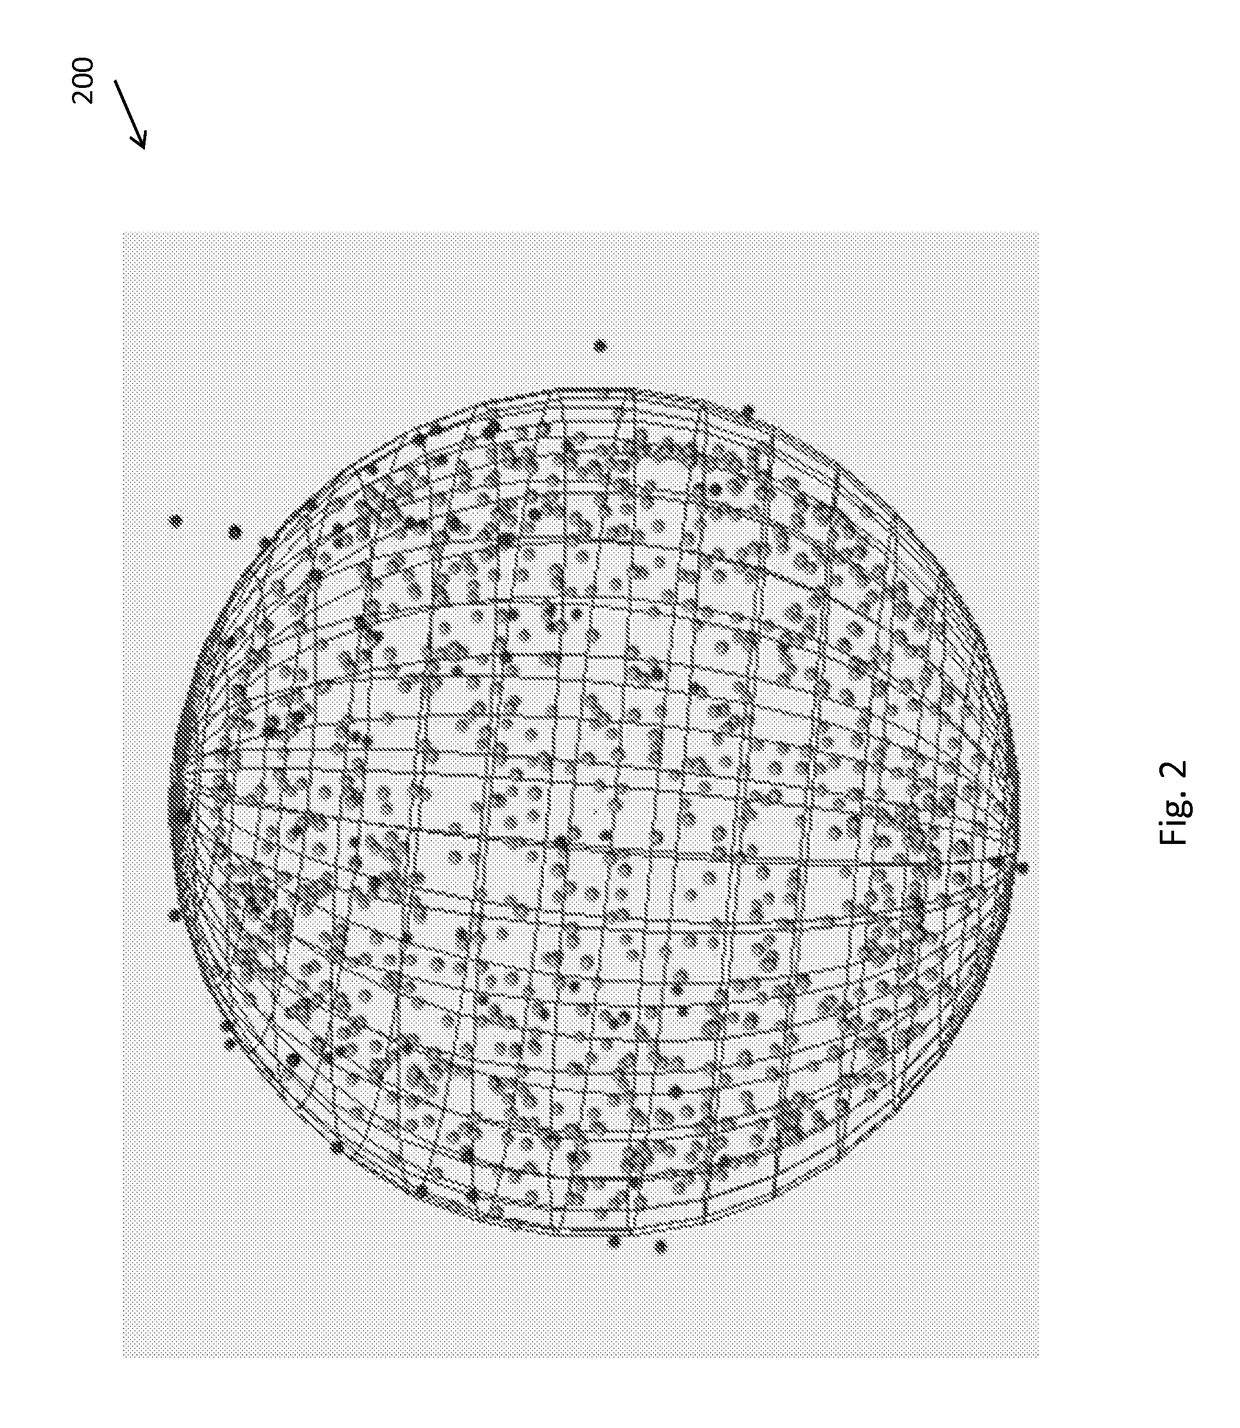
[0012]The computer-implemented visual analytics system and method of the present invention provide system users with the ability to determine the evolution of a data set with respect to a baseline standard presented as a global sphere. This global sphere may be segmented according to predetermined rules for separating the data set for disposition in segmented portions of the global sphere. The present invention may also include steps of receiving inputs from one or more data feeds, including data feeds from one or more databases, and creating and displaying on a display electronically connected to a computer a three-dimensional global sphere according to first predetermined rules for determining a radius of the global sphere. The global sphere serves as a baseline standard index by which the evolution of the data set will be measured. The present invention also may include the steps of segmenting the global sphere according to longitudinal sections to define a first criterion for locating each data point in one of the longitudinal segments and segmenting the global sphere according to latitudinal segments to define a second criterion for locating each data point in one of the latitudinal segments. As such, using the two criteria, a location for each data point with respect to the global sphere is determined. According to the present invention, time T0 may represent a time when each data point is located at a surface location on the three-dimensional global sphere that has a radius determined by first predetermined rules. Each data point is represented by a three-dimensional sphere having a radius determined by second predetermined rules and the radius of each data point will be influenced over time by at least a first performance criterion.

Problems solved by technology

Nowadays, large-scale data is growing at explosive speed everywhere.
Another typical way to handle large-scale data is on-line analytical processing (OLAP) that partially pre-aggregates data into “cubes” and stores the data in a “data warehouse.” However, traditional analysis systems do not offer an effective and flexible way to present the data or provide intuitive analysis results.
However, they have limitations when presenting large-scale complicated data.
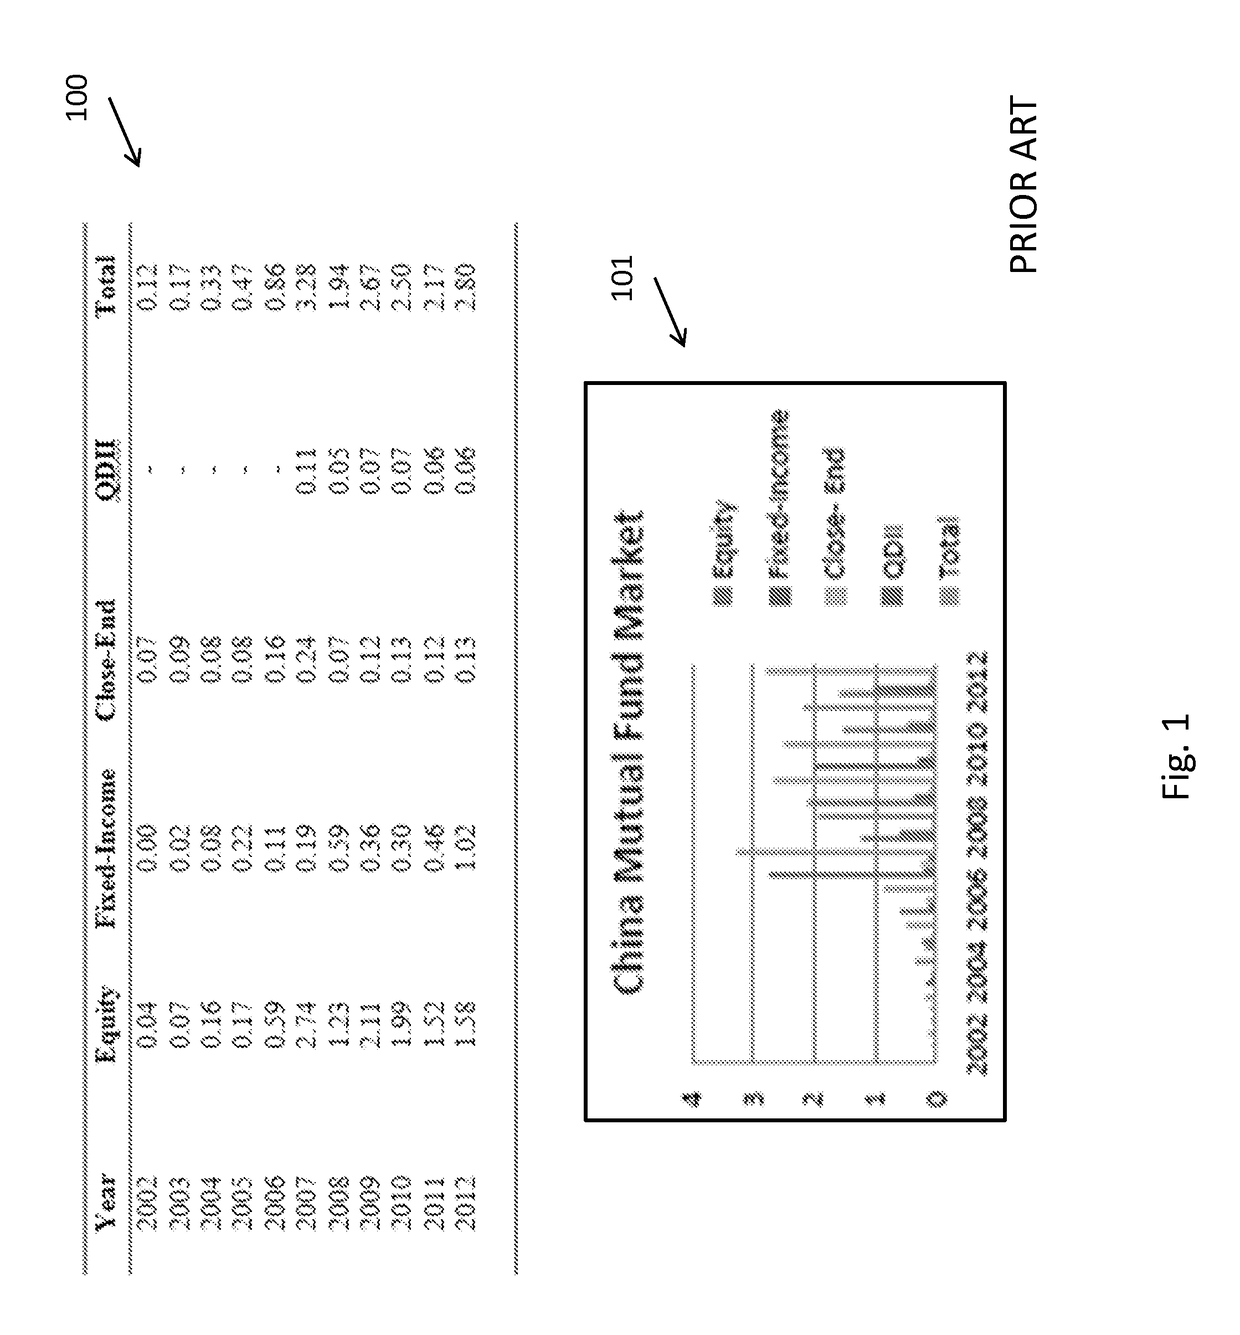
It is difficult for analysts to identify patterns and trends in the 2D table at 100, which only contains numbers in each cell.
However, the 2D bars at 101 are not suitable to display additional detailed information, for example, additional information on certain types of mutual fund.
However, these visualization methods become restrained when the underlying data model consists of complex ideas that need to be communicated with clarity, precision, and efficiency.
Large software vendors tend to focus on only a small number of “standard” visualization techniques, such as line charts and tables, which have limited capability in handling large complex data.
However, the above-described visual analytics tools provide a flat representation of voluminous data and cannot properly address multi-dimensional data.
The existing tools have difficulties depicting temporal information of data.
These conventional approaches for temporal representation include, for example, heat maps or geometries of rectangles; however, these visualizations are not intuitive and do not convey properly the temporal element of data for the system user to gain insight and trends in large complex data sets.

Method used


Image

  • System and method for interactive visual analytics of multi-dimensional temporal data
  • System and method for interactive visual analytics of multi-dimensional temporal data
  • System and method for interactive visual analytics of multi-dimensional temporal data

Examples


application examples

[0118]The discussion below presents two representative examples that involve real data from both China and US mutual fund markets. The first example shows the evolution of China's mutual fund market in year 2012 with interactive operations. The second example demonstrates the capability of the system and method of the present invention to forecast the development of China QDII.

Visualizing Mutual Fund Market

[0119]The discussion above described how mutual fund data is retrieved from different data sources. FIG. 8 presents an overview of the US mutual fund market in year 2012. The lower right corner shows the year 2012 universe of China market for comparison. After pre-processing and integrating, these real mutual fund data is applied to the system. There are 21,686 funds from USA and 869 funds from China. While USA has far more funds than China, the difference in the depicted earth radius, when the radius represents the average NAV, is small because it is adjusted by the equation desc...


PUM


Abstract

Multi-dimensional temporal data can provide insight into patterns, trends and correlations. Traditional 2D-charts are widely used to support domain analysts' work, but are limited to present large-scale complicated data intuitively and do not allow further exploration to gain insight. A visual analytics system and method which supports interactive analysis of multi-dimensional temporal data, incorporating the idea of a novel visualization method is provided. The system extends the ability of mapping techniques by visualizing domain data based on a 3D geometry enhanced by color, motion and sound. It allows a compact universal overview of large-scale data and drilling down for further exploration. By customizable visualization, it can be adapted to different data models and applied to multiple domains. It helps analysts interact directly with large-scale data, gain insight into the data, and make better decisions.

Description

FIELD OF THE INVENTION[0001]The present invention relates to computer-based system and method for interactive analysis of multi-dimensional temporal data, and more specifically to computer-based system and method for three-dimensional visualizations of large-scale data.BACKGROUND OF THE INVENTION[0002]Multi-dimensional and temporal data are very common in many business and scientific domains. Nowadays, large-scale data is growing at explosive speed everywhere. While the capacity to collect and store new data grows rapidly, the ability to analyze these data volumes has been increasing at much lower rates. Although it is not easy to analyze large-scale complex data, it is useful to gain insight into patterns, trends and correlations. This means there is greater potential value in large-scale complex data.[0003]In the past, researchers have proposed many automatic analysis methods to process and simplify these data, such as Principle Component Analysis, Self-Organizing Map and clusteri...

Claims


Application Information

Patent Timeline
Patent Type & Authority Applications(United States)
IPC IPC(8): G06F3/0481
CPCG06F3/04815G06Q40/04
Inventor CRISTOFORO, ALBERT JERRY
Owner STATE STREET CORPORATION
Learn More