Machine implemented methods, systems, and apparatuses for improving diagnostic performance

a technology of diagnostic performance and implemented methods, applied in diagnostic recording/measuring, instruments, ultrasonic/sonic/infrasonic image/data processing, etc., can solve the problems of false negatives having major consequences for patient mortality, low biopsy yield, unnecessary trauma, etc., and achieve the effect of improving diagnostic performan

Active Publication Date: 2017-05-18
THE TRUSTEES OF THE UNIV OF PENNSYLVANIA
View PDF10 Cites 10 Cited by
  • Summary
  • Abstract
  • Description
  • Claims
  • Application Information

AI Technical Summary

Benefits of technology

[0005]Aspects of the invention relate to methods, systems and apparatuses implementing machine apparatuses for improving diagnostic performance.

Problems solved by technology

Despite advances in both breast imaging technology and image analysis, the biopsy yield continues to be low and as many as 70% to 85% of biopsies prove to be benign.
One of the main reasons for such low yield is that the false negatives have major consequences related to patient mortality.
The cost of this low yield results in unnecessary trauma experienced by patients (having masses biopsied which are ultimately determined to be benign) and the financial burden imposed by a large number of unneeded procedures.

Method used


Image

  • Machine implemented methods, systems, and apparatuses for improving diagnostic performance
  • Machine implemented methods, systems, and apparatuses for improving diagnostic performance
  • Machine implemented methods, systems, and apparatuses for improving diagnostic performance

Examples


example 1

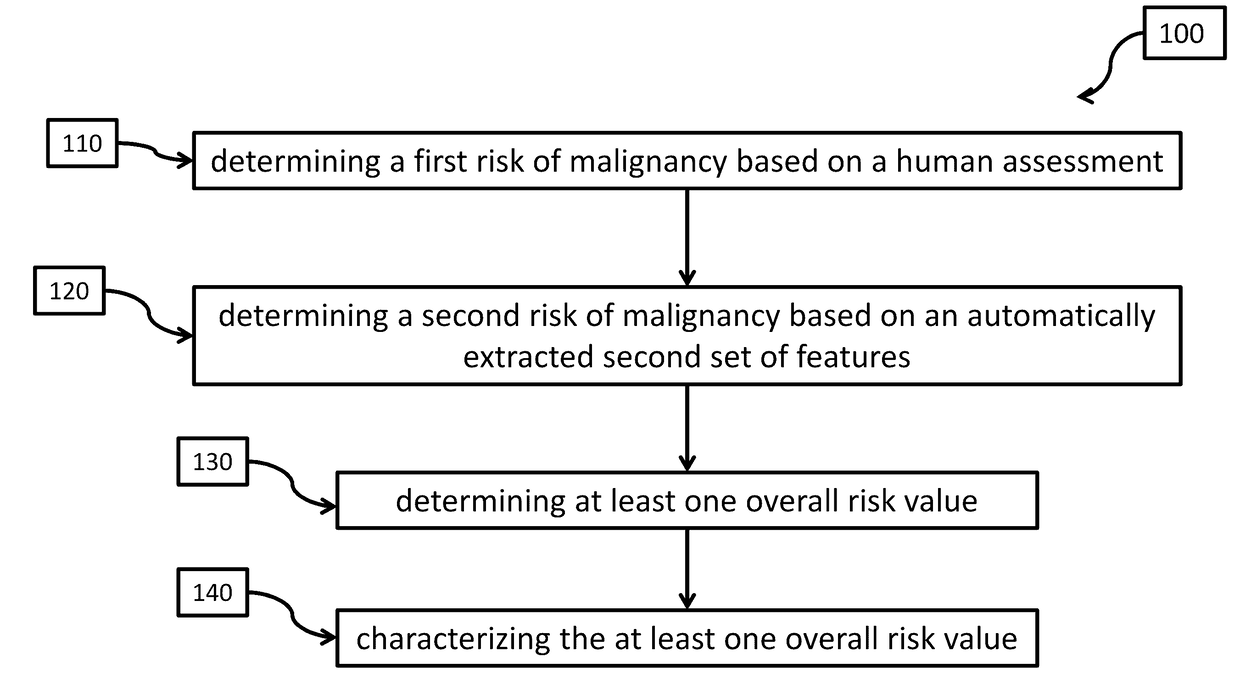
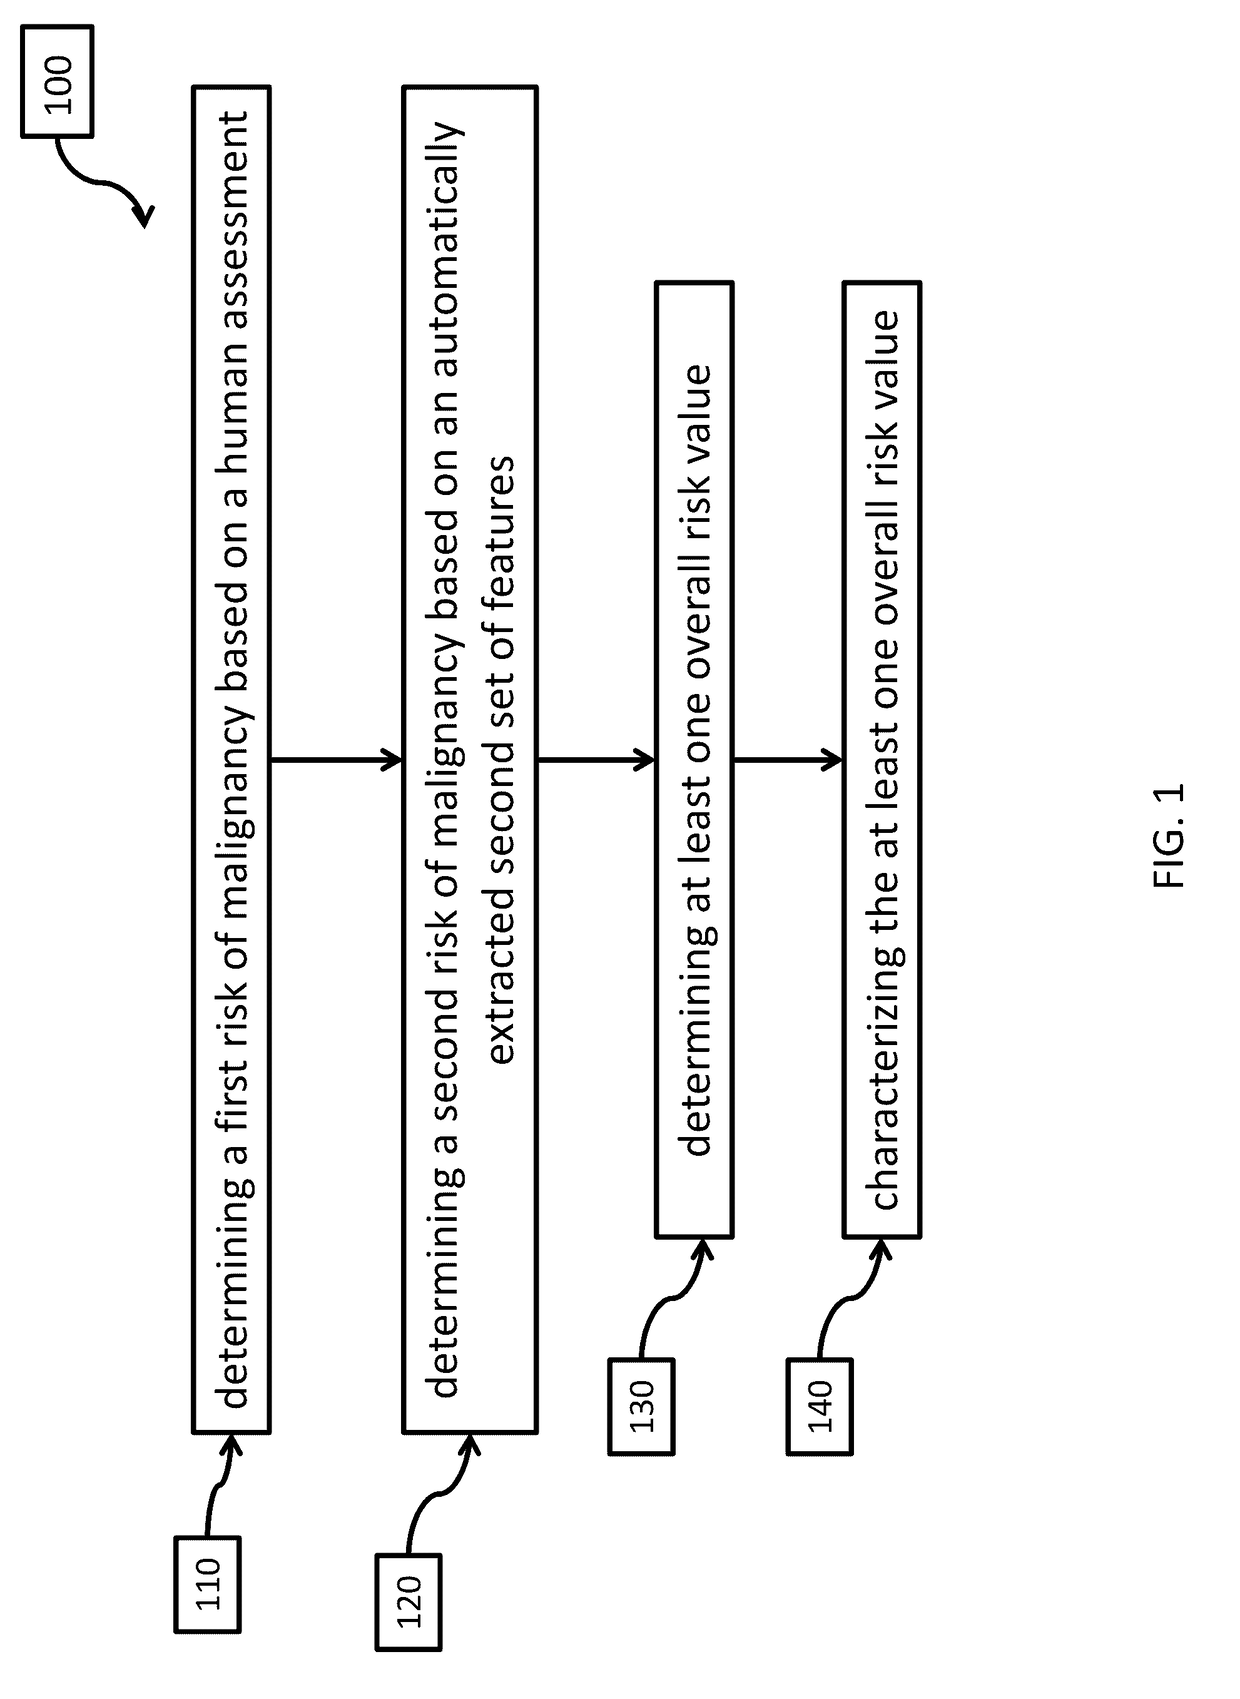
[0043]FIG. 12 generally depicts the method employed in this example. Two independent sets of features were extracted and classified from each image in the library of breast ultrasound images, one set being extracted by a radiologist's interpretation of ultrasound BIRADS (BI-RADSus) and one set of features extracted by way of a computer from the images (FIG. 12, step a). The radiologist's interpretations of ultrasound images (BI-RADSus) could be combined with the computer-identified features using adaptive boosting or a consensus method, described below (FIG. 12, step b). This process was implemented to expand the discriminatory region of each feature set by incorporating the strengths of each set of features. Despite combining the regions of strength of each of the two independent feature sets some assessments remained characterized as being a low confidence assessment. These low confident assessments were removed from the dataset for further evaluation by additional imaging (FIG. 1...

example 2

[0076]For illustrative purposes, suppose that there are 200 assessments with 100 benign and 100 malignant and that the distribution of malignant and benign assessments is the same in the sub-sample of assessments characterized as low confidence. Thus, at a 20% drop rate there will be 80 assessments apiece of malignant and benign assessments in the retained subpopulation of 160 high confidence assessments and 20 assessments apiece of malignant and benign assessments in the low confidence subpopulation of 40 assessments (presumed to all be sent for a biopsy). In the high confidence group, if we operate at 80% specificity we obtain a sensitivity (true positive fraction) of 98% from the middle curve of FIG. 7 leading to 2 missed malignant assessments (rounded up from 1.6) out of the total of 80 in this group. This is the regrettable false negative rate at this level of specificity. At an operational point of 80% specificity, 16 of the 80 benign assessments in the high confidence group a...


PUM


Abstract

A method for ultrasound diagnosis includes determining a first risk of malignancy based on a human assessment of a first set of features of one or more ultrasound images of a target; determining a second risk of malignancy based on an automatically extracted second set of features of the one or more ultrasound images; determining at least one overall risk value based on the first risk of malignancy and the second risk of malignancy; and characterizing the at least one overall risk value as one of a high confidence assessment or a low confidence assessment.

Description

CROSS-REFERENCE TO RELATED APPLICATION[0001]This application claims the benefit of U.S. Provisional Application No. 62 / 253,314, filed Nov. 10, 2015, the contents of which are incorporated herein by reference in their entireties for all purposes.STATEMENT REGARDING FEDERALLY SPONSORED RESEARCH[0002]This invention was made with government support under RO1CA130946 awarded by the National Institutes of Health. The government has certain rights in the invention.FIELD OF THE INVENTION[0003]This disclosure relates to machine implemented methods for improving diagnostic performance as well as systems and apparatuses using the same.BACKGROUND OF THE INVENTION[0004]There is an ongoing effort in improving breast ultrasound for differentiating solid malignant and benign masses. Despite advances in both breast imaging technology and image analysis, the biopsy yield continues to be low and as many as 70% to 85% of biopsies prove to be benign. One of the main reasons for such low yield is that th...

Claims


Application Information

Patent Timeline
Patent Type & Authority Applications(United States)
IPC IPC(8): G06F19/00A61B8/08A61B5/00G16H30/20G16H50/20
CPCG06F19/3431G06F19/321A61B8/0825A61B8/085A61B8/5223A61B5/7275A61B5/4312G16H50/30G16H30/20G16H50/20
Inventor SEHGAL, CHANDRA M.VENKATESH, SANTOSH S.SULTAN, LAITH R.
Owner THE TRUSTEES OF THE UNIV OF PENNSYLVANIA
Why Eureka
Try Eureka