System and a method for assessing patient treatment risk using open data and clinician input

Active Publication Date: 2017-09-28
FUJITSU LTD
13 Cites 13 Cited by

AI-Extracted Technical Summary

Problems solved by technology

As the patient gets older these factors contribute to the development of several health risks that could threat his/her quality of l...

Method used

[0106]Once we have the outputs of the individual predictors, a meta predictor component combines the individual predictors in order to offer better predicting performance and to see which terms (nodes) to retain in the patient subgraph. To weight this combination, the component adjusts weigh...

Benefits of technology

[0010]The patient risk graph provides specific information for a patient, in a way that is easily comprehensible and can help a clinician or other user to foresee risks based not only on the patient's own data, but also on freely available databases, The impact estimator m...

Abstract

A system including a healthcare risk engine to provide a healthcare risk knowledge graph from open data and knowledge data related to risk by using risk-related terms to retrieve documents from open data and by extracting the healthcare risk knowledge graph as entities from the documents and links between the entities. A patient risk graph predictor predicts risks for a patient by combining information in a Patient Clinical Object (PCO) with entities in the healthcare risk knowledge graph to produce a patient risk graph. An impact estimator estimates an impact of a treatment by taking the treatment and adjacent nodes from the healthcare risk knowledge graph to form a healthcare treatment subgraph, finding an entity and adjacent nodes in the patient risk graph to form a patient treatment subgraph, providing an impact graph by combining the patient treatment subgraph and the healthcare treatment subgraph, and retaining resultant linked nodes.

Application Domain

Health-index calculationSpecial data processing applications +2

Technology Topic

Document preparationPatient treatment +10

Image

  • System and a method for assessing patient treatment risk using open data and clinician input
  • System and a method for assessing patient treatment risk using open data and clinician input
  • System and a method for assessing patient treatment risk using open data and clinician input

Examples

  • Experimental program(1)

Example

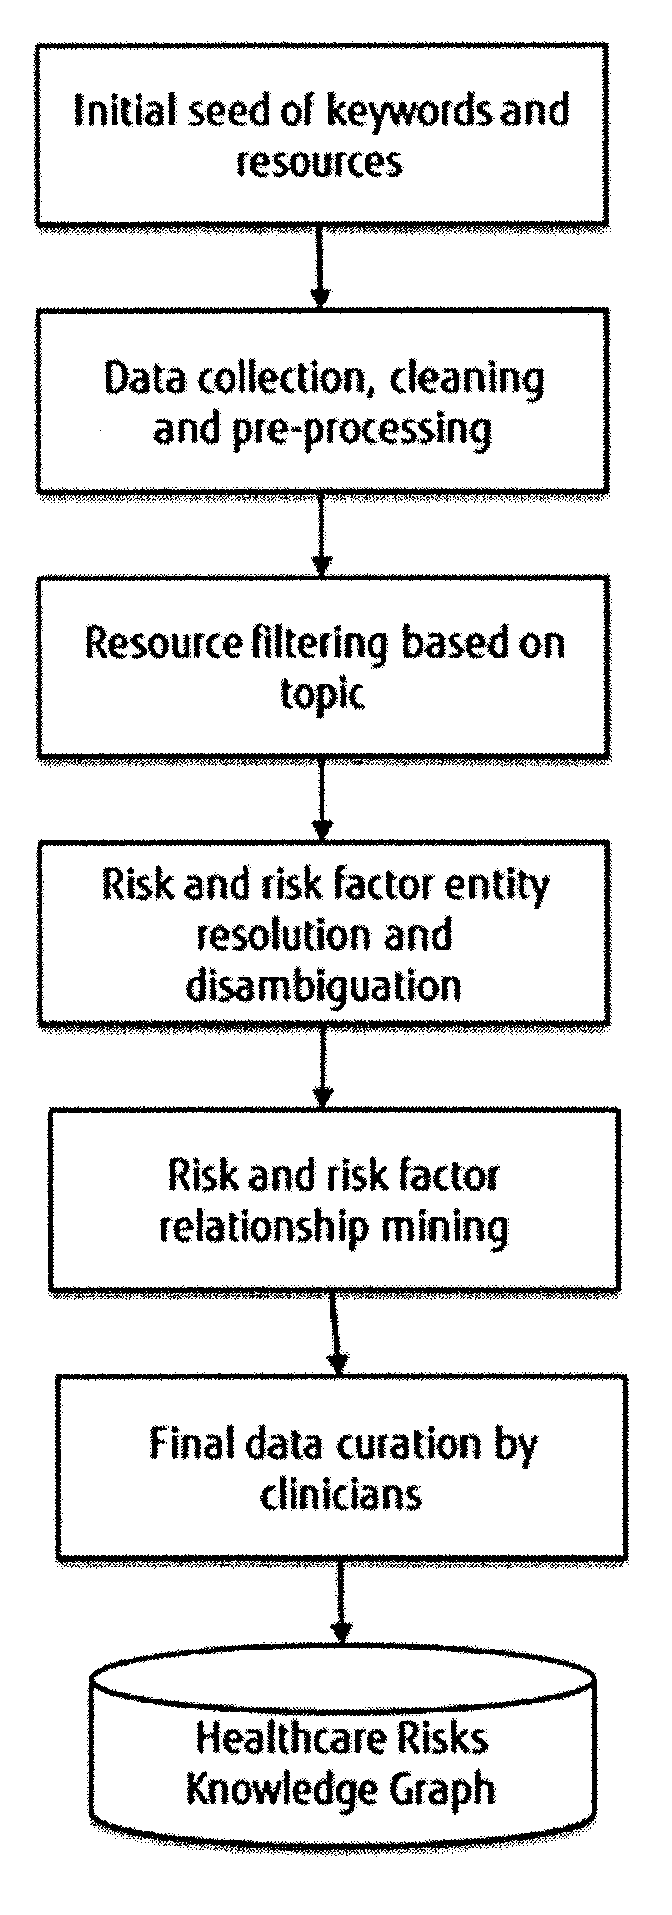
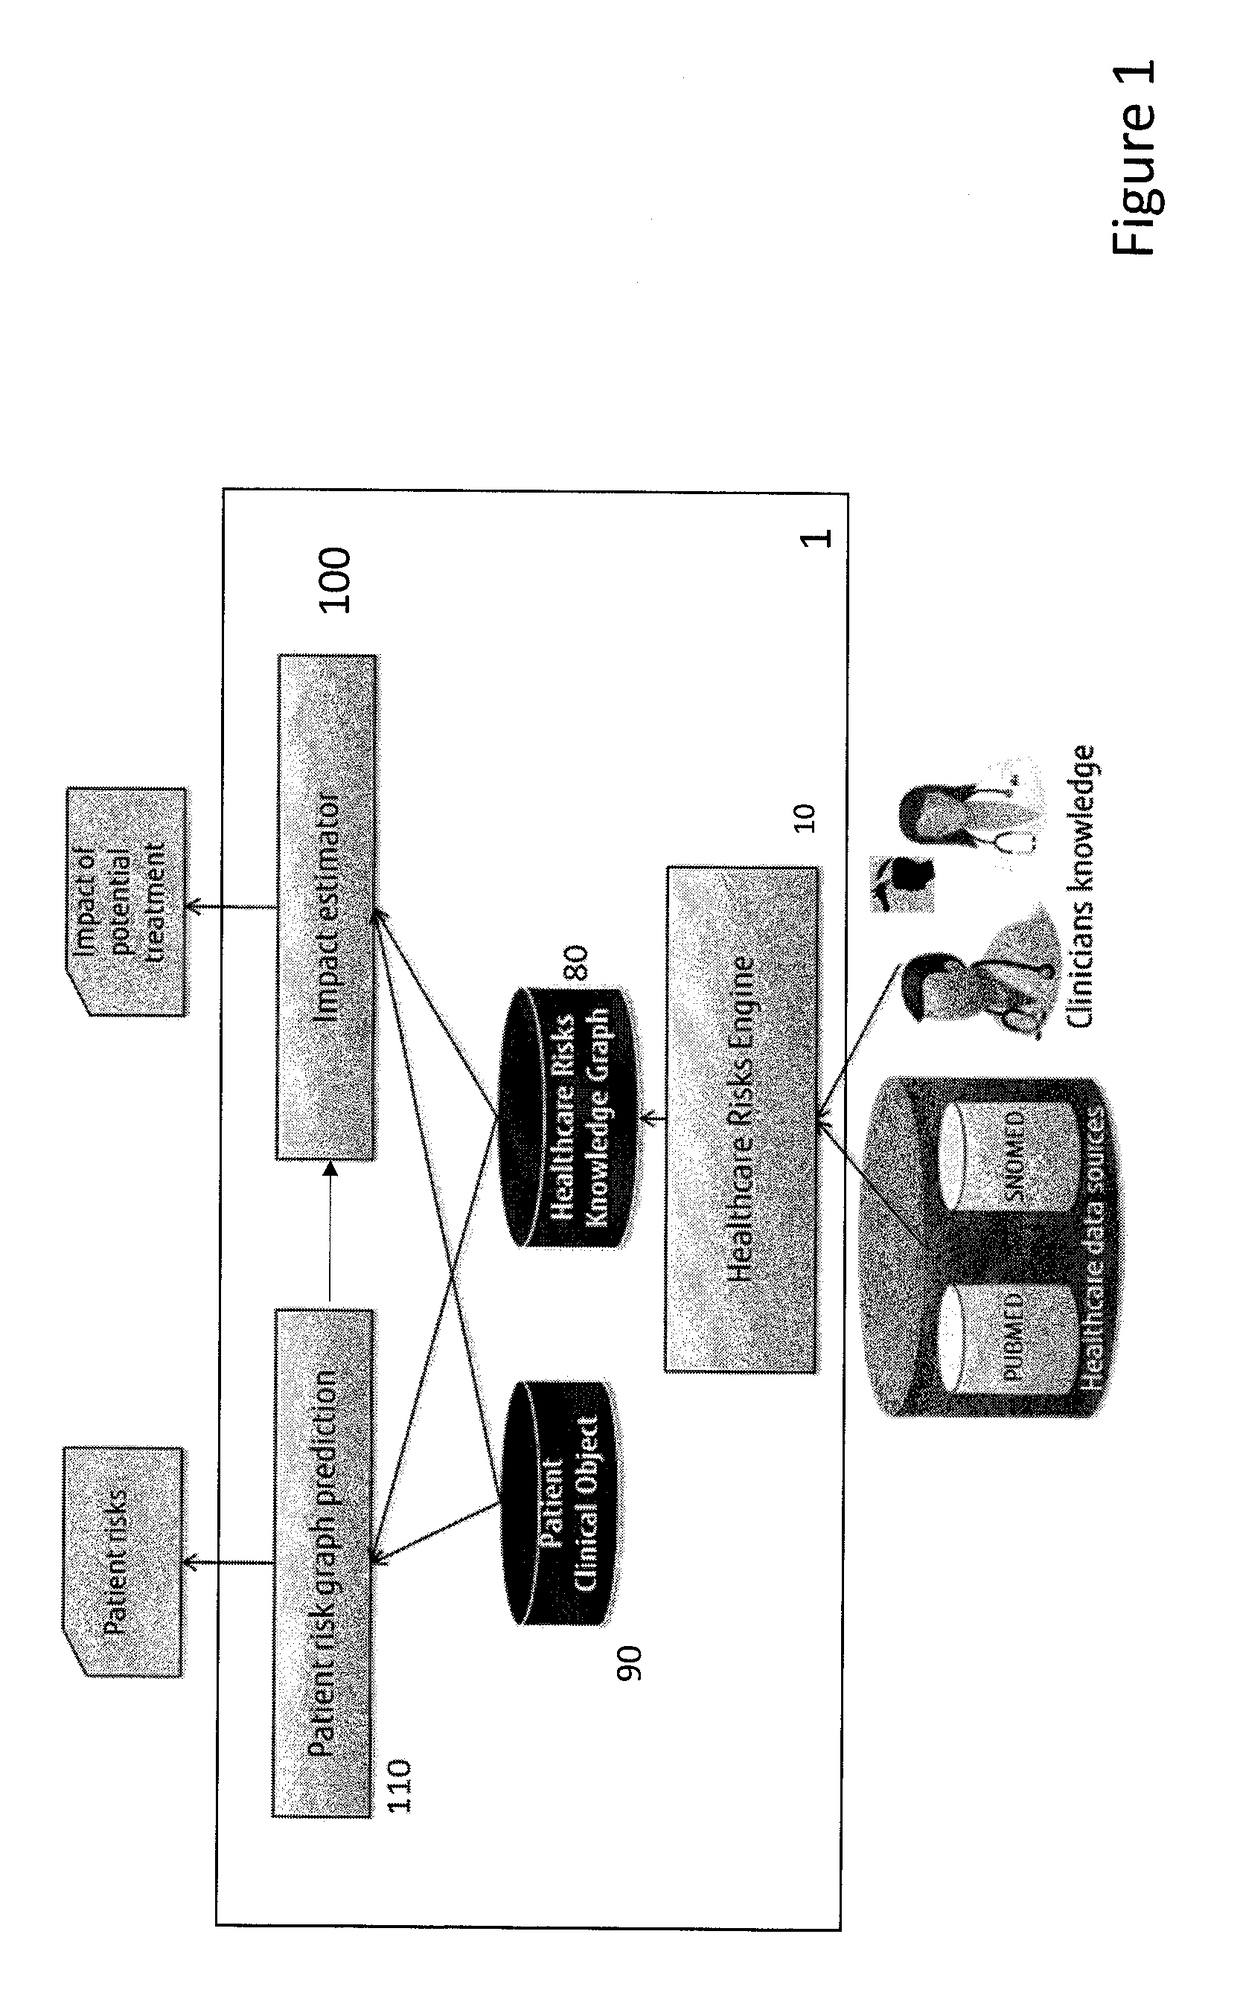
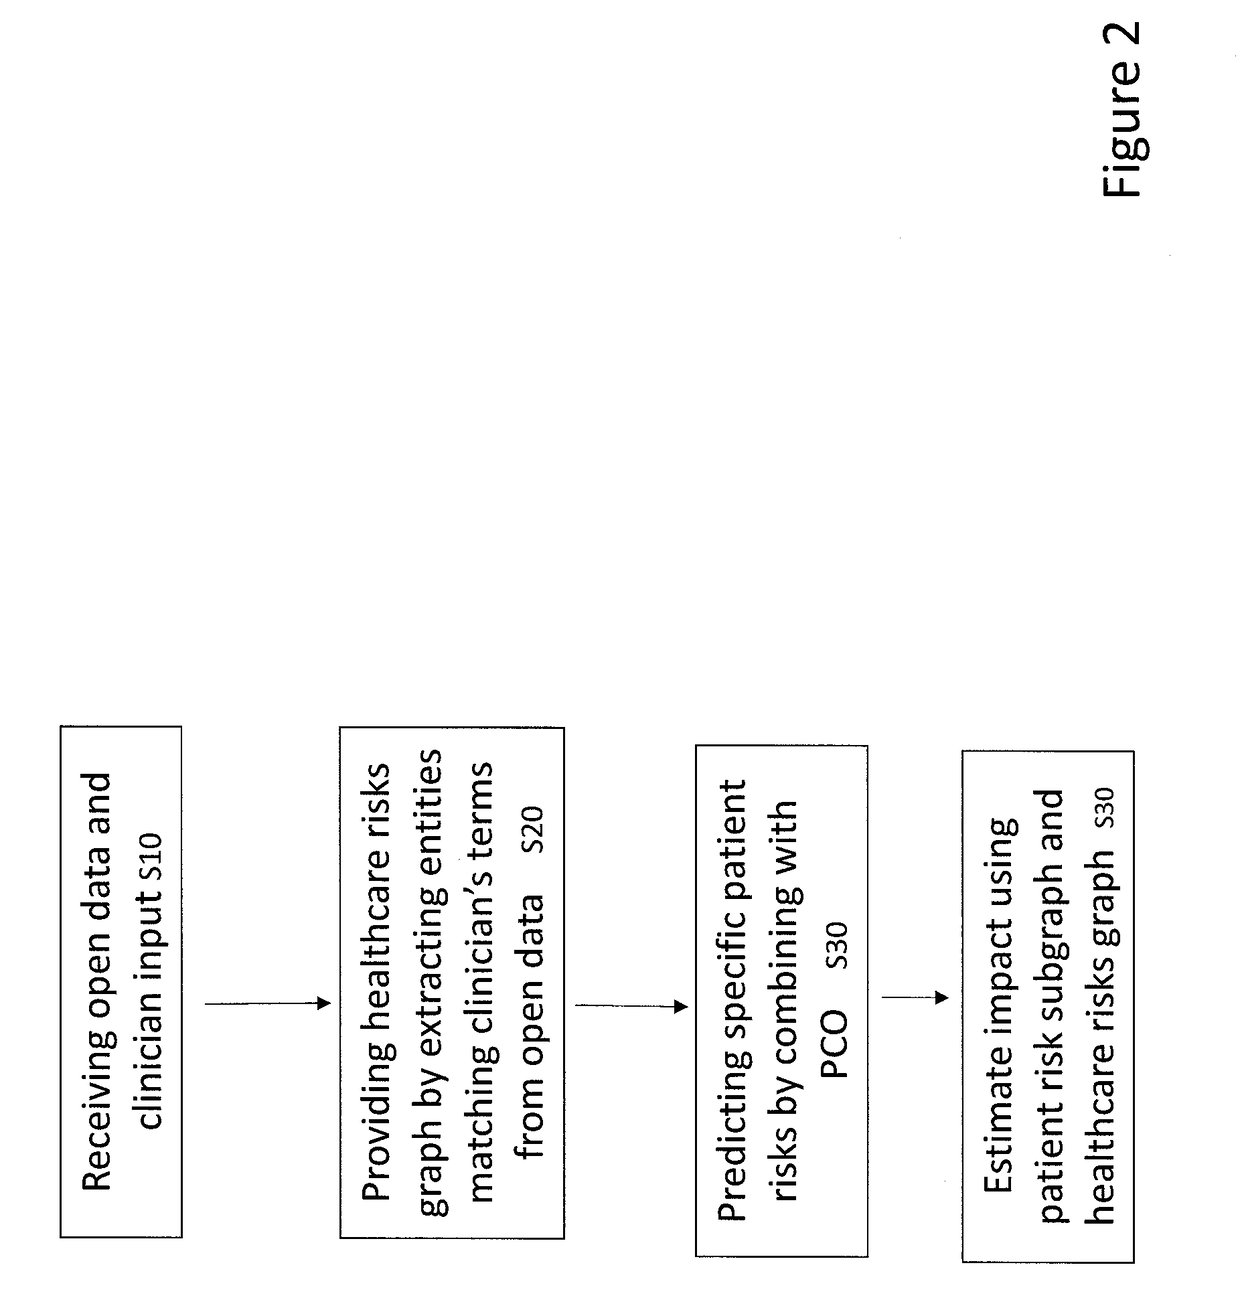
[0058]Embodiments of the invention may aim: [0059] to create a network of Health Risks, represented as a Knowledge Graph, extracted from the literature and public data sources together with the clinicians' expertise on risk assessment; [0060] to develop a mechanism that identifies the associated risks for a particular patient given his/her clinical history information, such as, diagnoses, drugs, and symptoms; enrich the patient clinical history with his/her risk information; and [0061] to develop a mechanism that identifies the associated risks of a patient after applying a particular treatment.
[0062]Precision medicine is a medical model that proposes the customisation of healthcare, tailored to the individual patient/subject. This is an emerging approach for disease diagnosis, treatment and prevention that takes into account individual variability in genes, physiology, anatomy, environment, and lifestyle. In this context invention embodiments support the individual variability of the patients by including health risks, along with their associated treatments, diagnosis, and drugs.
[0063]The following definitions are used in this document:
[0064]Health risk (or simply risk): a disease or condition precursor associated with a higher than average morbidity or mortality rate. Disease precursors include demographic variables, certain individual behaviours, familial and individual histories, and certain physiological changes.
[0065]Health risk factor: a condition, behaviour, or other factor that increases risk, e.g., depression is a risk factor in suicide.
[0066]Medical treatment: the management and care of a patient, including for example in the mental health area, nursing, psychological intervention and specialist mental health rehabilitation. This term may also include “alternative” medical treatments and medication which may be prescribed, if so wished, for example, homeopathic/hypnosis/acupuncture treatment.
[0067]Diagnosis: the process of determining by examination the nature and circumstance of a disease or condition from its signs and symptoms
[0068]Drugs: medicaments that treat or prevent or alleviate the symptoms of a disease.
[0069]As far as the inventors are aware, there is no standard resource for dealing with health risks, there are only ad-hoc resources such as plain lists, or matrices within medical institutions and for specific areas.
[0070]In summary: [0071] there are no standards for representing health risks, in the same way as there are standards for diseases, e.g., ICD9; there are only plain lists of risks and they are specific to a particular medical institution or area; [0072] there is a lack of methods and tools that exploits the information of the healthcare risks and their association to patient clinical data; [0073] there are no approaches that estimate the potential risks of a patient after applying a particular treatment
[0074]Invention embodiments create a network of medical risks of a given patient and evaluate the potential impact of a treatment for such patient.
[0075]A detailed embodiment might consist of three main modules [0076] A module for the creation of Health Risks Knowledge Base/Graph based on information extracted from the literature and public data sources together with the clinicians' expertise on risk assessment. [0077] A module that predicts for a given patient a health risks subgraph that is affected [0078] An impact estimator module which estimates the impact of a potential treatment in the patient risk graph.
[0079]The system 1 according to one invention embodiment includes a Health Risks Knowledge Graph builder module 10, based on information obtained from literature, and available standards which creates a knowledge graph 80; a patient risk graph prediction module 110, which predicts the risks for a given patient, and an impact estimator 100, which uses the predicted patient-specific risks to estimate the impact of a potential treatment. The patient risk graph prediction module may form part of the impact estimator. In this case, the patient risk graph prediction may be an interim product and not necessarily directly output to the user, so that the system outputs the potential impact of the treatment only (for example using a GUI).
[0080]It is worth mentioning that the solution in this embodiment also relies on a “Patient Clinical Object” (PCO) 90 which is defined as a semantically rich aggregation of clinical entities that encapsulates information about a given patient. This PCO contains historical clinical information, such as information about the patient and its clinical data, diagnoses, and drugs.
[0081]FIG. 1 shows the main components of the system 1 for health risk assessment. There is a healthcare knowledge data input to receive open data and an expert knowledge input to accept input of form one or more clinicians relating to risk. The clinician knowledge is input by people directly, and can be grouped into risks, risk factors and treatments. The open data may be from healthcare data sources such as PUBMED and SNOMED, as explained in more detail below.
[0082]A healthcare risk engine 10 is used to provide a healthcare risk knowledge graph from the open data and clinician input. This uses the human knowledge of (a) clinician(s), who inputs risk-related terms to retrieve relevant documents from the open data. The healthcare risk knowledge graph is extracted as entities (standardised terms, but also including the clinician's original terms) from the documents corresponding to the clinician's terms, as well as the links between the entities.
[0083]A patient risk graph prediction module 110 predicts risks for a specific patient by combining information in a Patient Clinical Object, PCO, 90 with entities in the healthcare risk knowledge graph to produce a patient risk graph.
[0084]An impact estimator module 100 estimates the impact of a specific potential treatment by taking the specific treatment and adjacent nodes from the healthcare risk knowledge graph to form a healthcare treatment subgraph and finding a corresponding entity and adjacent nodes in the patient risk graph to form a patient treatment subgraph and providing an impact graph by combining the patient treatment subgraph and the healthcare treatment subgraph and retaining some or all of the resultant linked nodes as the impact graph.
[0085]FIG. 2 illustrates a corresponding method, including receiving, S10, open data and clinician knowledge relating to risk; providing, S20, a healthcare risk knowledge graph from the open data and clinician input by using clinician input of risk-related terms to retrieve relevant documents from the open data and by extracting the healthcare risk knowledge graph as entities from the documents corresponding to the clinician's terms, as well as the links between the entities; and predicting, S30, risks for a specific patient by combining information in a Patient Clinical Object, PCO, with entities in the healthcare risk knowledge graph to produce a patient risk graph. Finally step S30 involves estimating the impact of a specific potential treatment by taking the specific treatment and adjacent nodes from the healthcare risk knowledge graph to form a healthcare treatment subgraph and finding a corresponding entity and adjacent nodes in the patient risk graph to form a patient treatment subgraph and providing an impact graph by combining the patient treatment subgraph and the healthcare treatment subgraph and retaining the resultant linked nodes as the impact graph.
[0086]The specific modules of the system are described in more detail below.
Health Risk Engine 10
[0087]This module captures the evidence based on data derived from literature and public data sources, such as PUBMED (PUBMED is a service of the US National Library of Medicine (NLM) and provides free access to the NLM database of nursing, veterinary, healthcare, medical and scientific articles) and SNOMED (Systemized Nomenclature of Medicine).
[0088]One underlying concept is that the data used covers a wide range of different risks and risk factors: invention embodiments are not limited to a certain area of medicine. For example SNOMED CT (clinical terms) is a standardised multilingual vocabulary which is generally applicable across medical and health care areas. PUBMED is also as wide-ranging as the US NLM and thus generally applicable.
[0089]The process carried out by the module is shown in FIG. 3. It starts with an initial seed of keywords provided by the clinicians. With this seed the task of data collection, cleaning and pre-processing is performed. This task consists of searching for risk related information on available open datasets. Once we have the initial set of risk related terms the engine filters those terms according to a particular topic. The next task consists of performing some text mining over the initial set of extracted terms to get the risk and risks factors along with the relationships among them. Finally, the system allows clinicians to carry out a manual curation task to identify and find possible mistakes and inconsistencies in the graph.
[0090]FIG. 4 shows one example of a specific healthcare risk engine which accepts inputs from clinicians and is connected to open data in the form of a standardised vocabulary of terms and a library of documents from the healthcare domain, nursing, veterinary, healthcare, medical and scientific articles. Individual modules are explained further below.
[0091]A risk related terms collector 20 accepts input of seed terms by a clinician (or from a group of clinicians). These clinician's terms include terms related to risks in the form of potential diseases or conditions, terms related to risk factors that increase the likelihood of disease and terms related to treatments of a medical condition.
[0092]For data collection, cleaning and pre-processing, a medical entity reconciliator 30 can be used to standardise and expand the clinicians' terms to include synonyms and equivalent terms using a standardised vocabulary of terms. For example the SNOMED ontologies may be used, as explained in more detail later.
[0093]A topic detector 40 is used to filter resources by retrieving a set of documents linked to the expanded terms from a searchable medical document database (such as PUBMED). Essentially, this component compares the documents contents (for example their abstracts) with the standardised terms and selects the documents which include exactly those terms or close matches to those terms. It also tags the documents with their main topic(s).
[0094]A named entity recognition, resolution and disambiguation, NERD, module 50 extracts entities from the set of document each with a score and each aligned to the standardised vocabulary. That is, the entity may be taken from the SNOMED vocabulary, for example, but is matched to the document content.
[0095]A relation extractor 60 scores relations between the entities based on the co-occurrence of two entities in documents in the retrieved set of documents. For example, this can use known co-occurrence metrics.
[0096]The healthcare risks extraction system is arranged to generate a risk knowledge graph 80 storing the entities and their scored relations. The graph is generated by the parts explained above. The graph can then be displayed to the user (who might for instance be another clinician). For example the user might enter a term, such as a risk, risk factor or treatment and receive a subgraph of the linked terms and the strength of the link, based on the knowledge implicitly stored in the PUBMED library. However, the healthcare risk knowledge graphs is combined with a PCO in invention embodiments, to provide individual risk information.
PCO 90
[0097]An example of a PCO in construction is shown in FIG. 5. The PCO is, for example, provided from historical clinical data as a graph centred on the patient, with information about the patient linked to the patient by categories, such as any of diagnosis, symptom, treatment, hospital visit and prescription. The historical clinical data may be provided, for instance from hospital records, or health authority records. A PCO enricher may be provided in the data and knowledge acquisition system, to compare the PCO with a biomedical knowledge graph to equate PCO parts with standard vocabulary and to annotate entities in the PCO with corresponding concepts/information from the biomedical knowledge graph.
Patient Risk Graph Prediction 110
[0098]The patient risk prediction module can be a meta-predictor, also known as hybrid/combined predictor, that makes predictions by organizing and processing the predictions produced by several predictors. The individual predictors may take the information for the relevant features from the Patient Clinical Object, and the Healthcare Risks Knowledge graph.
[0099]The individual predictors are [0100] Predictor based on previous diagnoses. In this case the prediction is made by checking and reviewing the previous diagnoses of the patient. [0101] Predictor based on the drugs the patient was taking. [0102] Predictor based on the symptoms of the patient. [0103] Predictor based on the treatments the patient is receiving.
[0104]FIG. 6 depicts each one of the predictors and their relation with the Patient Clinical Object, Healthcare Risks Knowledge graph and the output, which is the patient risk sub graph prediction. This prediction indicates which risks are valid for a particular patient. Nodes of the subgraph can include risks, risk factors and treatments.
[0105]Each predictor uses items of information (terms) and potentially surrounding terms (which can be used as context) found in the PCO and searches for matching entities (also terms, which form nodes in the graph) in the healthcare risks knowledge graph. It then expands the subgraph around the corresponding terms to include further entities. For example, if there are several corresponding terms, the subgraph may be expanded to include all the nodes in the shortest path between the corresponding terms and the 1, 2 or 3 adjacent terms to each corresponding term.
[0106]Once we have the outputs of the individual predictors, a meta predictor component combines the individual predictors in order to offer better predicting performance and to see which terms (nodes) to retain in the patient subgraph. To weight this combination, the component adjusts weights to each one of the predictors, for example using the following equation
Rj=WdPd+WdrPdr+WsPs+WtPt
[0107]Where
[0108]Rj is the predicted patient risks (sub) graph
[0109]Wd is the assigned weight to the predictor based on previous diagnosis
[0110]Pd is the prediction based on previous diagnosis
[0111]Wdr is the assigned weight to the predictor based on drugs the patient was taking
[0112]Pdr is the prediction based on drugs the patient was taking
[0113]Ws is the assigned weight to the predictor based on symptoms of the patient
[0114]Ps is the prediction based on symptoms of the patient.
[0115]Wt is the assigned weight to the predictor based on treatments of the patient
[0116]Pt is the prediction based on treatments of the patient
[0117]The component takes a sample from the population of patients and creates a training dataset. The goal of the component is to build an algorithm that automatically applies the predictors, and makes a best guess or estimate the patient risk subgraph.
[0118]A detailed example of meta-prediction follows, using the equation as set out previously.
[0119]Basically, each predictor outputs a set of risks, risk factors and treatments (entities) each ranked based on the score of that entity in the healthcare risk graph.
[0120]The weight for each predictor represents how accurate its risk assessment is. Each weight then represents the number of entities we consider for each predictor. The meta predictor outputs the intersection of the repeated entities of the individual predictors.
[0121]For example, and using numbers for the entities, the predictor based on previous diagnoses may have the following output:
D Score 300.00 0.7 290.0 0.5 300.01 0.5 290.01 0.4
[0122]And a weight of 2 represents that we only consider the first two risks for that predictor:
[0123]Let us suppose we have the following example
Rj=WdPd+WdrPdr+WsPs+WtPt
[0124]And replacing the results of the predictors:
[0125]Next, the meta predictor checks which entities are present in all the individual predictors and selects the ones with a high score (above a threshold) in terms of the largest cumulative score and/or largest number of times they appears. These nodes are included in the patient risk graph.
[0126]The meta predictor, in order to calculate the weights, is trained in advance on a pre-defined set of training examples, which then facilitate its ability to reach an accurate diagnosis when given new patient data.
[0127]The subgraph can be used in many flexible ways and contains significantly more information than a simple list of risks.
[0128]FIG. 7 shows an excerpt of a risk knowledge graph showing how biomedical related information is encoded in a graph. The graph database contains information about diagnoses (or risks), drugs, treatments, and symptoms, and the relations between them. For example the weights on the links between the terms show how strongly they are related using the co-occurrence metrics mentioned previously.
[0129]In this particular example the graph identifies the relation between Anxiety and Depression as comorbidity with a score of 0.7, and the relation between Depression and Sertraline as treatment, because the drug prescription for depression is in some cases sertraline.
[0130]Each entity has a score (i.e. Anxiety—0.9) showing its similarity to the sum of the documents in the retrieved set of documents. 1 indicates an identical term in all the relevant documents
[0131]The labels are available due to previous annotation of SNOMED by the clinician with the risks, risk factors and treatments, using the terms collector or another module. For example, a link between two risks is labelled with “co-morbidity”, a link between a risk and a risk factor is labelled with “risk factor” and a link between a treatment and a risk or risk factor is labelled “treatment”.
[0132]FIG. 8 shows a patient risk graph, which has combined information about heart palpitations and panic in the PCO with the part of the risk knowledge graph shown in FIG. 7.
[0133]Here, the PCO information has been combined with the general derived risk information to give a picture of risks for the individual, which can be, for example, displayed to the user with a GUI.
[0134]A further embodiment incorporates a treatment impact estimator as well as the patient risk graph predictor. Other components remain unchanged and the reader is referred to the previous description thereof. The impact estimator is shown in FIG. 9.
Impact Estimator 100
[0135]The module takes as input the associated risks of a particular patient (derived as explained above), and a potential treatment for such patient. The module produces as a result a subgraph of potential risks along with their scores that the patient would have if the clinicians apply the potential treatment.
[0136]The potential treatment is related to and affects diagnoses, drug prescription, and future visits. The module takes the treatment related information, e.g., diagnoses, drug prescription, and future visits and search on the Risk Knowledge Graph to collect potential associated risks to the new “status” of the patient, after the application of the treatment. Once the potential associated risks are identified, the module predicts if these risks would affect current patient risks and if so, how.
[0137]FIG. 9 depicts the flow of the process.
[0138]In a nutshell this module has two main tasks [0139] Identification of risks for a given treatment, in which the module extracts the factors associated with a given treatment, and looks for the risks (of the extracted factors) in the Healthcare Risks Knowledge Graph. Here, the relevant section of the graph around the treatment is selected, for example by including the terms (nodes) that are directly linked to the treatment in the graph, or also including more nodes, for instance the neighbour and the next node(s) along the path. [0140] Graph-based risk assessment and mining, in which the module takes as input the two subgraphs of (1) existing patient risk in the PCO, and (2) associated risks to a given treatment; and performs graph analysis to obtain the potential risks for the patient and given treatment.
[0141]The key point here is that the patient risk subgraph can be obtained without any reference to a particular treatment, for example using the symptoms. On the other hand the treatment subgraph can be extracted from the general health risk graph that can contain risks that have not yet being identified for this patient. After the two subgraphs are analysed together the impact graph is created as the result of this join between the treatment graph and the patient graph.
[0142]FIGS. 10 and 11 illustrate the patient treatment subgraph and the potential impact of the treatment. The patient risk graph (FIG. 8) is a part of the PCO which has been supplemented using the healthcare risk graph to include risk information. It is therefore relevant to the treatment. The potential treatment is included in the treatment graph example shown in FIG. 10 as Sertraline. This graph has retained the scoring of entities and/or links from the originally from the healthcare risk graph).
[0143]The potential impact graph shown in FIG. 11 includes the nodes from the patient treatment subgraph and the healthcare treatment subgraph including at least one intersection node which is a term that was present in both graphs. It also retains the scoring, which can be useful information for the clinician.
[0144]FIG. 12 is a block diagram of a computing device, such as a data storage server, which embodies the present invention, and which may be used to implement a method of an embodiment. The computing device comprises a computer processing unit (CPU) 993, memory, such as Random Access Memory (RAM) 995, and storage, such as a hard disk, 996. Optionally, the computing device also includes a network interface 999 for communication with other such computing devices of embodiments. For example, an embodiment may be composed of a network of such computing devices. Optionally, the computing device also includes Read Only Memory 994, one or more input mechanisms such as keyboard and mouse 998, and a display unit such as one or more monitors 997. The components are connectable to one another via a bus 992.
[0145]The CPU 993 is configured to control the computing device and execute processing operations. The RAM 995 stores data being read and written by the CPU 993. The storage unit 996 may be, for example, a non-volatile storage unit, and is configured to store data.
[0146]The display unit 997 displays a representation of data stored by the computing device and displays a cursor and dialog boxes and screens enabling interaction between a user and the programs and data stored on the computing device. The input mechanisms 998 enable a user to input data and instructions to the computing device.
[0147]The network interface (network I/F) 999 is connected to a network, such as the Internet, and is connectable to other such computing devices via the network. The network I/F 999 controls data input/output from/to other apparatus via the network.
[0148]Other peripheral devices such as microphone, speakers, printer, power supply unit, fan, case, scanner, trackerball etc may be included in the computing device.
[0149]Methods embodying the present invention may be carried out on a computing device such as that illustrated in FIG. 12. Such a computing device need not have every component illustrated in FIG. 12, and may be composed of a subset of those components. A method embodying the present invention may be carried out by a single computing device in communication with one or more data storage servers via a network. The computing device may be a data storage itself storing at least a portion of the data graph. A method embodying the present invention may be carried out by a plurality of computing devices operating in cooperation with one another. One or more of the plurality of computing devices may be a data storage server storing at least a portion of the data graph.
[0150]Although a few embodiments have been shown and described, it would be appreciated by those skilled in the art that changes may be made in these embodiments without departing from the principles and spirit of the invention, the scope of which is defined in the claims and their equivalents.

PUM

no PUM

Description & Claims & Application Information

We can also present the details of the Description, Claims and Application information to help users get a comprehensive understanding of the technical details of the patent, such as background art, summary of invention, brief description of drawings, description of embodiments, and other original content. On the other hand, users can also determine the specific scope of protection of the technology through the list of claims; as well as understand the changes in the life cycle of the technology with the presentation of the patent timeline. Login to view more.
Why Eureka
Try Eureka