Systems and methods for summarizing and steering multi-user collaborative data analyses

Active Publication Date: 2020-12-31
FUJIFILM BUSINESS INNOVATION CORP
View PDF3 Cites 4 Cited by
  • Summary
  • Abstract
  • Description
  • Claims
  • Application Information

AI Technical Summary

Benefits of technology

The patent describes a problem in data analysis where there is a need for an interface to help analysts understand and review data from multiple sources. There is also a need for an interface to help determine future directions of data exploration. The patent proposes a solution using a meta-visualization approach and a GUI tool that provides a visual summary of datacharts and offers interactive guidance for future data exploration. This tool uses deep learning techniques to learn compact vector representations ofcharts and allows analysts to identify patterns and holes in the data. It also offers recommendations forcharts based on selected local regions and uses trained autoencoders for chart generation. This helps analysts refine their analysis by reviewing the recommendedcharts.

Problems solved by technology

Unfortunately, the EVA process becomes challenging when the dataset is larger and more complicated (e.g., involving many records and attributes).
The process can become challenging when the dataset is larger and more complicated, where multi-user collaboration is needed.
However, effectively summarizing such analyses and further indicating recommendations and direction for data exploration is still a problem in related art implementations.
There are several problems that need to be considered when providing an interface for EVA implementations.

Method used


Image

  • Systems and methods for summarizing and steering multi-user collaborative data analyses
  • Systems and methods for summarizing and steering multi-user collaborative data analyses
  • Systems and methods for summarizing and steering multi-user collaborative data analyses

Examples


example implementations

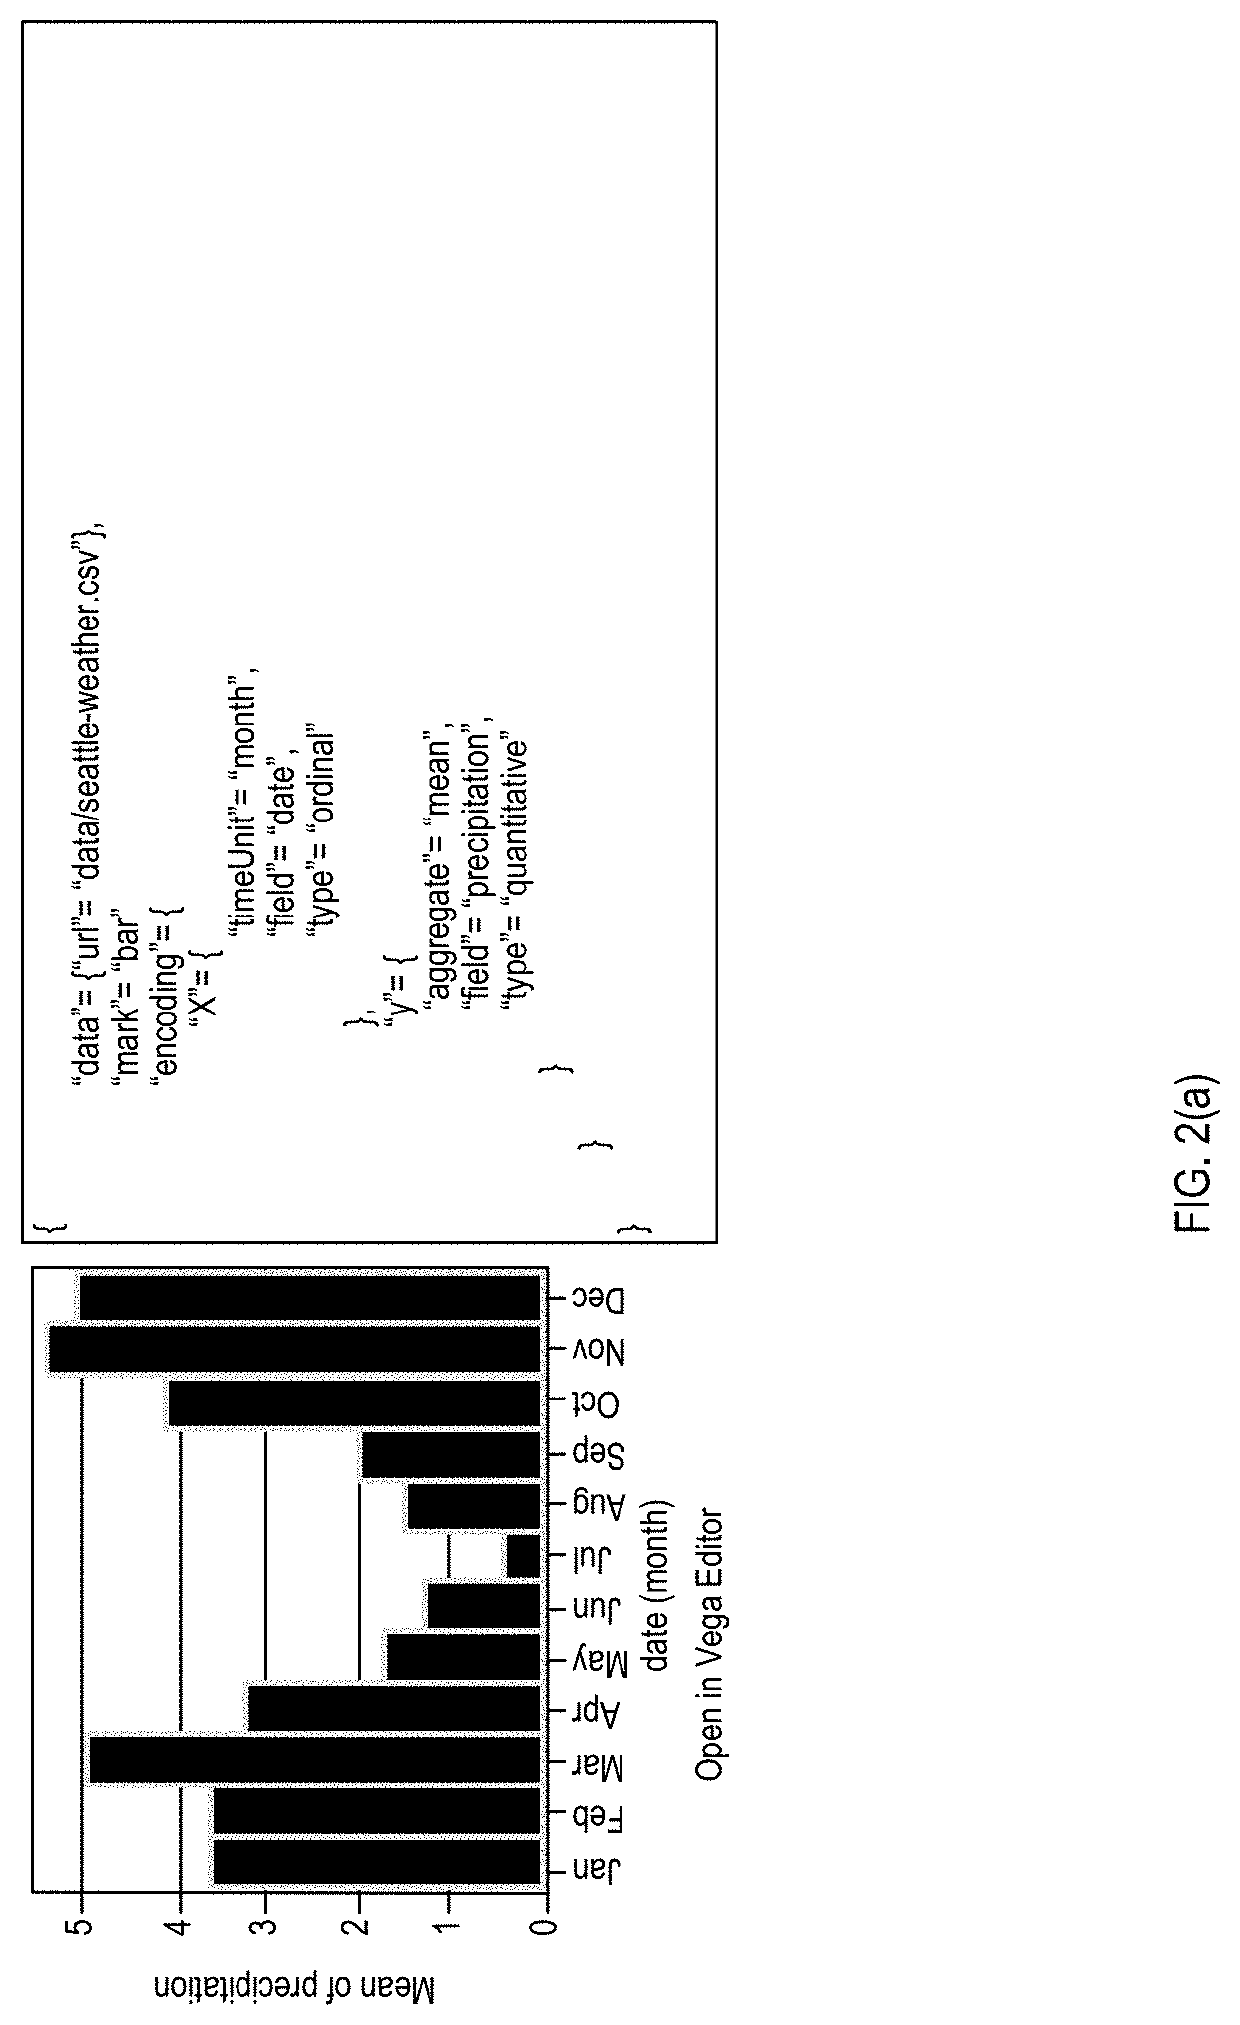
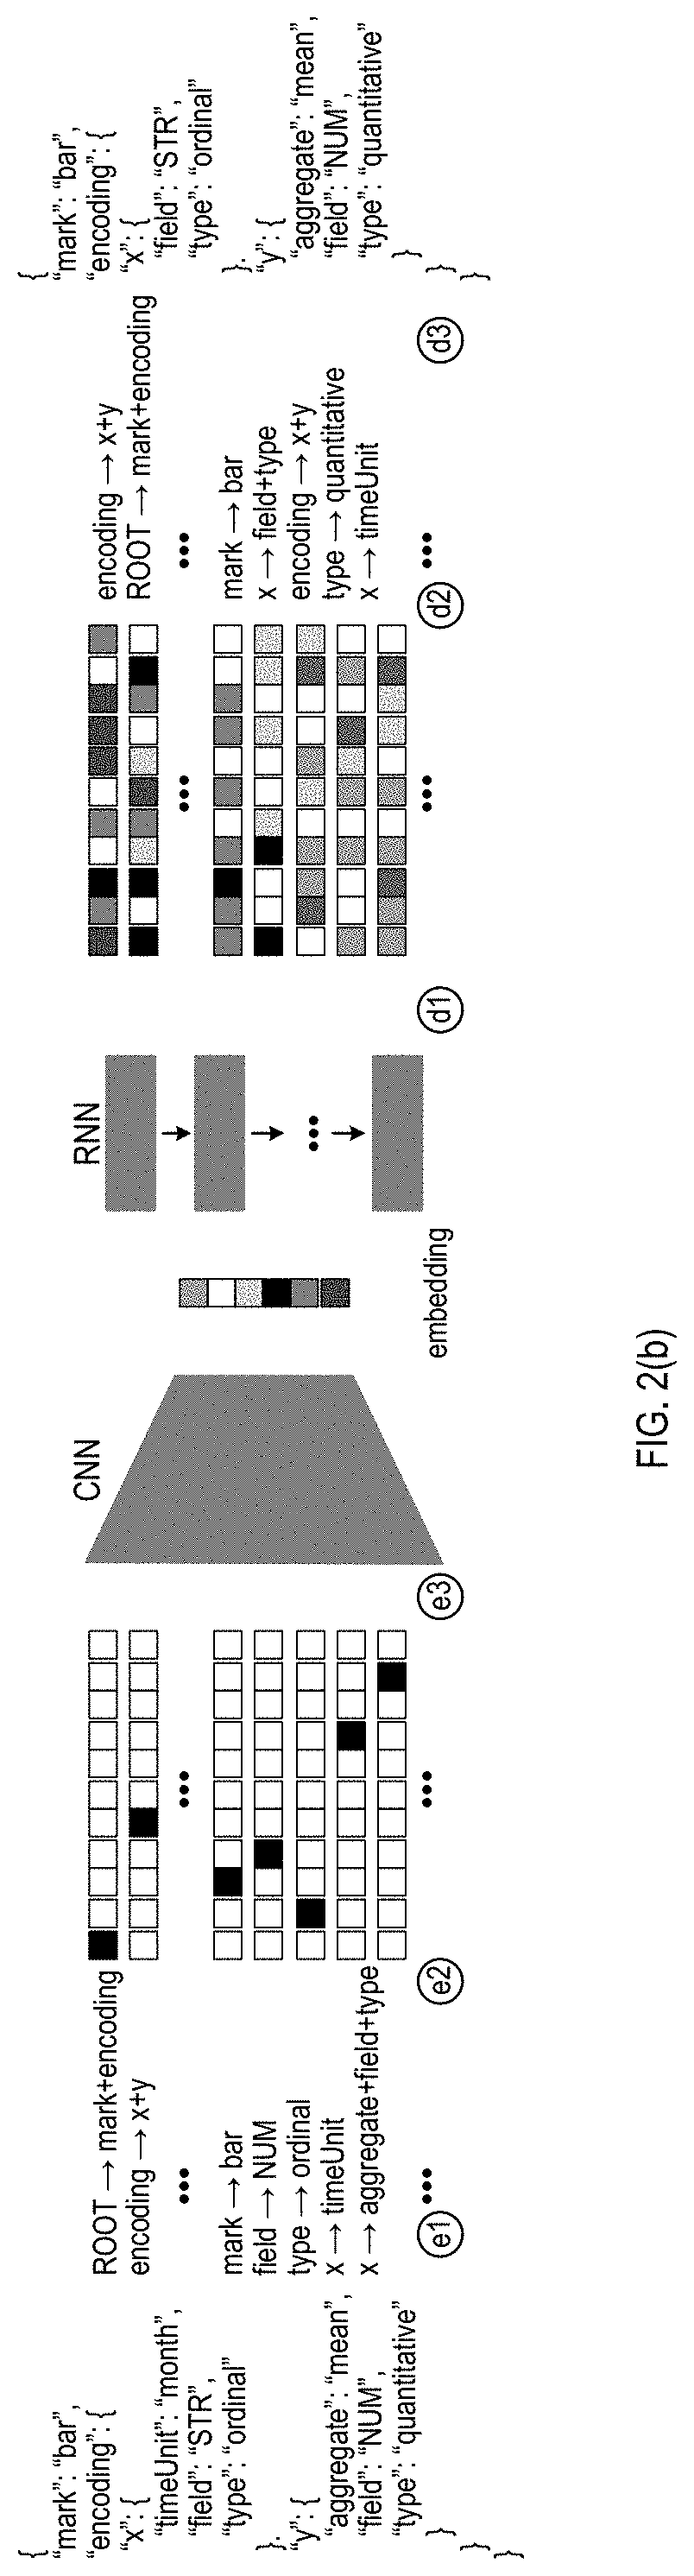
[0025 can use any declarative language for data visualization, such as VegaLite, to represent a data chart with a tree structure. FIG. 2(a) illustrates an example specification for data visualization, in accordance with an example implementation. The example shown in FIG. 2(a) involves the VegaLite specification, which is a JavaScript Object Notation (JSON) object with a nested format (e.g., a tree), however, other specifications for representing data charts can also be utilized, and the example implementations described herein are not particularly limited thereto. Following the GVAE approach, the structure is viewed as a context free grammar tree generated by a set of rules, wherein each rule is represented with a one-hot vector. These vectors are tiled together as the encoding part which is a deep convolution neural network. The decoding part is a recurrent neural network which produces a set of unnormalized log probability vectors (or “logits”). Each logit vector is then mapped b...


PUM


Abstract

Example implementations described herein are directed to a graphical user interface (GUI) tool that provides representations of generated charts on a map, wherein distances between representations are provided based on similarity between charts. Similarity is determined through machine learning techniques that are applied on a vectorized form of charts. Example implementations described herein encode charts into vectors using deep learning techniques, which facilitates machine learning techniques such as nearest neighbor to be utilized to determine similarity between charts based on their corresponding vectors.

Description

BACKGROUNDField[0001]The present disclosure is directed to machine learning, and more specifically, to systems and methods that utilize machine learning through a graphical user interface (GUI) to generate appropriate data charts and direct interactive data exploration.Related Art[0002]Exploratory visual analysis (EVA) is an iterative process in which an analyst uses visual methods, such as plotting charts with different parts of data, to identify interesting findings and make data-driven decisions. EVA can be useful when an analyst is unfamiliar with the data or has vague hypotheses and ill-defined tasks, where fully-automatic methods are difficult to develop and domain knowledge is strongly required in data exploration. This EVA approach is widely promoted and supported by many commercial tools in the related art.[0003]Unfortunately, the EVA process becomes challenging when the dataset is larger and more complicated (e.g., involving many records and attributes). The exploration sp...

Claims


Application Information

Patent Timeline
IPC IPC(8): G06T11/20G06F16/901G06F8/34G06F8/38G06F8/41
CPCG06T11/206G06F8/44G06F16/9024G06F8/34G06F8/38G06F9/451G06F16/2457G06F16/26G06F9/453
Inventor ZHAO, JIAN
Owner FUJIFILM BUSINESS INNOVATION CORP
Why Eureka
Try Eureka