Methods and Compositions for Treating Autophagy Related Disease States and Conditions Utilizing AMPK Activation
a technology of autophagy and activation, applied in the field of methods and compositions for treating autophagy related disease states and conditions utilizing ampk activation, can solve the problems of unresolved functional interplay between galectin and ubiquitination responses, and the broad investigation of the literature, and achieve the effect of promoting tak1 ubiquitination
- Summary
- Abstract
- Description
- Claims
- Application Information
AI Technical Summary
Benefits of technology
Problems solved by technology
Method used
Image

Examples
examples
Results
Lysosomal Damage-Induced Ubiquitination Depends on Gal9
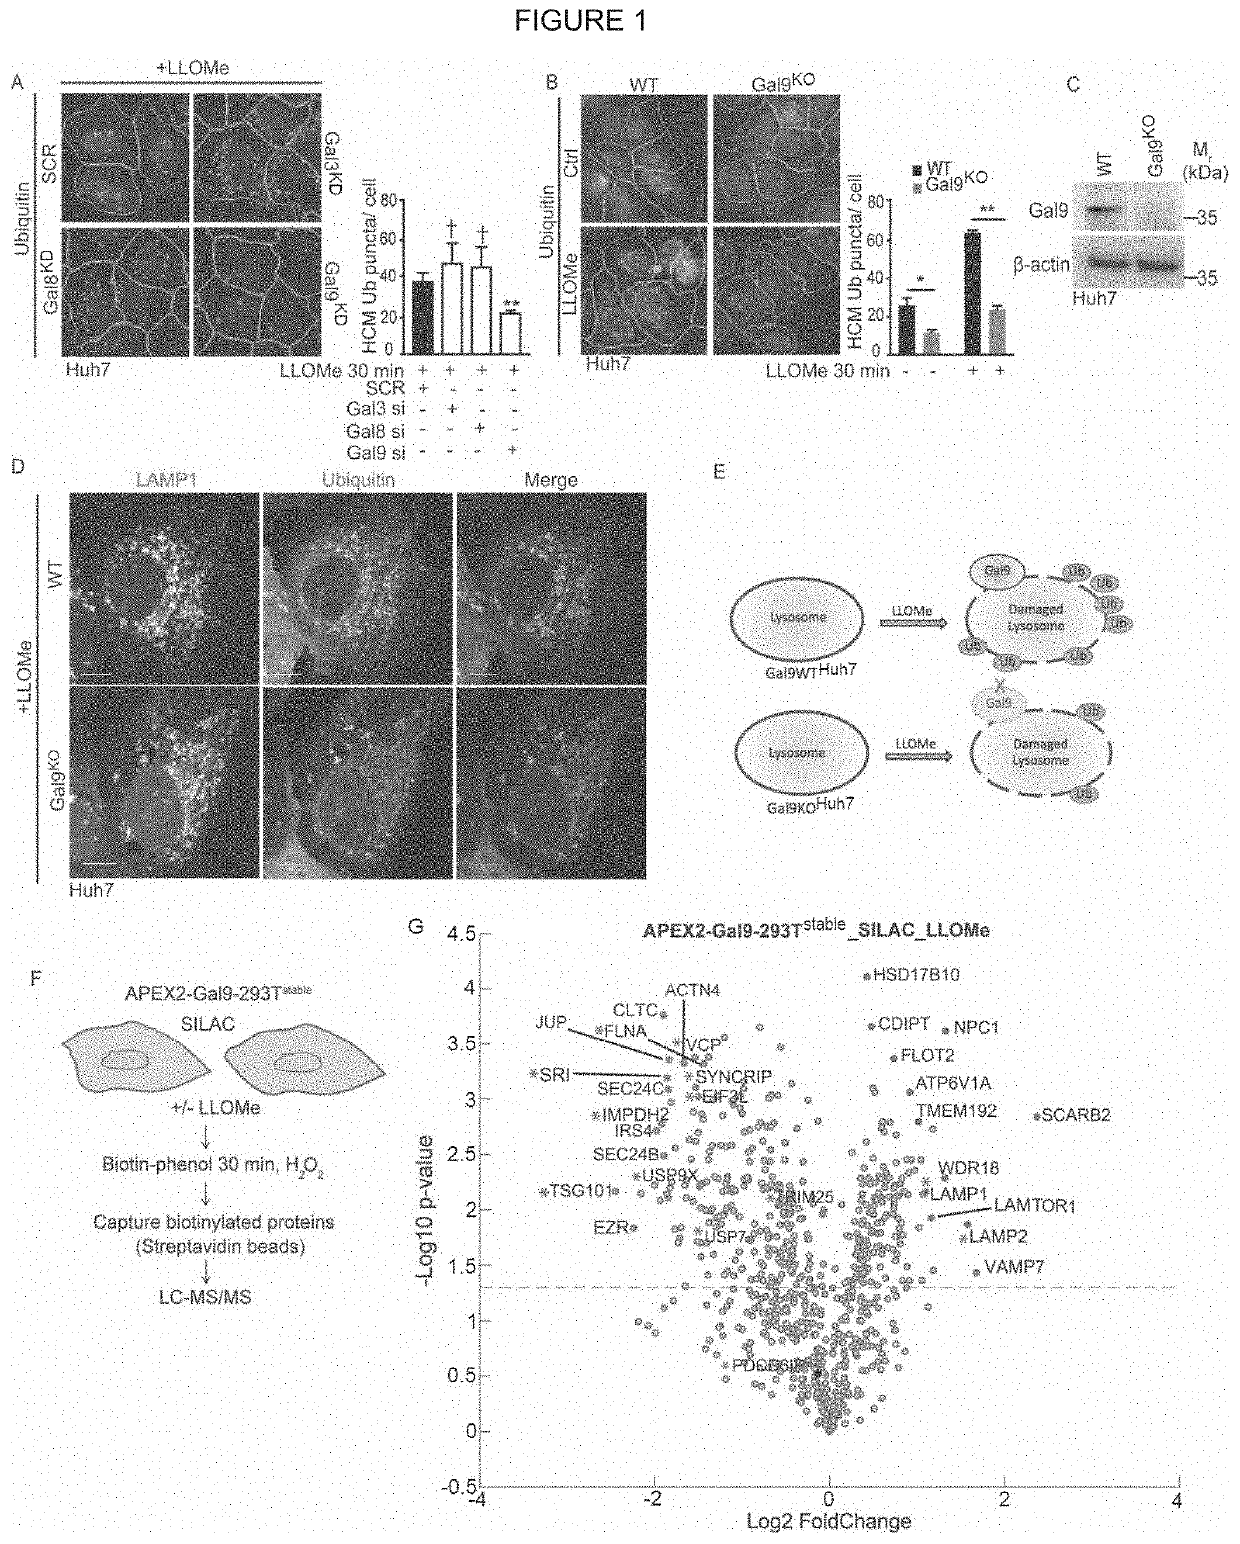
[0094]Lysosomal damage affects mTOR and AMPK, by inactivating the former and activating the latter (Jia et al., 2018). Both of these regulators represent master regulators of cellular metabolism (Garcia and Shaw, 2017; Hardie, 2011; Herzig and Shaw, 2018; Lin and Hardie, 2018; Saxton and Sabatini, 2017). In keeping with this, and likely including additional changes, lysosomal damage affected metabolism as indicated by metabolomic analyses (Table S1, Tab1). Here, we focused on the mechanism of how lysosomal damage activated AMPK. Lysosomal membrane damage induces both galectin and ubiquitin responses (Aits et al., 2015; Chauhan et al., 2016; Maejima et al., 2013; Papadopoulos et at, 2017). We wondered whether the two might be connected. There are three major galectin responders, Galectin 3 (Gal3), Gal8 and Gal9, to lysosomal (Aits et al., 2015; Chauhan et al., 2016; Jia et al., 2018; Maejima et al., 2013) and endolysosomal...
PUM
| Property | Measurement | Unit |
|---|---|---|
| pKa | aaaaa | aaaaa |
| pKa | aaaaa | aaaaa |
| time | aaaaa | aaaaa |
Abstract
Description
Claims
Application Information
 - R&D
- Intellectual Property
- Life Sciences
- Materials
- Tech Scout
- Unparalleled Data Quality
- Higher Quality Content
- 60% Fewer Hallucinations
Browse by: Latest US Patents, China's latest patents, Technical Efficacy Thesaurus, Application Domain, Technology Topic, Popular Technical Reports.
© 2025 PatSnap. All rights reserved.Legal|Privacy policy|Modern Slavery Act Transparency Statement|Sitemap|About US| Contact US: help@patsnap.com