Method for diagnosing performance problems in cabling

a performance problem and cabling technology, applied in resistance/reactance/impedence, line-transmission details, instruments, etc., can solve the problems of difficult determining the cause of some rf transmission parameter faults, few simple yet accurate methods to determine i

Inactive Publication Date: 2002-08-13
MICROTEST
View PDF14 Cites 80 Cited by
  • Summary
  • Abstract
  • Description
  • Claims
  • Application Information

AI Technical Summary

Problems solved by technology

However, currently known field test instruments generally do not provide simplified diagnostic information to help locate and determine the reason for failures.
Determining the cause of some RF transmission parameter faults can be difficult since the overall link performance often depends on the performance of the individual components and installation techniques of the link.
Until now, there have been few simple yet accurate methods to determine if a fault is at the connection or the within the cable itself.
That is, the frequency domain data that is processed by currently known field test instruments does not provide readily interpretable information about the cause of the failure.
In the past, trouble-shooting of NEXT and Return Loss faults with normal field test equipment has generally been done on a trial and error basis as it typically requires skill levels normally not available to the cable installation industry.
Often, misinterpretations of frequency domain data are made, resulting in substantial unnecessary rework of the link.
However, with the emergence of higher performance Category 6 and Category 7 cabling systems, a significant percentage of such links do not meet desired performance levels.
In general, the failures in these links are due to a lack of transmission performance margin in individual components and higher degrees of sensitivity to the installation practices that have been used for Category 5 and other systems that are pervasive in the market.
The ...

Method used


Image

  • Method for diagnosing performance problems in cabling
  • Method for diagnosing performance problems in cabling
  • Method for diagnosing performance problems in cabling

Examples


Embodiment Construction

The following descriptions are of exemplary embodiments only, and are not intended to limit the scope, applicability, or configuration of the invention in any way. Rather, the following description provides a convenient illustration for implementing a preferred embodiment of the invention. It should be apparent that various changes may be made in the function and arrangement of the elements described in the following embodiments without departing from the spirit and scope of the invention as set forth in the appended claims.

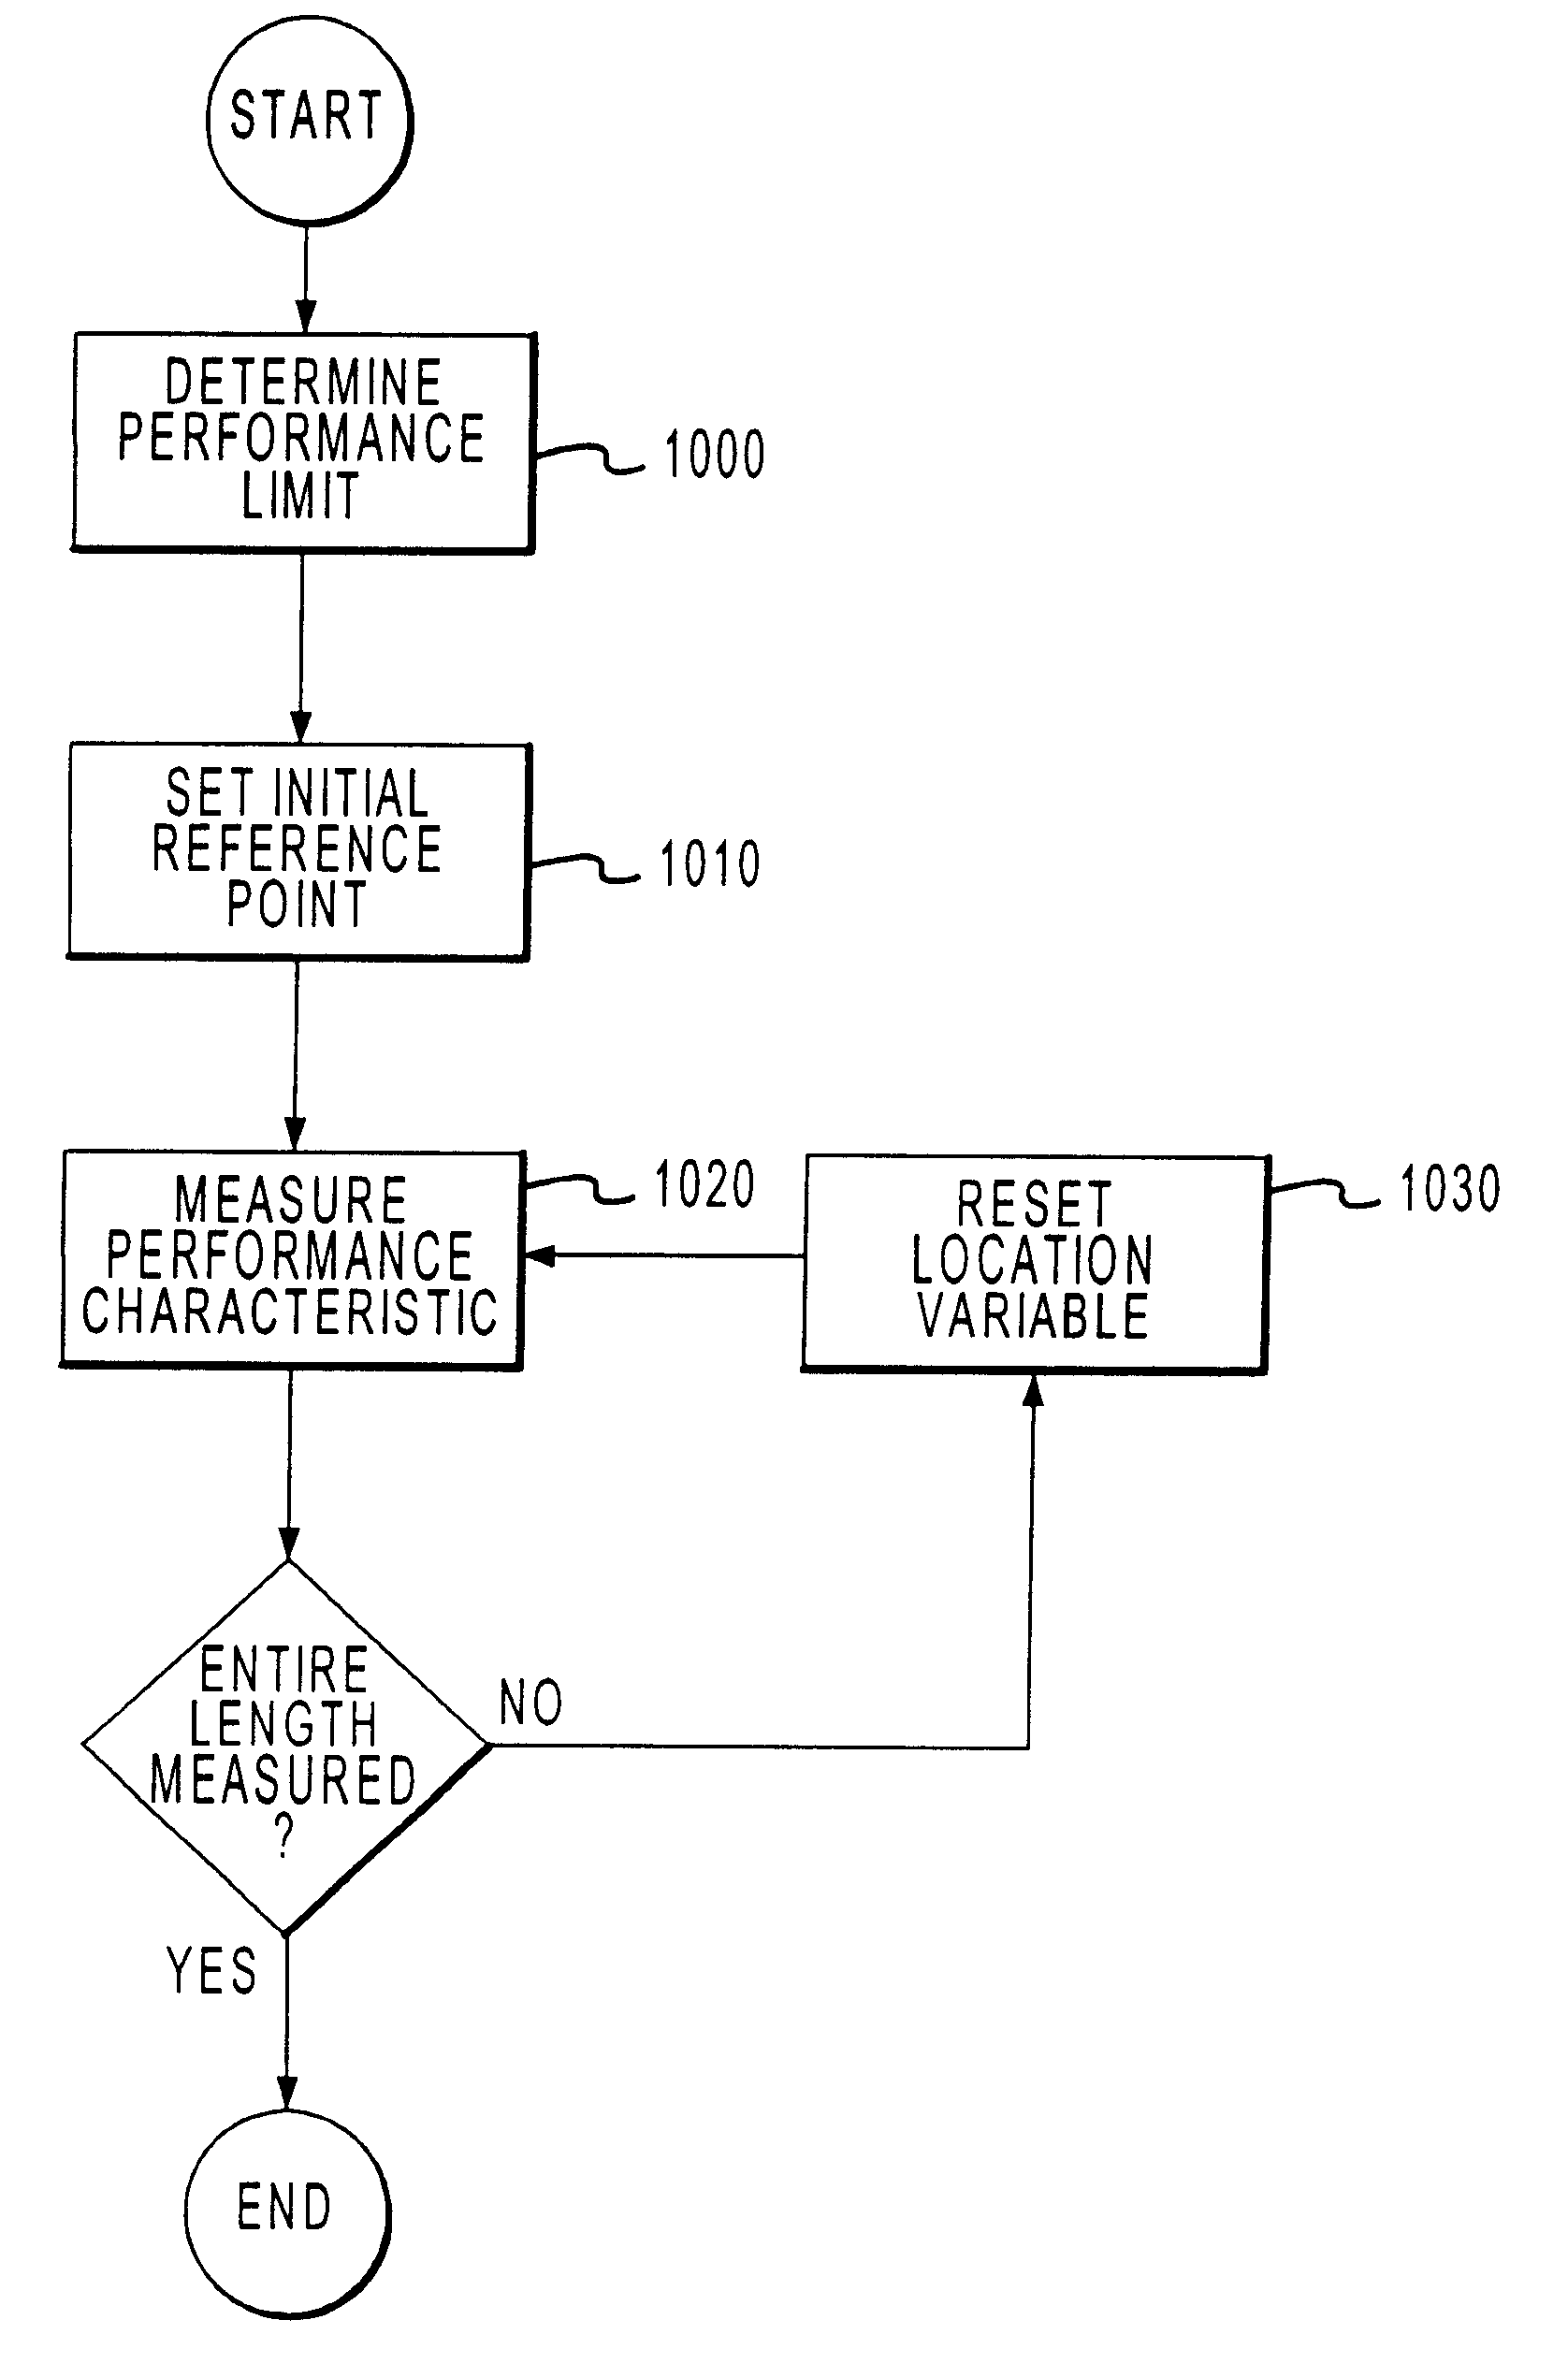
That being said, with momentary reference to FIG. 10, a flow chart showing a process in accordance with the present invention is illustrated. First, a performance limit for a cable is determined 1000. Next, a location variable on the cable is set to an initial reference point 1010 and a performance characteristic at the location variable is obtained 1020. This process is suitably repeated for the length of the cable. That is, after measuring the performance chara...


PUM


Abstract

The present invention provides methods for using time domain analysis of NEXT, Return Loss and the like, in conjunction with the application of time or distance referenced limits to verify and determine compliance of the performance requirements of connections in a typical link. Time domain analysis of NEXT, Return Loss data and the like, suitably provides the performance characteristics of a link as a function of time or distance. When coupled with time or distance performance curves for connections, it can be determined if the transmission fault is at a connection or in the cable. The time limit curves for connections can be generated based on the frequency domain performance requirements for connecting hardware of a specific level of performance. The connection time limit curves thus provide an interpretation means to determine if the connection is within performance standards, allowing improved isolation of the fault condition.

Description

BACKGROUND OF INVENTION1. Technical Field of the InventionThis invention relates generally to the use of signal processing techniques for determining the performance of cabling connections, and, more particularly, to the development and use of time domain limits to determine the location and source of faults in cabling systems.2. Background of the InventionThe transmission performance characteristics of modem high speed data communication twisted pair cabling systems are defined by various international and industry working bodies (standards organizations) to assure standard data communication protocols can successfully be transmitted across the transmission media. These data communication cabling systems (known as links) typically consist of connectors (modular 8 plugs and jacks) and some form of twisted pair cabling. The requirements for important RF transmission performance parameters such as, among others, Near End Crosstalk (NEXT), Return Loss, Insertion Loss, and Equal Level F...

Claims


Application Information

Patent Timeline
IPC IPC(8): G01R31/11G01R31/08
CPCG01R31/11G01R31/083
Inventor SCIACERO, JAMES R.TONTI, JAMES G.
Owner MICROTEST
Why Eureka
Try Eureka