Intelligent test point selection for bit error rate tester-based diagrams

a bit error rate tester and intelligent test point technology, applied in the field of diagram construction, can solve problems such as the degradation of the quality of transmitted signals

Inactive Publication Date: 2004-06-01
AGILENT TECH INC
View PDF2 Cites 22 Cited by
  • Summary
  • Abstract
  • Description
  • Claims
  • Application Information

AI Technical Summary

Benefits of technology

It has been discovered that by intelligently selecting locations at which the relationship between variable quantities are to be measured, a diagram that accurately represents the relationship between the variable quantities can be efficiently constructed. Intelligent selection of the measurement points may, for example, permit a reduction in the number of measurement points required to accurately construct the diagram, and may permit the diagram to be constructed in less time than by conventional diagram construction procedures.

Problems solved by technology

In communications systems, a number of factors can contribute to a degradation in the quality of a transmitted signal.

Method used


Image

  • Intelligent test point selection for bit error rate tester-based diagrams
  • Intelligent test point selection for bit error rate tester-based diagrams
  • Intelligent test point selection for bit error rate tester-based diagrams

Examples


Embodiment Construction

Embodiments in accordance with the present invention provide a method and apparatus for constructing diagrams representing the relationship between variable quantities by which accurate diagrams can be constructed in a reduced amount of time using a limited number of measurement points as compared to conventional diagram construction procedures.

Prior to presenting the detailed description, it will be useful to define several terms that are utilized herein to facilitate a clear understanding of the present invention.

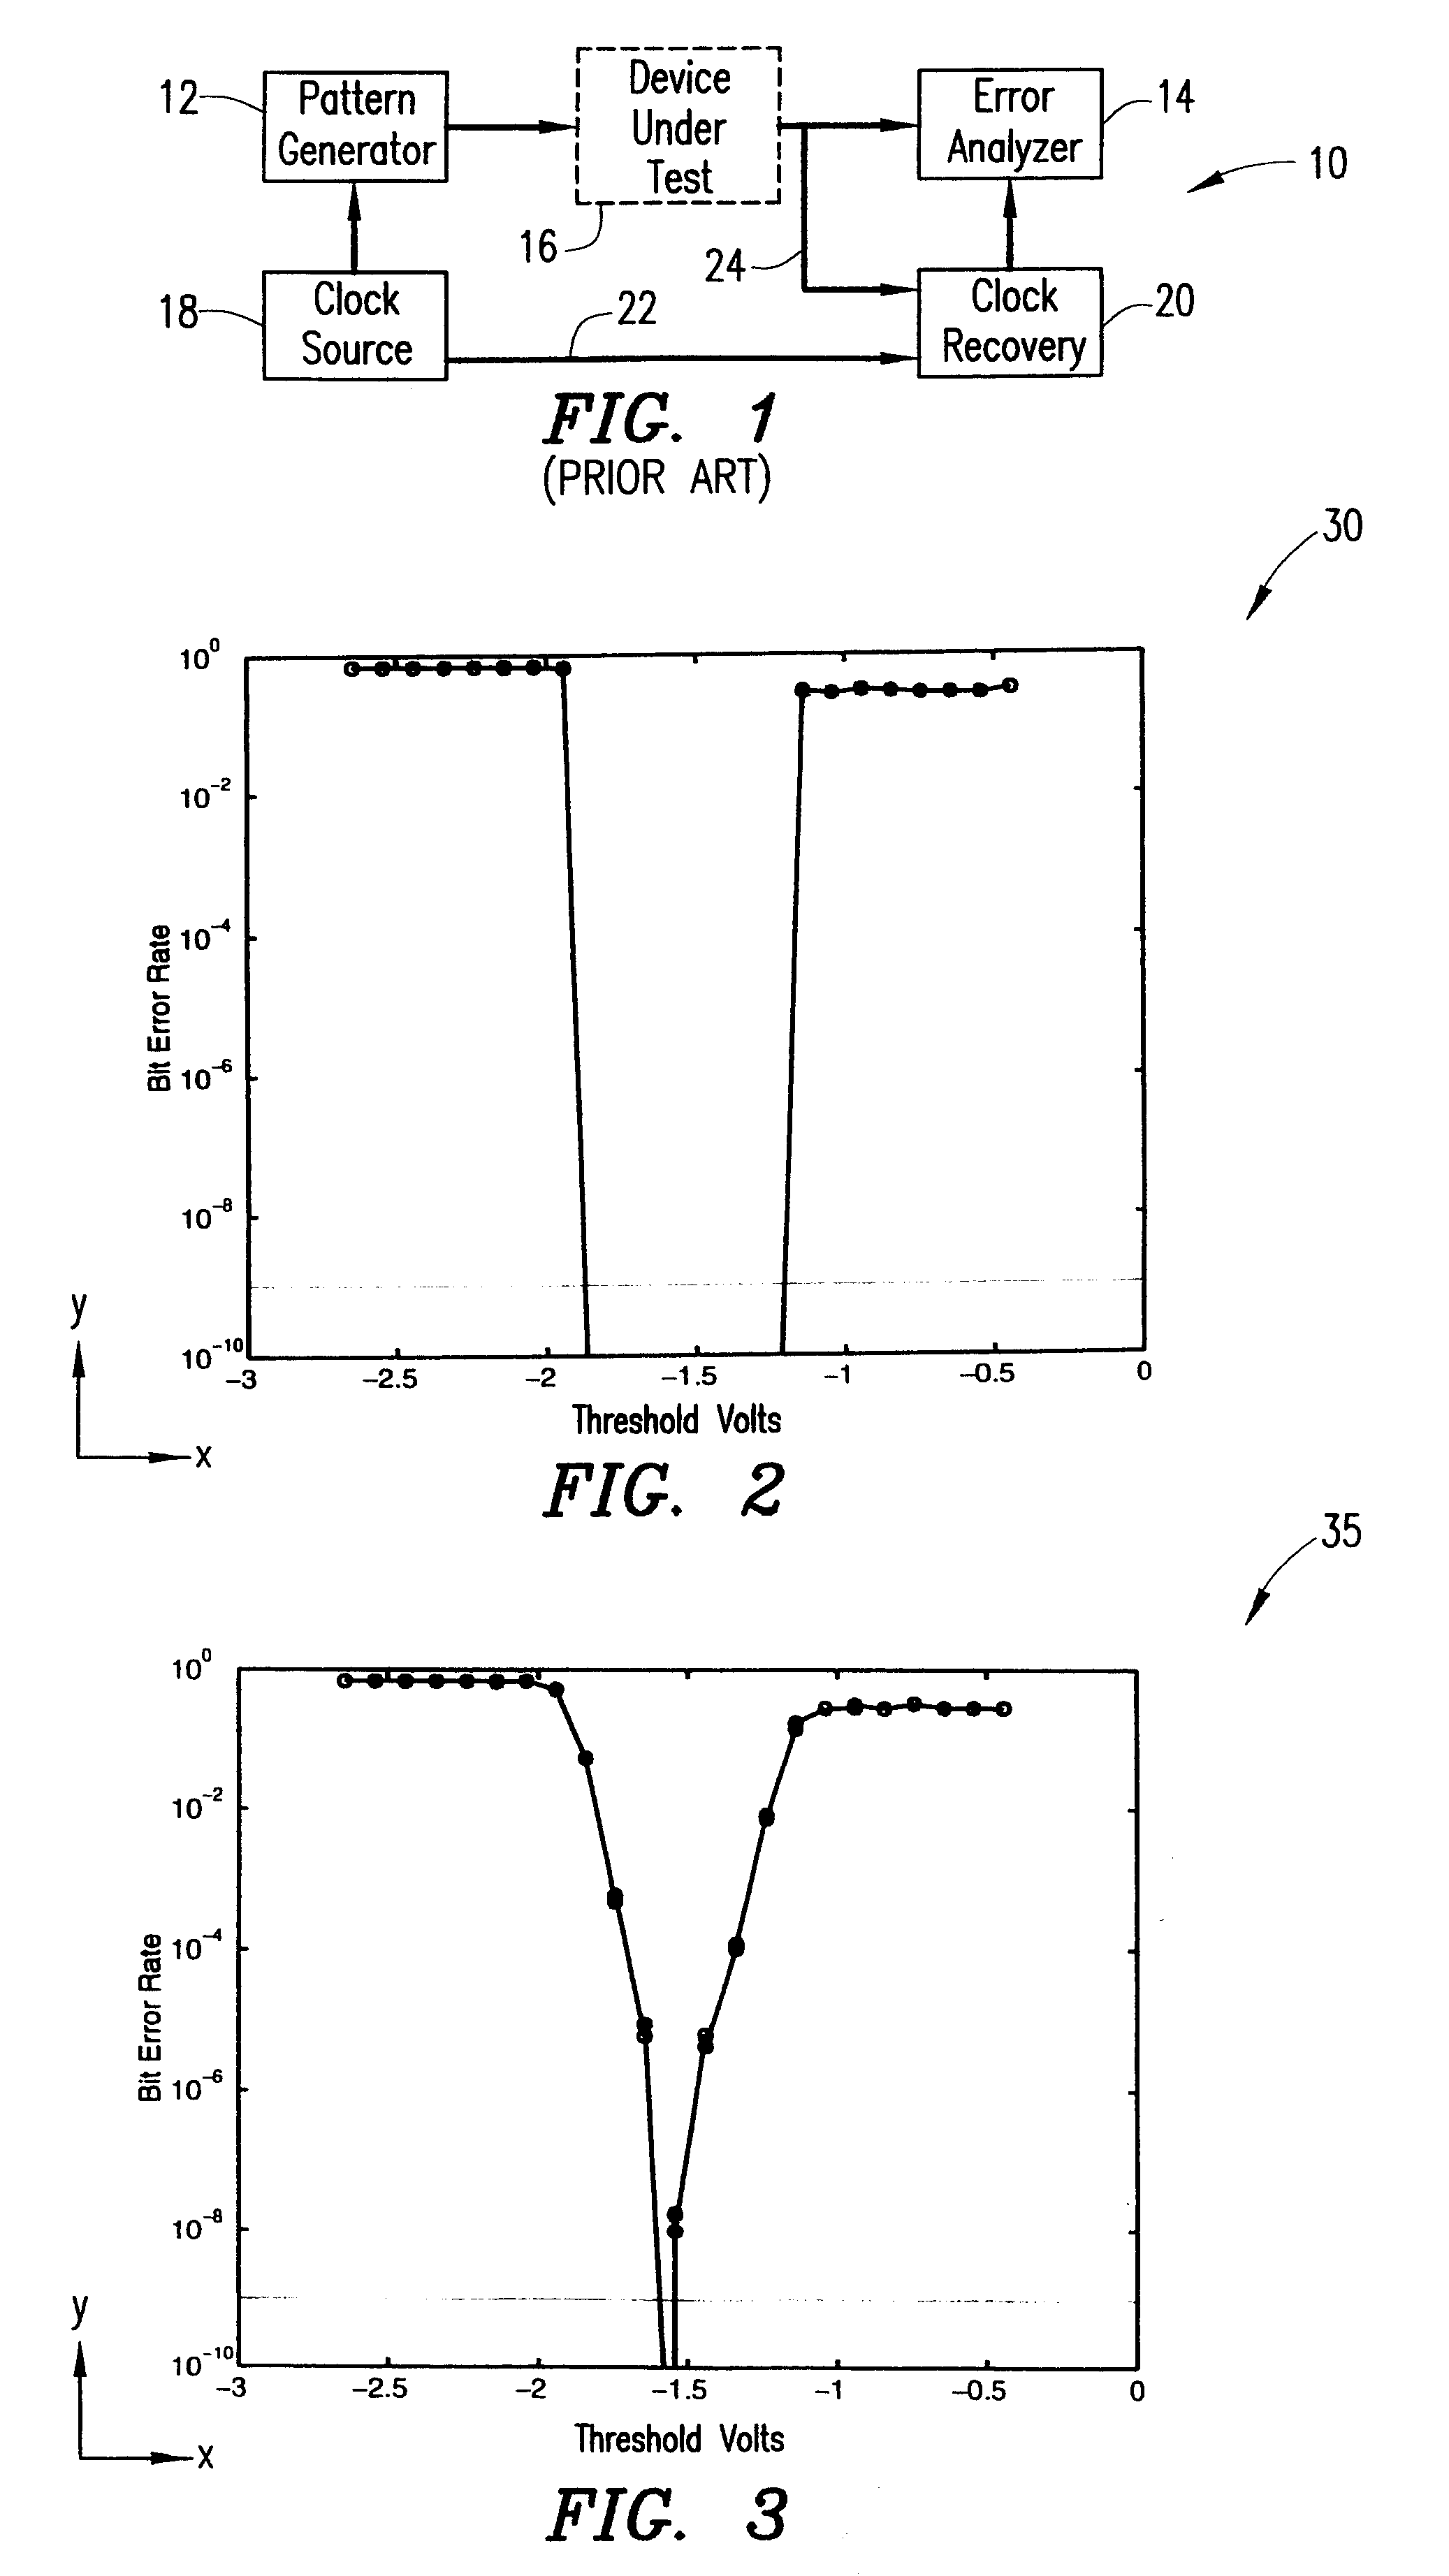
BER: Bit Error Rate / Bit Error Ratio. Essentially, a measure of the number of received bits in error divided by the total number of received bits.

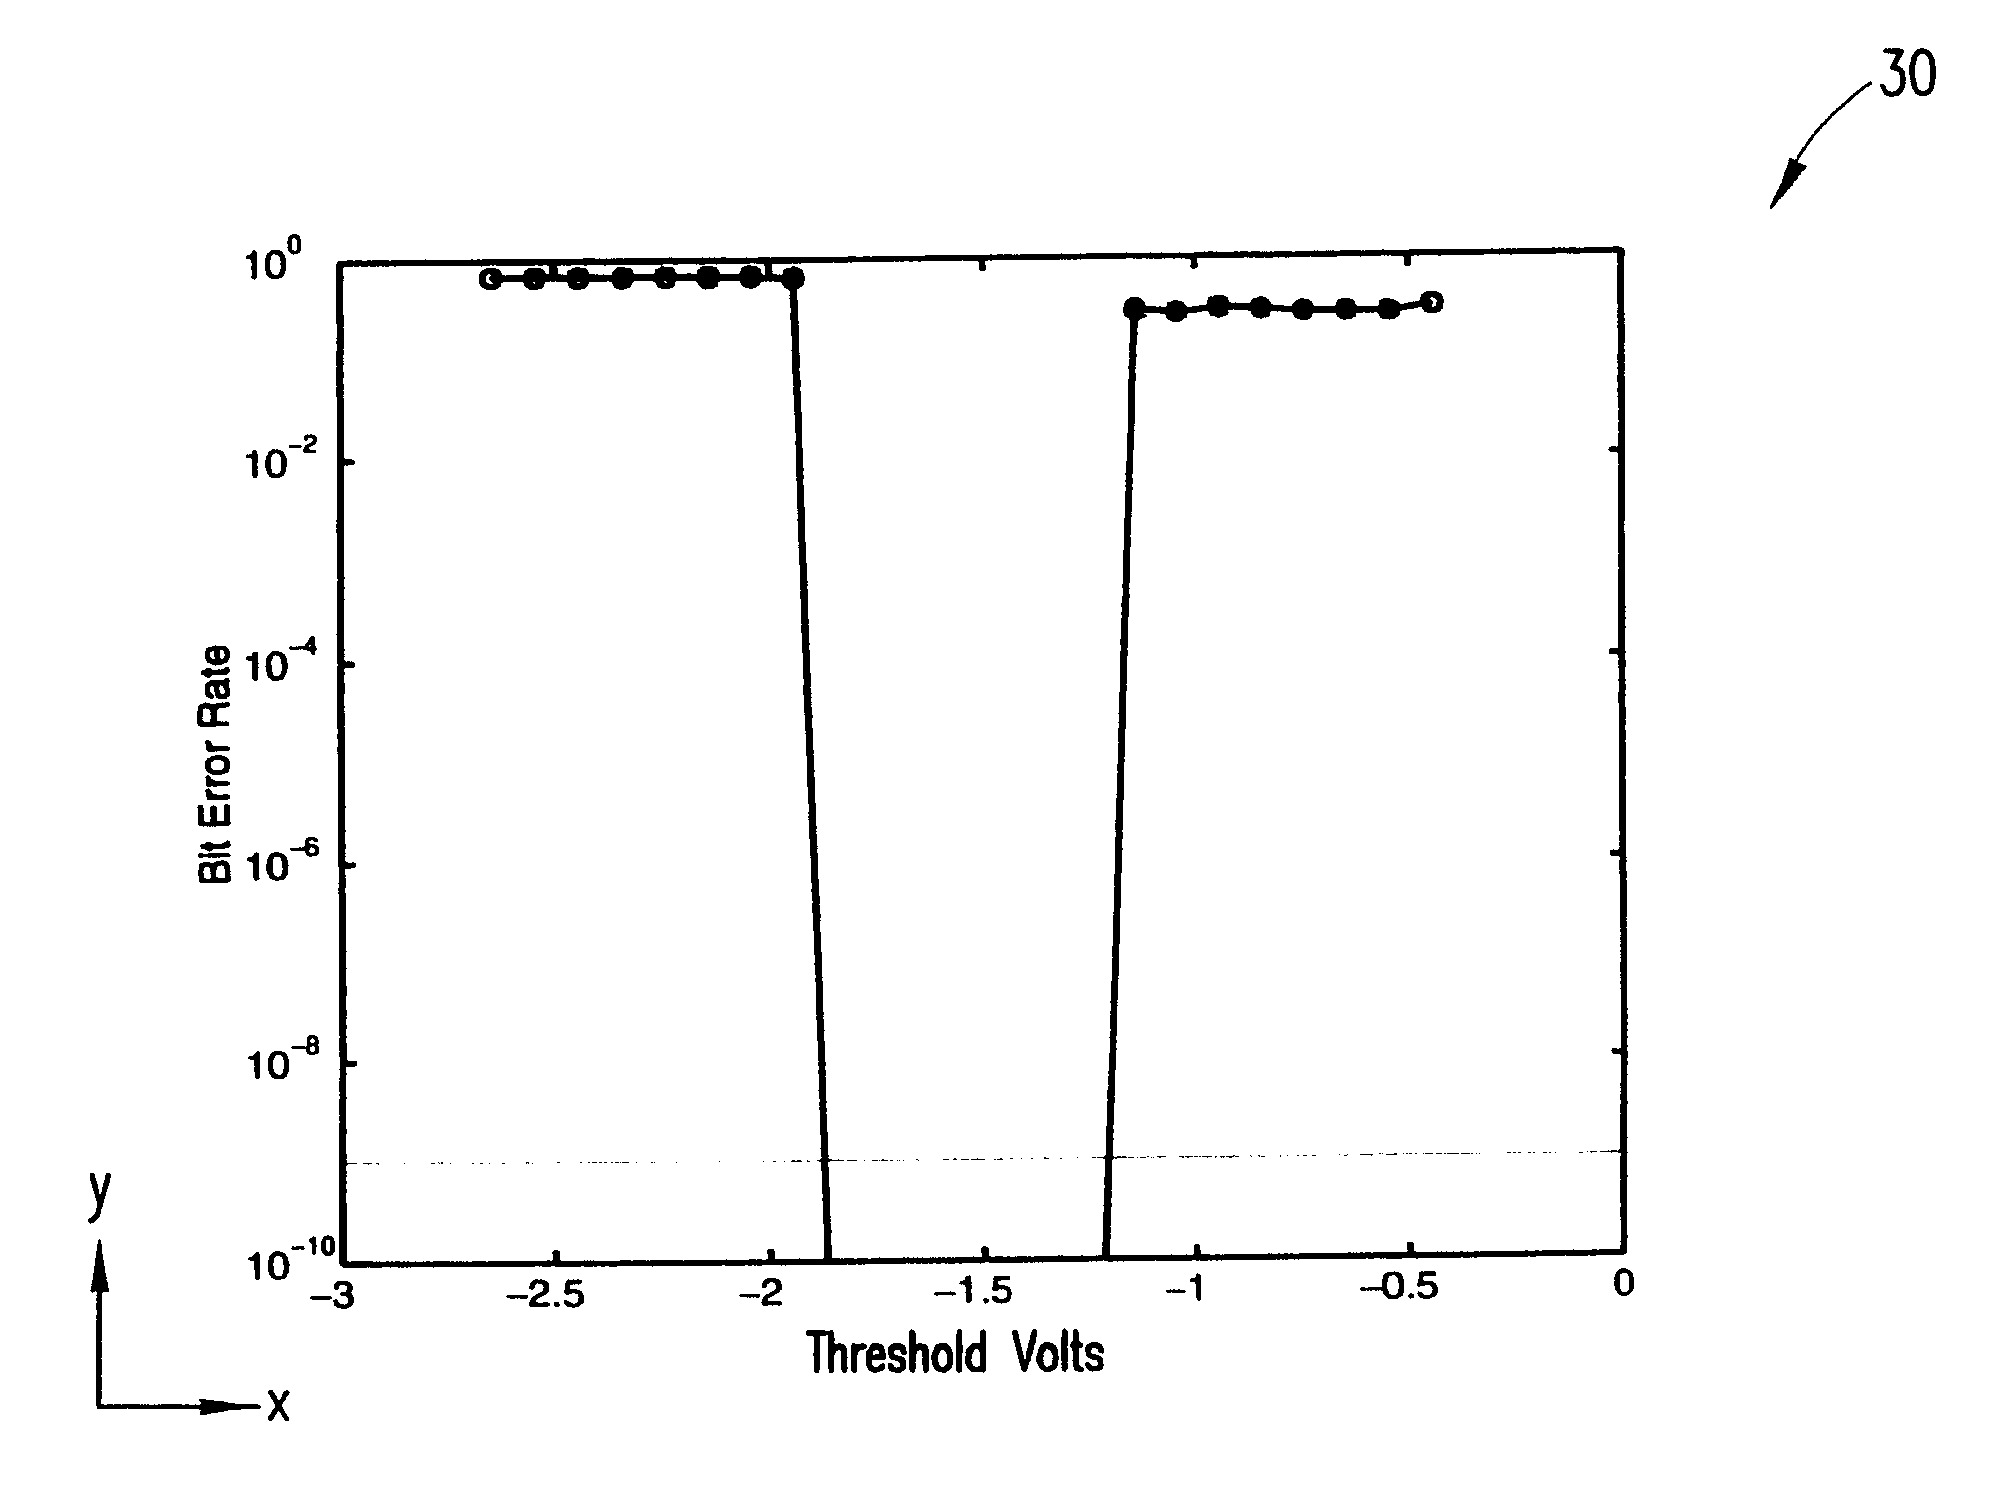
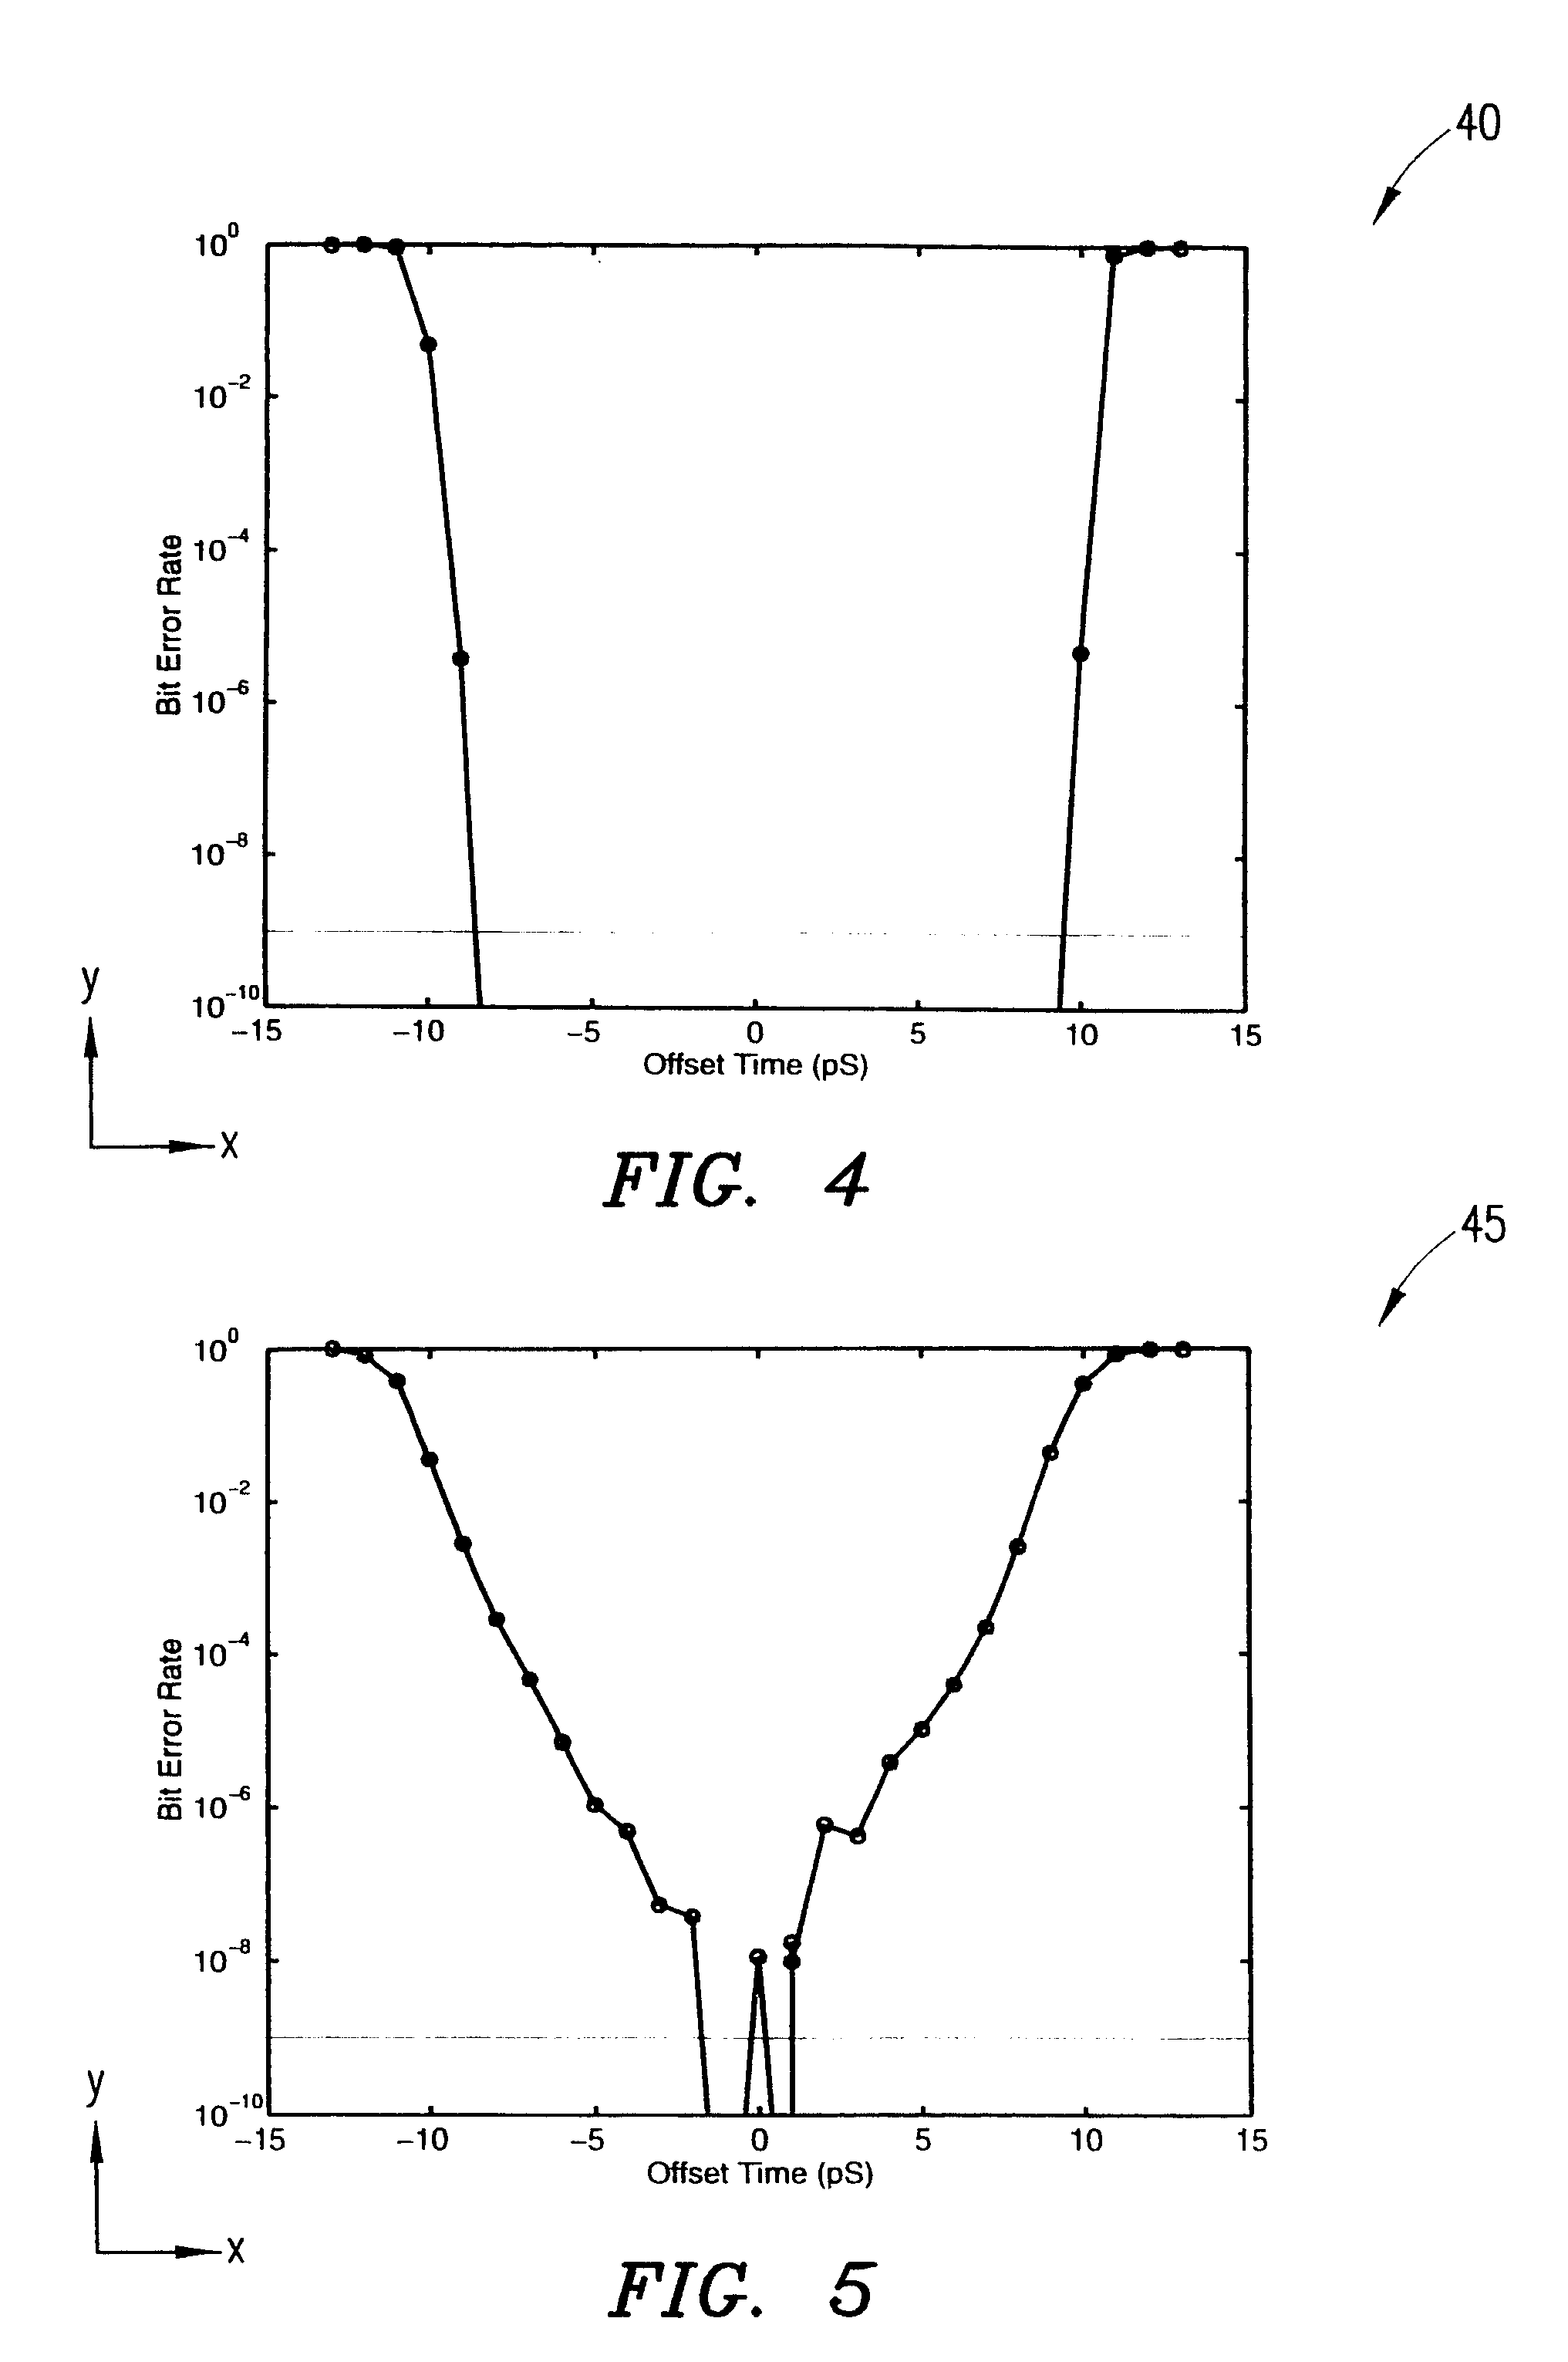
Eye Diagram / Eye Map / Eye Contour: A three-dimensional map of bit error ratio / rate values versus two control variables. Traditional Eye Diagrams are made using oscilloscopes. On digital oscilloscopes, a two-dimensional plot is generated by triggering the scope to the data (or a clock derived from the data) and using the extended pe...


PUM


Abstract

Method and apparatus for constructing diagrams representing the relationship between variable quantities. According to the method, at least one first measurement point representing the relationship between the variable quantities is provided for initially constructing the diagram. Thereafter, at least one location is selected at which the relationship between the variable quantities is to be measured, the at least one location being selected as a function of the at least one measurement point. The relationship between the variable quantities is then measured at the at least one location to provide at least one additional measurement point for further constructing the diagram. The invention permits diagrams, such as V Curve diagrams, Bathtub Curve diagrams and Eye Diagrams, to be constructed in less time and using fewer measurement points than conventional diagram construction procedures.

Description

1. Technical Field of the InventionThe present invention relates generally to the construction of diagrams representing the relationship between variable quantities; and, more particularly, to a method and apparatus for constructing diagrams representing the relationship between the bit error rate of a digital signal and one or more other variable quantities.2. Description of Related ArtIn communications systems, a number of factors can contribute to a degradation in the quality of a transmitted signal. For example, the quality of a signal can be degraded as a result of one or more of mechanisms for modulating the signal, transmitting the signal and detecting the signal. By evaluating signal degradation in a communications system, the performance of a particular system can be verified and information obtained from the evaluation can be utilized in the development of new systems.Bit Error Rate Testers (BERTs) are often used to evaluate the performance of digital communications system...

Claims


Application Information

Patent Timeline
Patent Type & Authority Patents(United States)
IPC IPC(8): G06F15/00G06M11/04G06M11/00H04L1/24H04L1/20
CPCH04L1/20
Inventor ABRAMOVITCH, DANIEL YVES
Owner AGILENT TECH INC
Why Eureka
Try Eureka