Display of code power levels and relationships of multiple spreading factor orthogonal codes in a CDMA signal

a technology of code power level and relationship, applied in the field of code division multiple access (cdma) signal analysis, can solve the problems of complicated display of cdp and difficulty in interpreting the results of cdp calculations

Inactive Publication Date: 2005-02-01
TEKTRONIX INC
View PDF3 Cites 19 Cited by
  • Summary
  • Abstract
  • Description
  • Claims
  • Application Information

AI Technical Summary

Problems solved by technology

Newer CDMA systems, such as cdma2000, now specify use of codes of varying spreading factors, i.e., of different lengths, which complicates the display of CDP.
Both of these factors cause difficulty in interpreting the results of CDP calculations when codes of different spreading factor values are present.

Method used


Image

  • Display of code power levels and relationships of multiple spreading factor orthogonal codes in a CDMA signal
  • Display of code power levels and relationships of multiple spreading factor orthogonal codes in a CDMA signal
  • Display of code power levels and relationships of multiple spreading factor orthogonal codes in a CDMA signal

Examples


Embodiment Construction

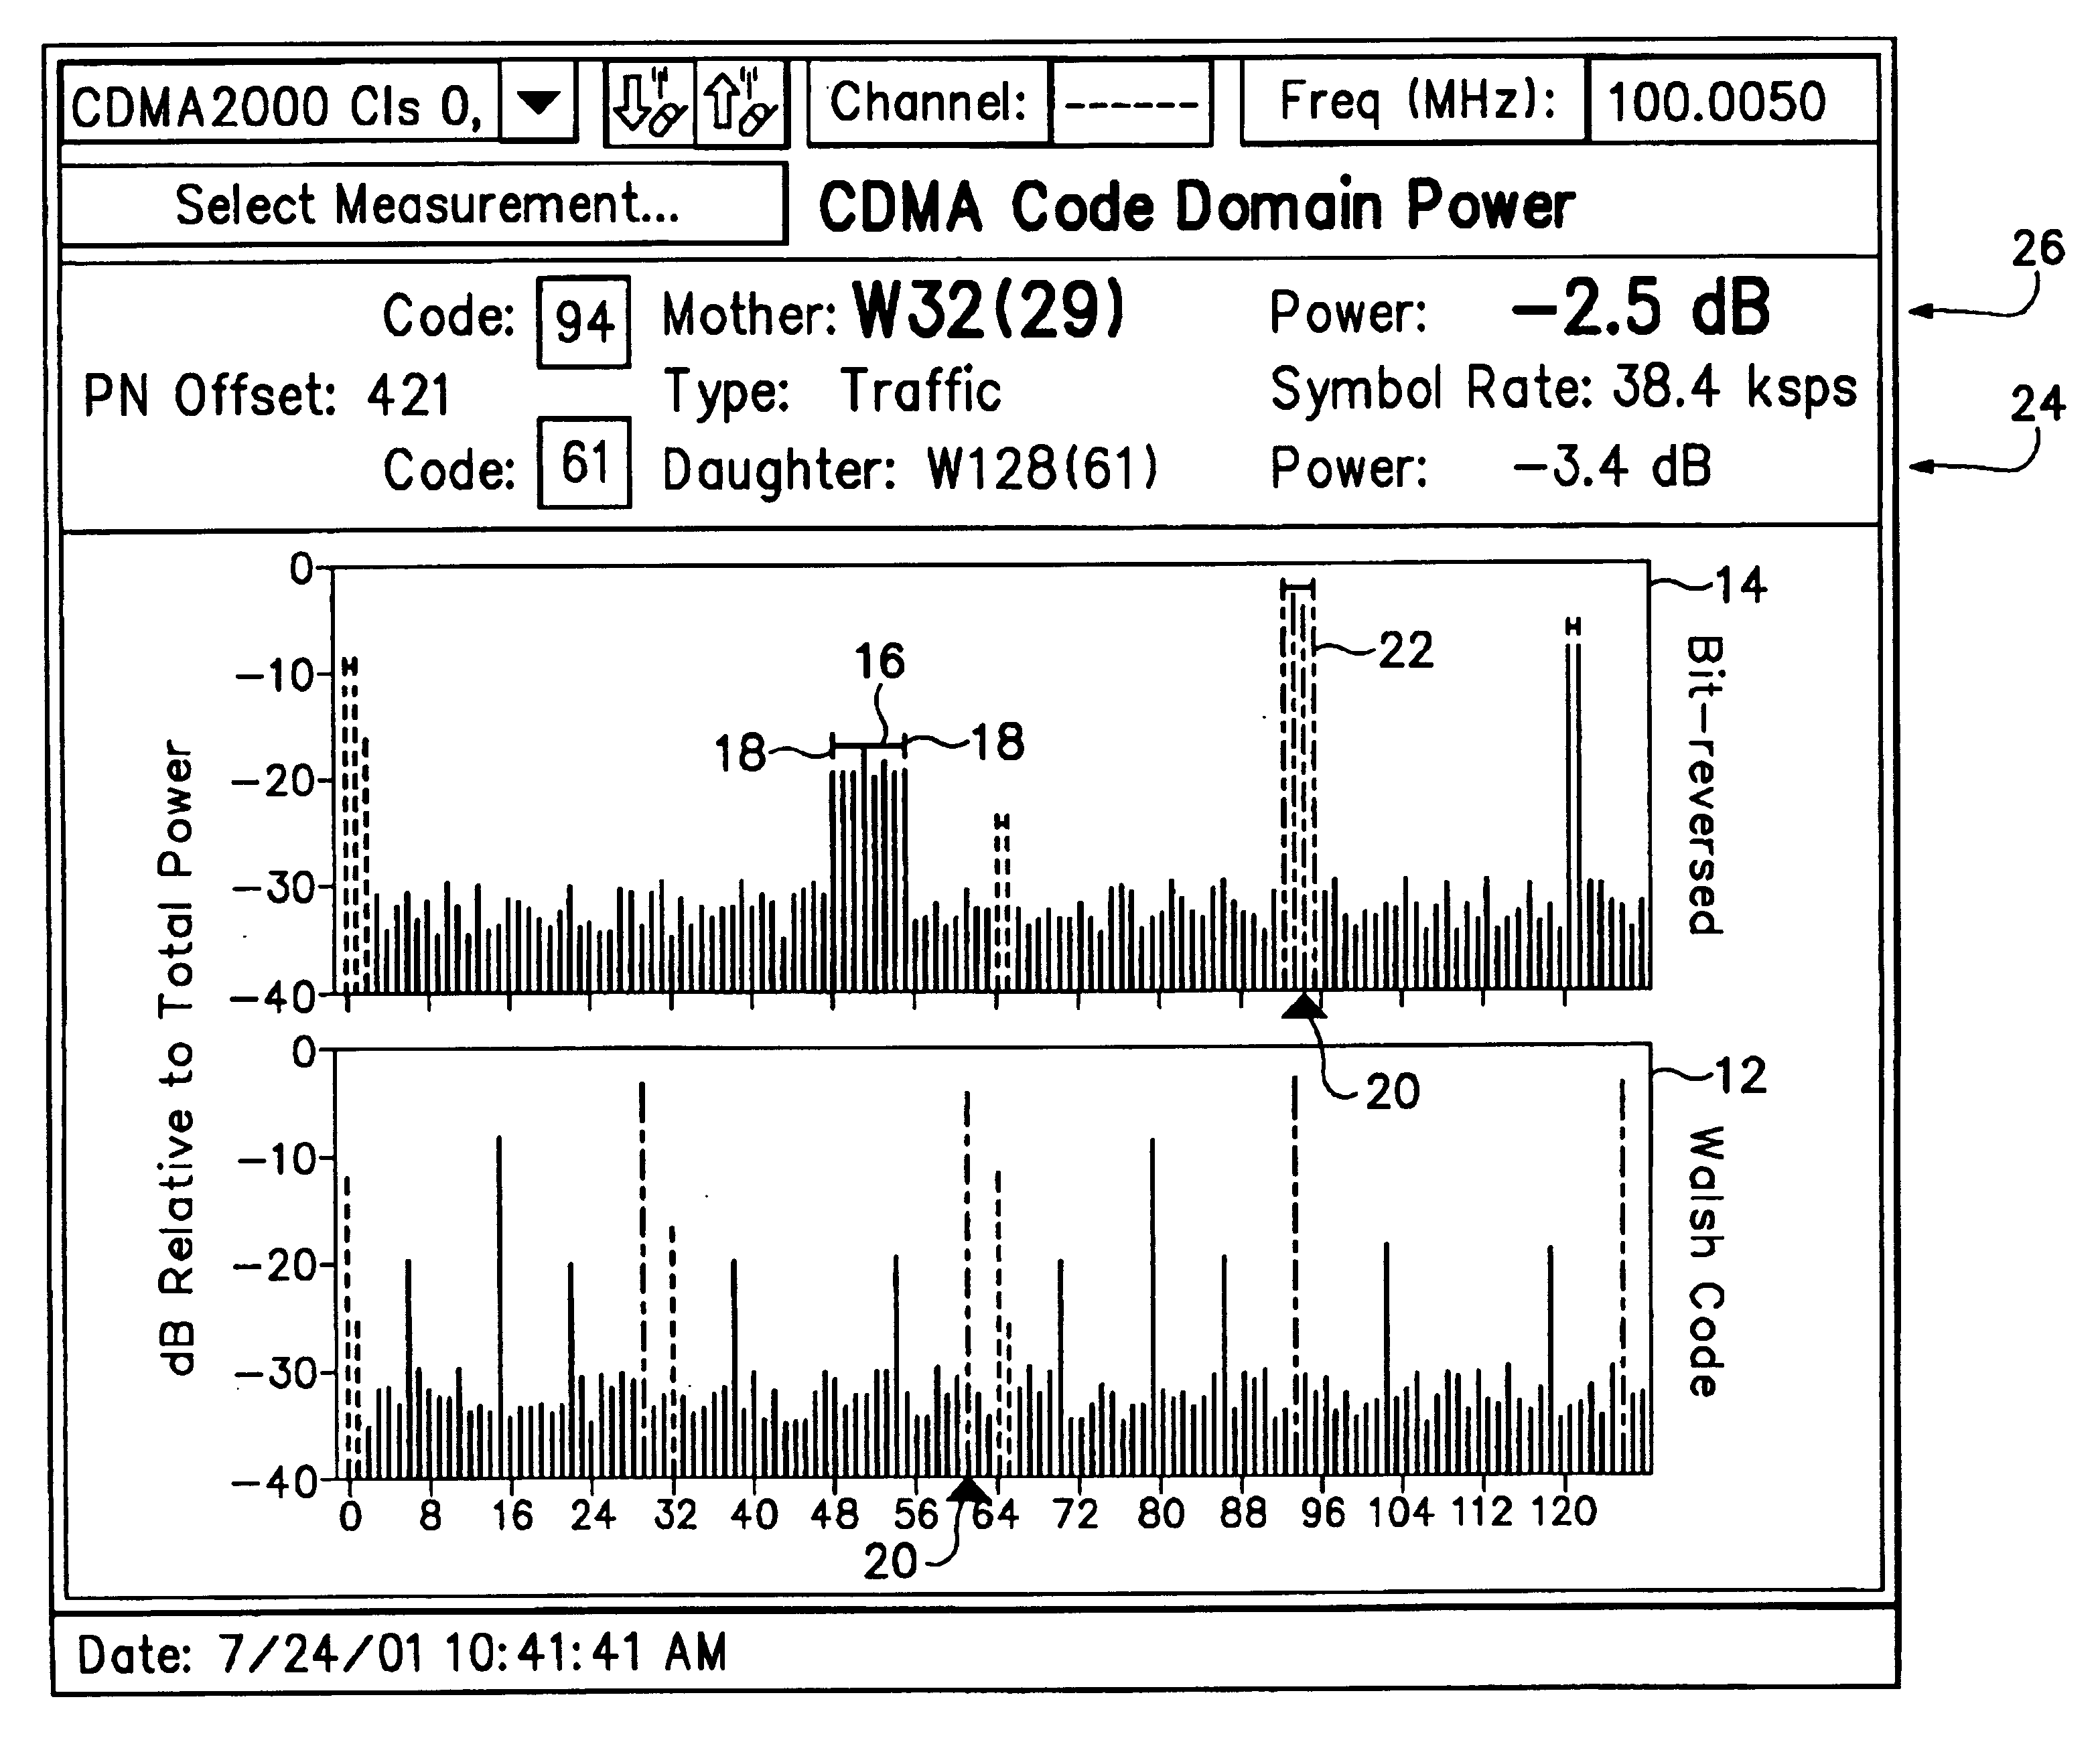
Referring now to FIG. 1 two code graphs 12, 14 are shown, each similar to a traditional code domain power (CDP) display for single spreading factor (SF) signals. For signals using Walsh or similar codes for orthogonal code spreading, such as cdma2000, both code graphs 12, 14 are used. For systems using Orthogonal Variable Spreading Factor (OVSF) codes, such as WCDMA, only one traditional code graph 12 is needed. In both cases one code graph 12 is the traditional plot of CDP for all codes at the maximum spreading factor of the system using linear code index order. However with Walsh code spreading this graph 12, referred to as a Walsh Code graph for cdma2000, shows lower spreading factor codes split into multiple sub-codes at various spacings. Then the other code graph 14, if needed because the sub-codes are not contiguous in the first code graph 12 as in cdma2000, shows the same CDP information but with the order of display of code power values reordered by “bit-reversing” the code ...


PUM


Abstract

A display of code power levels and relationships of multiple spreading factor orthogonal codes in a code division multiple access (CDMA) signal has a first code graph of code domain power (CDP) for all the codes at the largest code spreading factor that includes all codes at all spreading factors plotted in a linear code indexing order and a second graph of CDP where the codes are plotted in bit-reversed order to group together the sub-codes of each code of lower spreading factor. Markers on each graph are tied together such that movement of one marker on one graph to a particular code value causes the other marker on the other graph to move to the corresponding code value. The sub-codes related to a particular code bar in the graphs indicated by the markers may be differentiated by using grey scale or color variations. A base code power level indicator, which may be in the form of a horizontal bar on the bit-reversed order graph spanning the group of sub-codes corresponding to a particular spreading factor, provides a power indication for the base code.

Description

BACKGROUND OF THE INVENTIONThe present invention relates to code division multiple access (CDMA) signal analysis, and more particularly to a display of code power levels and relationships of multiple spreading factor orthogonal codes in a CDMA signal.In a CDMA signal using orthogonal codes, all of which are the same length (also known as spreading factor), the amount of power present in each code, i.e., code domain power (CDP), may be displayed by plotting the power in each code versus the code number index on a two-dimensional graph. This is a conventional and well-understood manner using linear index code order for displaying CDP information. Newer CDMA systems, such as cdma2000, now specify use of codes of varying spreading factors, i.e., of different lengths, which complicates the display of CDP. Specifically codes of smaller spreading factor when displayed in a CDP graph appropriate for the largest spreading factor code appear dispersed into multiple sub-codes at fixed distance...

Claims


Application Information

Patent Timeline
Patent Type & Authority Patents(United States)
IPC IPC(8): H04B1/707H04B17/00H04J11/00H04J13/00
CPCH04B1/707H04J13/0048H04J13/0044H04B2201/70703H04B17/327H04B17/23
Inventor BRYANT, CRAIG D.KUNTZ, THOMAS L.ENGHOLM, KATHRYN A.
Owner TEKTRONIX INC
Why Eureka
Try Eureka