Method and apparatus for performing eye diagram measurements

a technology of eye diagram and eye diagram, which is applied in the direction of noise figure or signal-to-noise ratio measurement, instruments, pulse characteristics measurement, etc., can solve the problems that logic analyzers have not been able to generate eye diagrams, and the scopes are not up to the task of performing the function of high-speed digital signals of today's high-speed digital signals

Inactive Publication Date: 2005-03-22
AGILENT TECH INC
View PDF8 Cites 19 Cited by
  • Summary
  • Abstract
  • Description
  • Claims
  • Application Information

AI Technical Summary

Benefits of technology

A logic analyzer can be equipped to perform eye diagram measurements by equipping each SUT clock signal input and each SUT data signal input channel with individually variable delays in their respective signal paths. If the range of signal delay is, say, n-many SUT clock cycles, then the SUT clock signal delay might be set at about n/2. For each data channel that is to undergo eye diagram measurement, there is specified some combination of a point in time relative to an instance of the delayed clock signal (data signal delay) and a voltage threshold. The specified combination (data signal delay, threshold) is essentially a location on an eye diagram, although the trace may or may not ever go through that location. There is also specified how many times this specified combination will be watched before another such combination is invoked. As the SUT runs, a particular specified combination will occur always, sometimes or never. A counter counts the number of SUT clock cycles used as instances of the reference for the eye diagram, and another counter counts the number of times the specified combination of conditions was met (hereinafter called “hits”). After wa

Problems solved by technology

Although eye diagrams go back a long way and were originally made with analog 'scopes, such 'scopes are just not up to the task of performing that function with today's high speed digital signals, and need no

Method used


Image

  • Method and apparatus for performing eye diagram measurements
  • Method and apparatus for performing eye diagram measurements
  • Method and apparatus for performing eye diagram measurements

Examples


Embodiment Construction

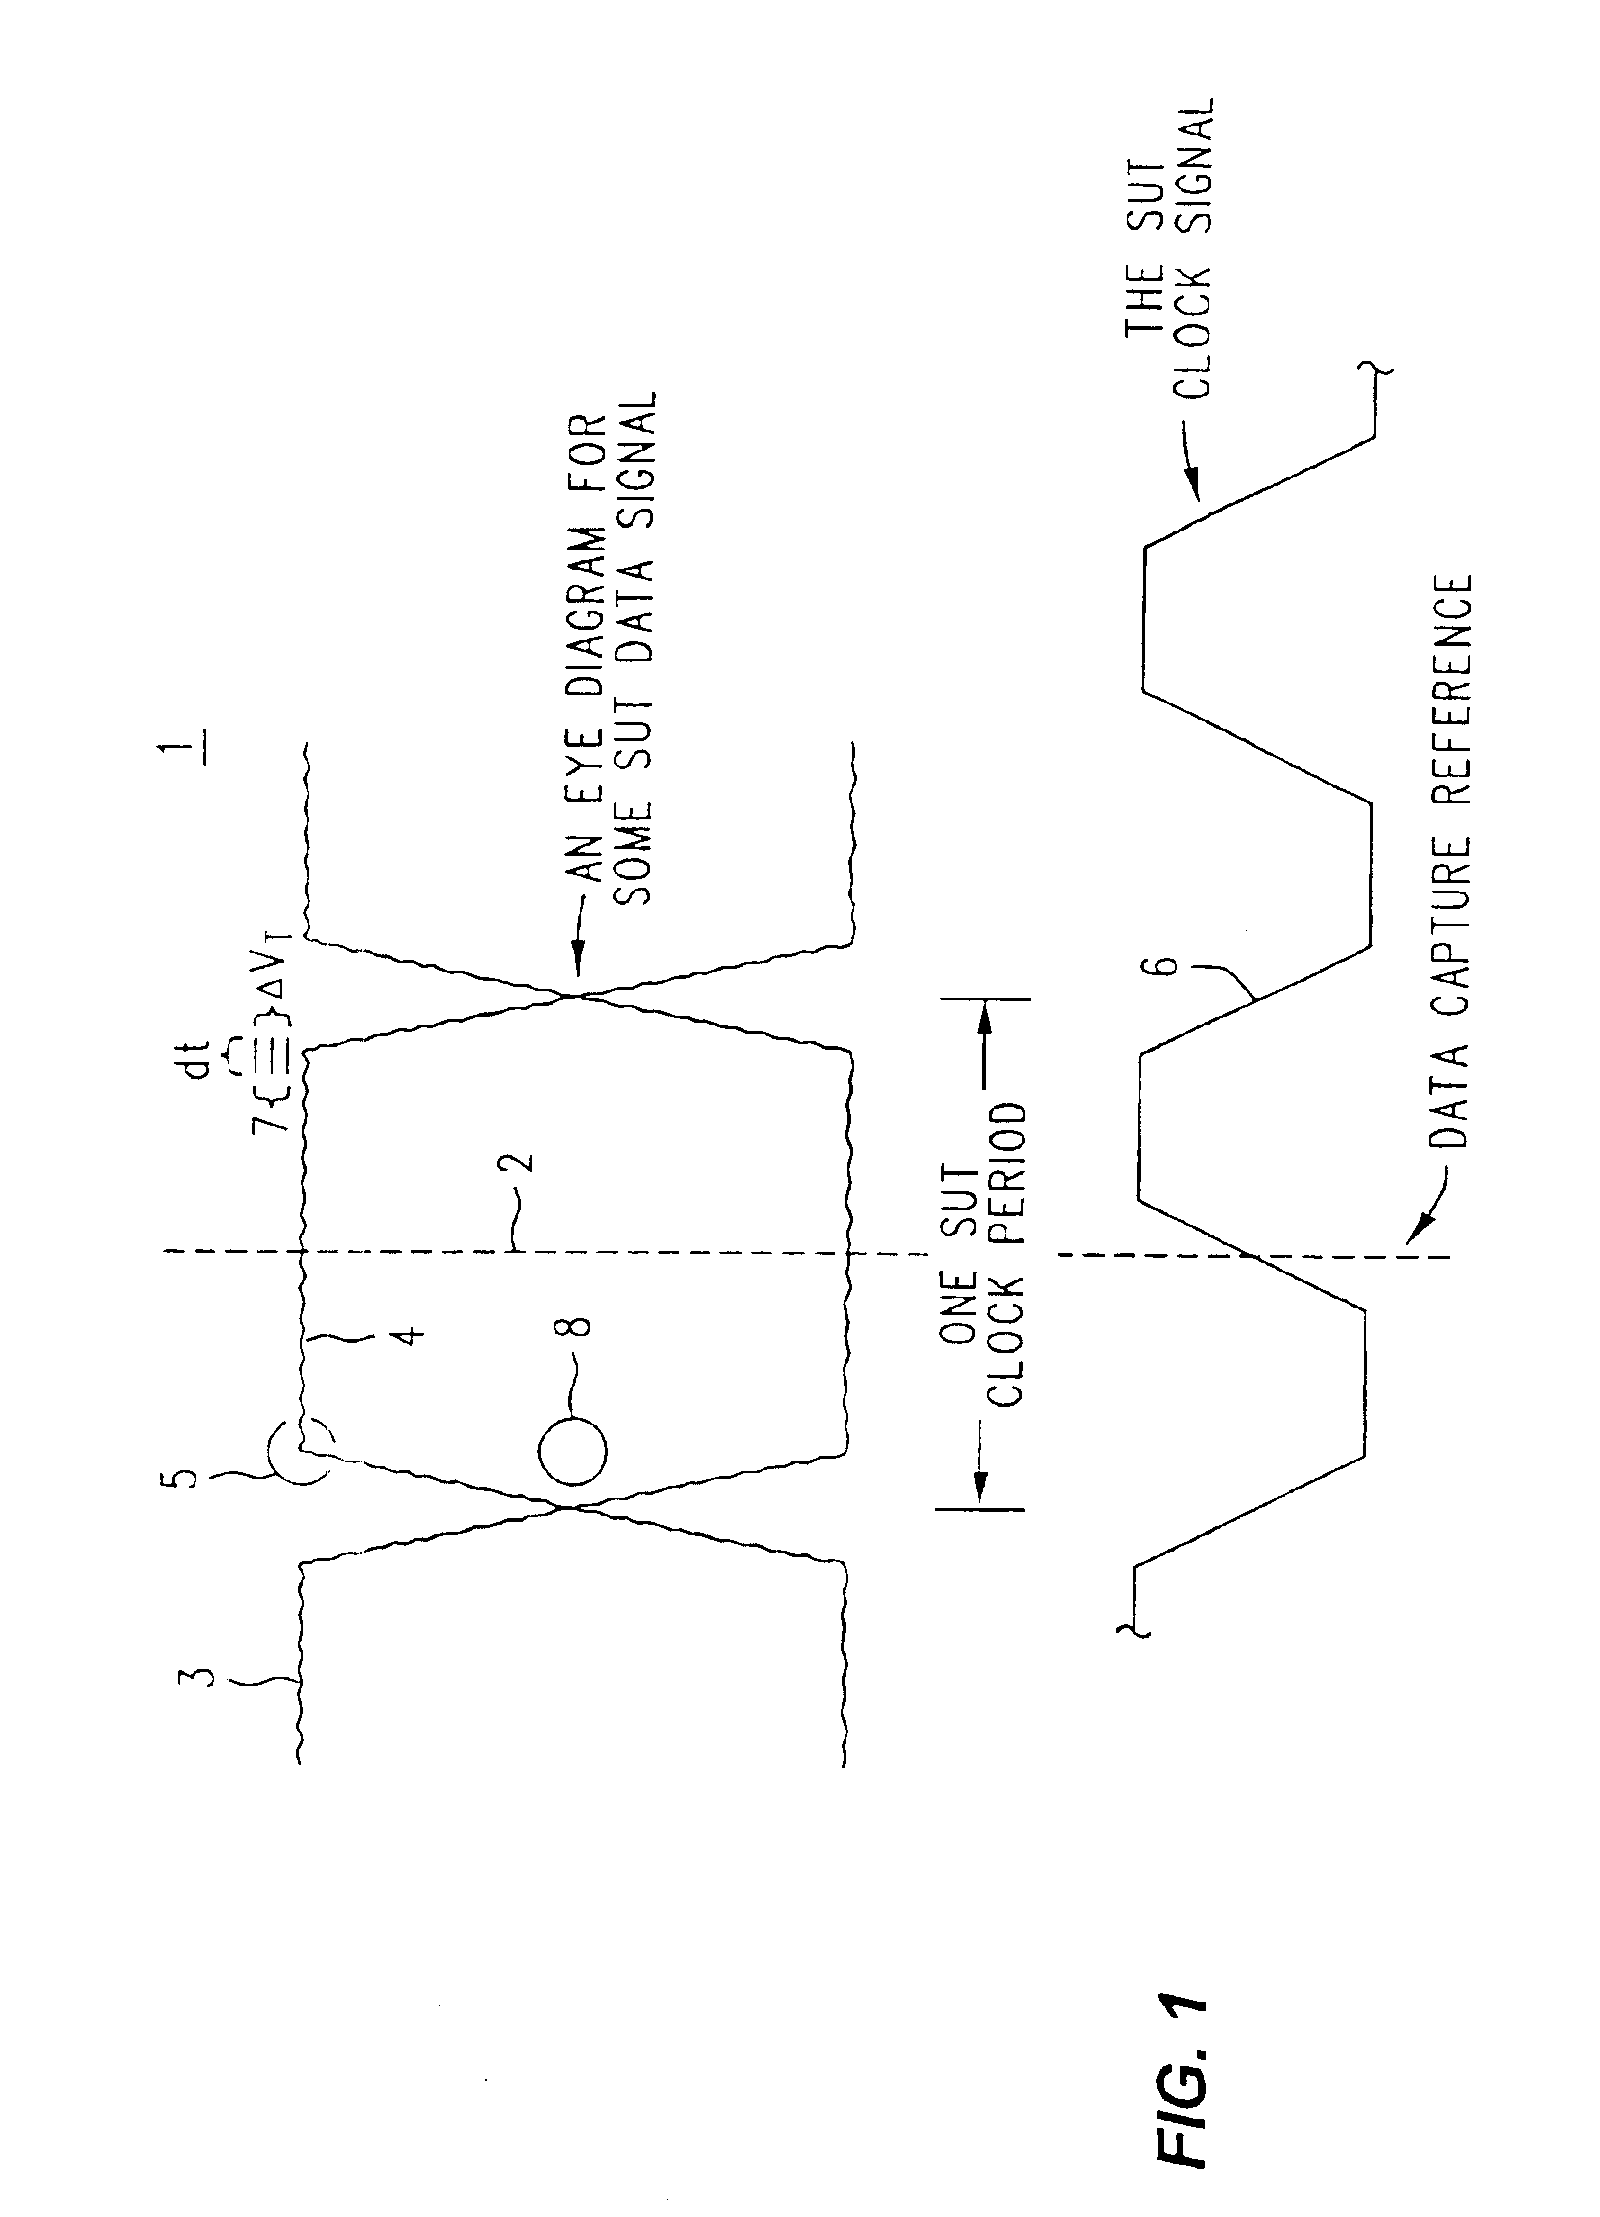
Refer now to FIG. 1, wherein is shown, for some SUT data signal (not shown), an eye diagram 1 composed of traces 3 and 4 presented in relation to a reference time 2. The reference time indicates when, in relation to an SUT clock signal 6, data is captured. As will become apparent as the discussion proceeds, the three vertically stacked horizontal lines 7 play an explanatory part in describing how the eye diagram of FIG. 1 is measured and produced. We shall have much more to say about this later, but for now it is sufficient to note that the vertical distance between the horizontal lines 7 represents a change between successive threshold voltages VT for the comparator to which the input data signal is applied. We call that change in threshold voltage ΔVT. It will be noted that the horizontal line segments 7 have horizontal length. That length represents a time interval, or dt. The duration of the time interval dt can be specified, as can when it starts relative to the data capture re...


PUM


Abstract

An eye diagram analyzer equips each SUT data and clock signal input channel with individually variable delays in their respective paths. For a range of signal delay of n-many SUT clock cycles, the SUT clock signal delay might be set at about n/2. For each data channel there is specified a point in time relative to an instance of the delayed clock signal (data signal delay) and a voltage threshold. The specified combination (data signal delay, threshold and which channel) is a location on an eye diagram, although the trace may or may not ever go through that location. A counter counts the number of SUT clock cycles used as instances of the reference for the eye diagram, and another counter counts the number of times the specified combination of conditions was met (“hits”). After watching a specified combination for the requisite length of time or number of events, the number of SUT clock cycles involved and the associated number of hits are stored in memory using a data structure indexed by the components of the specified combination (data signal delay, threshold). Next, a new combination of data signal delay and threshold is specified and a measurement taken and recorded in the data structure. The process is repeated until all possible combinations within a stated range of data signal delay and threshold voltage (using specified resolution/step sizes for delay and voltage) have been investigated. As this process proceeds under the control of firmware within the logic analyzer, other firmware can be examining the data structure and generating a partial eye diagram visible on a display, and that will be complete soon after the measurement itself is finished.” has been changed to “An eye diagram analyzer equips each SUT data and clock signal input channel with individually variable delays in their respective paths. For a range of signal delay of n-many SUT clock cycles, the SUT clock signal delay might be set at about n/2. For each data channel there is specified a point in time relative to an instance of the delayed clock signal (data signal delay) and a voltage threshold. The specified combination (data signal delay, threshold and which channel) is a location on an eye diagram, although the trace may or may not ever go through that location.

Description

BACKGROUND OF THE INVENTIONEye diagrams are a conventional format for representing parametric information about signals, and especially digital signals. We shall refer to an item of test equipment or a measurement circuit arrangement that creates an eye diagram as an eye diagram tester, whether it is found in an oscilloscope, a BERT (Bit Error Rate Tester), or, as we shall show how, in a logic analyzer. Scopes and BERTs each have their own types of circuit architecture that they use to measure eye diagrams, and thus belong to the class of Eye Diagram Testers. The method and circuit apparatus to be disclosed herein is different than that used in scopes and BERTs, and is especially suitable for use within a logic analyzer. We shall call this different method and circuit apparatus an Eye Diagram Analyzer, or EDA for short. By the definitions above, an EDA is a particular type of eye diagram tester.Although the method and apparatus for an EDA to be described herein is especially suitabl...

Claims


Application Information

Patent Timeline
IPC IPC(8): H04L1/24
CPCH04L1/24
Inventor NYGAARD, JR., RICHARD A
Owner AGILENT TECH INC
Why Eureka
Try Eureka