Eureka AIR delivers breakthrough ideas for toughest innovation challenges, trusted by R&D personnel around the world.

System and method for analyzing and optimizing computer system performance utilizing observed time performance measures

Active Publication Date: 2005-11-01
LENOVO GLOBAL TECH INT LTD
View PDF7 Cites 16 Cited by
  • Summary
  • Abstract
  • Description
  • Claims
  • Application Information

AI Technical Summary

Benefits of technology

[0021]It is an object of the present invention to monitor and analyze computer o

Problems solved by technology

Frequently, the performance of the computer system or network is less than it could be because one or more of the components is not appropriate for application loading of the computer system (or a network or server).
As the systems get larger and more complex, these interactions become hard to define, model or predict.
Also, the relationships between the devices, and hence the capacity of the system becomes difficult to manage.
These systems are quite expensive to install and changes to the system involve a significant investment.
While an investment is desirable which will improve the performance of the computer system, some investments in improvements to the computer system would not be worthwhile since the performance of the overall system would not improve.
Hardware components restrict their speed or mode in the presence of buses or hardware components that are not capable of faster operation.
In general, hardware components having different characteristics that are coupled to the same PCI bus function properly, but the performance of the faster hardware components is degraded due to the lower bus frequency dictated by the slower hardware components.
For example, careless placement of a hardware adapter (e.g., mismatching speeds by placing a 33 MHz hardware adapter on a 133 MHz bus or mixing modes by placing a conventional mode hardware adapter on a PCI-X mode bus) may result in significant performance degradation.
A data processing system continues to function despite the less-than-optimum hardware component configuration, so problems with the configuration may only be evident during special circumstances (e.g., intervals of peak demand of the data processing system resources).
Even then, this approach is not reliable.
This requires a large amount of information to be input from the network and from the user.
Simulation programs are larger and more complex and hence much more expensive.
Simulation programs are also less accurate because the information utilized in the simulation usually cannot be kept up-to-date to accurately reflect the precise operational characteristics of the target system.
The active monitors that simulate the performance problems may not accurately represent what the applications will do on the network under actual operating conditions.
Active monitors also interfere with other traffic in the network and are therefore not appropriate for use at all times.
However, this technique focused on addition of new components and did not recommend reconfiguration changes to the existing system.

Method used


Image

  • System and method for analyzing and optimizing computer system performance utilizing observed time performance measures
  • System and method for analyzing and optimizing computer system performance utilizing observed time performance measures
  • System and method for analyzing and optimizing computer system performance utilizing observed time performance measures

Examples


Embodiment Construction

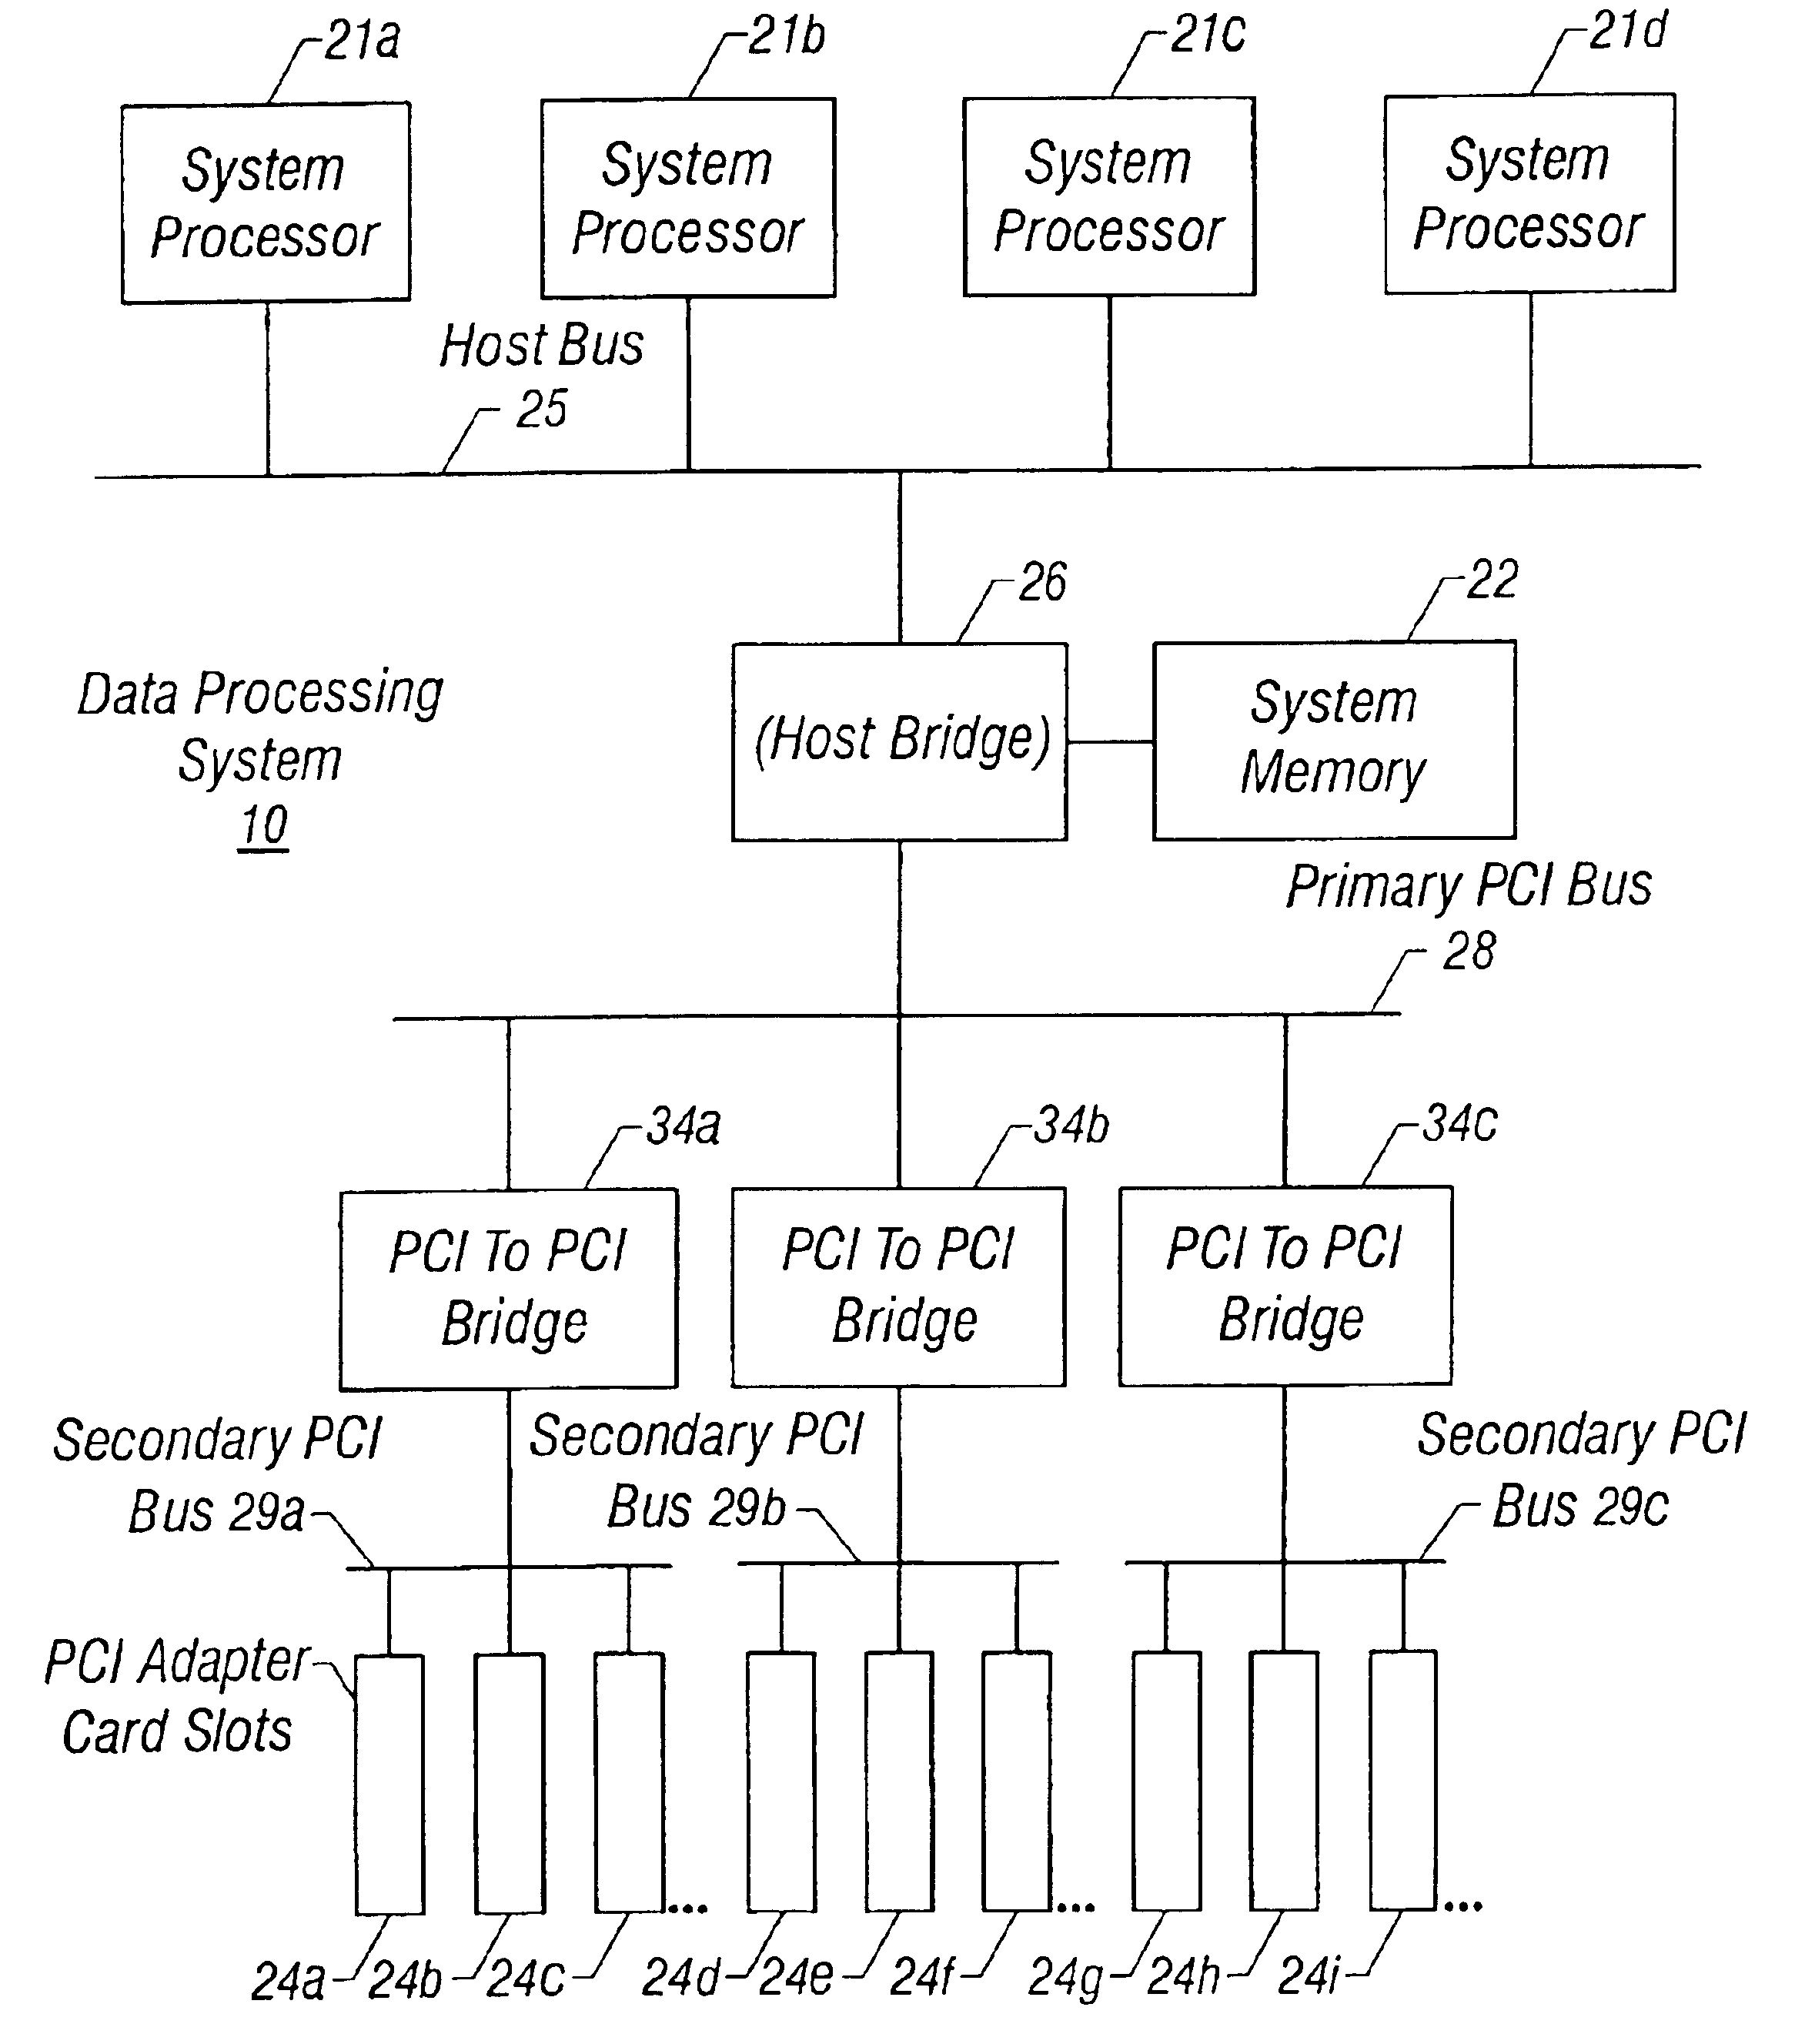
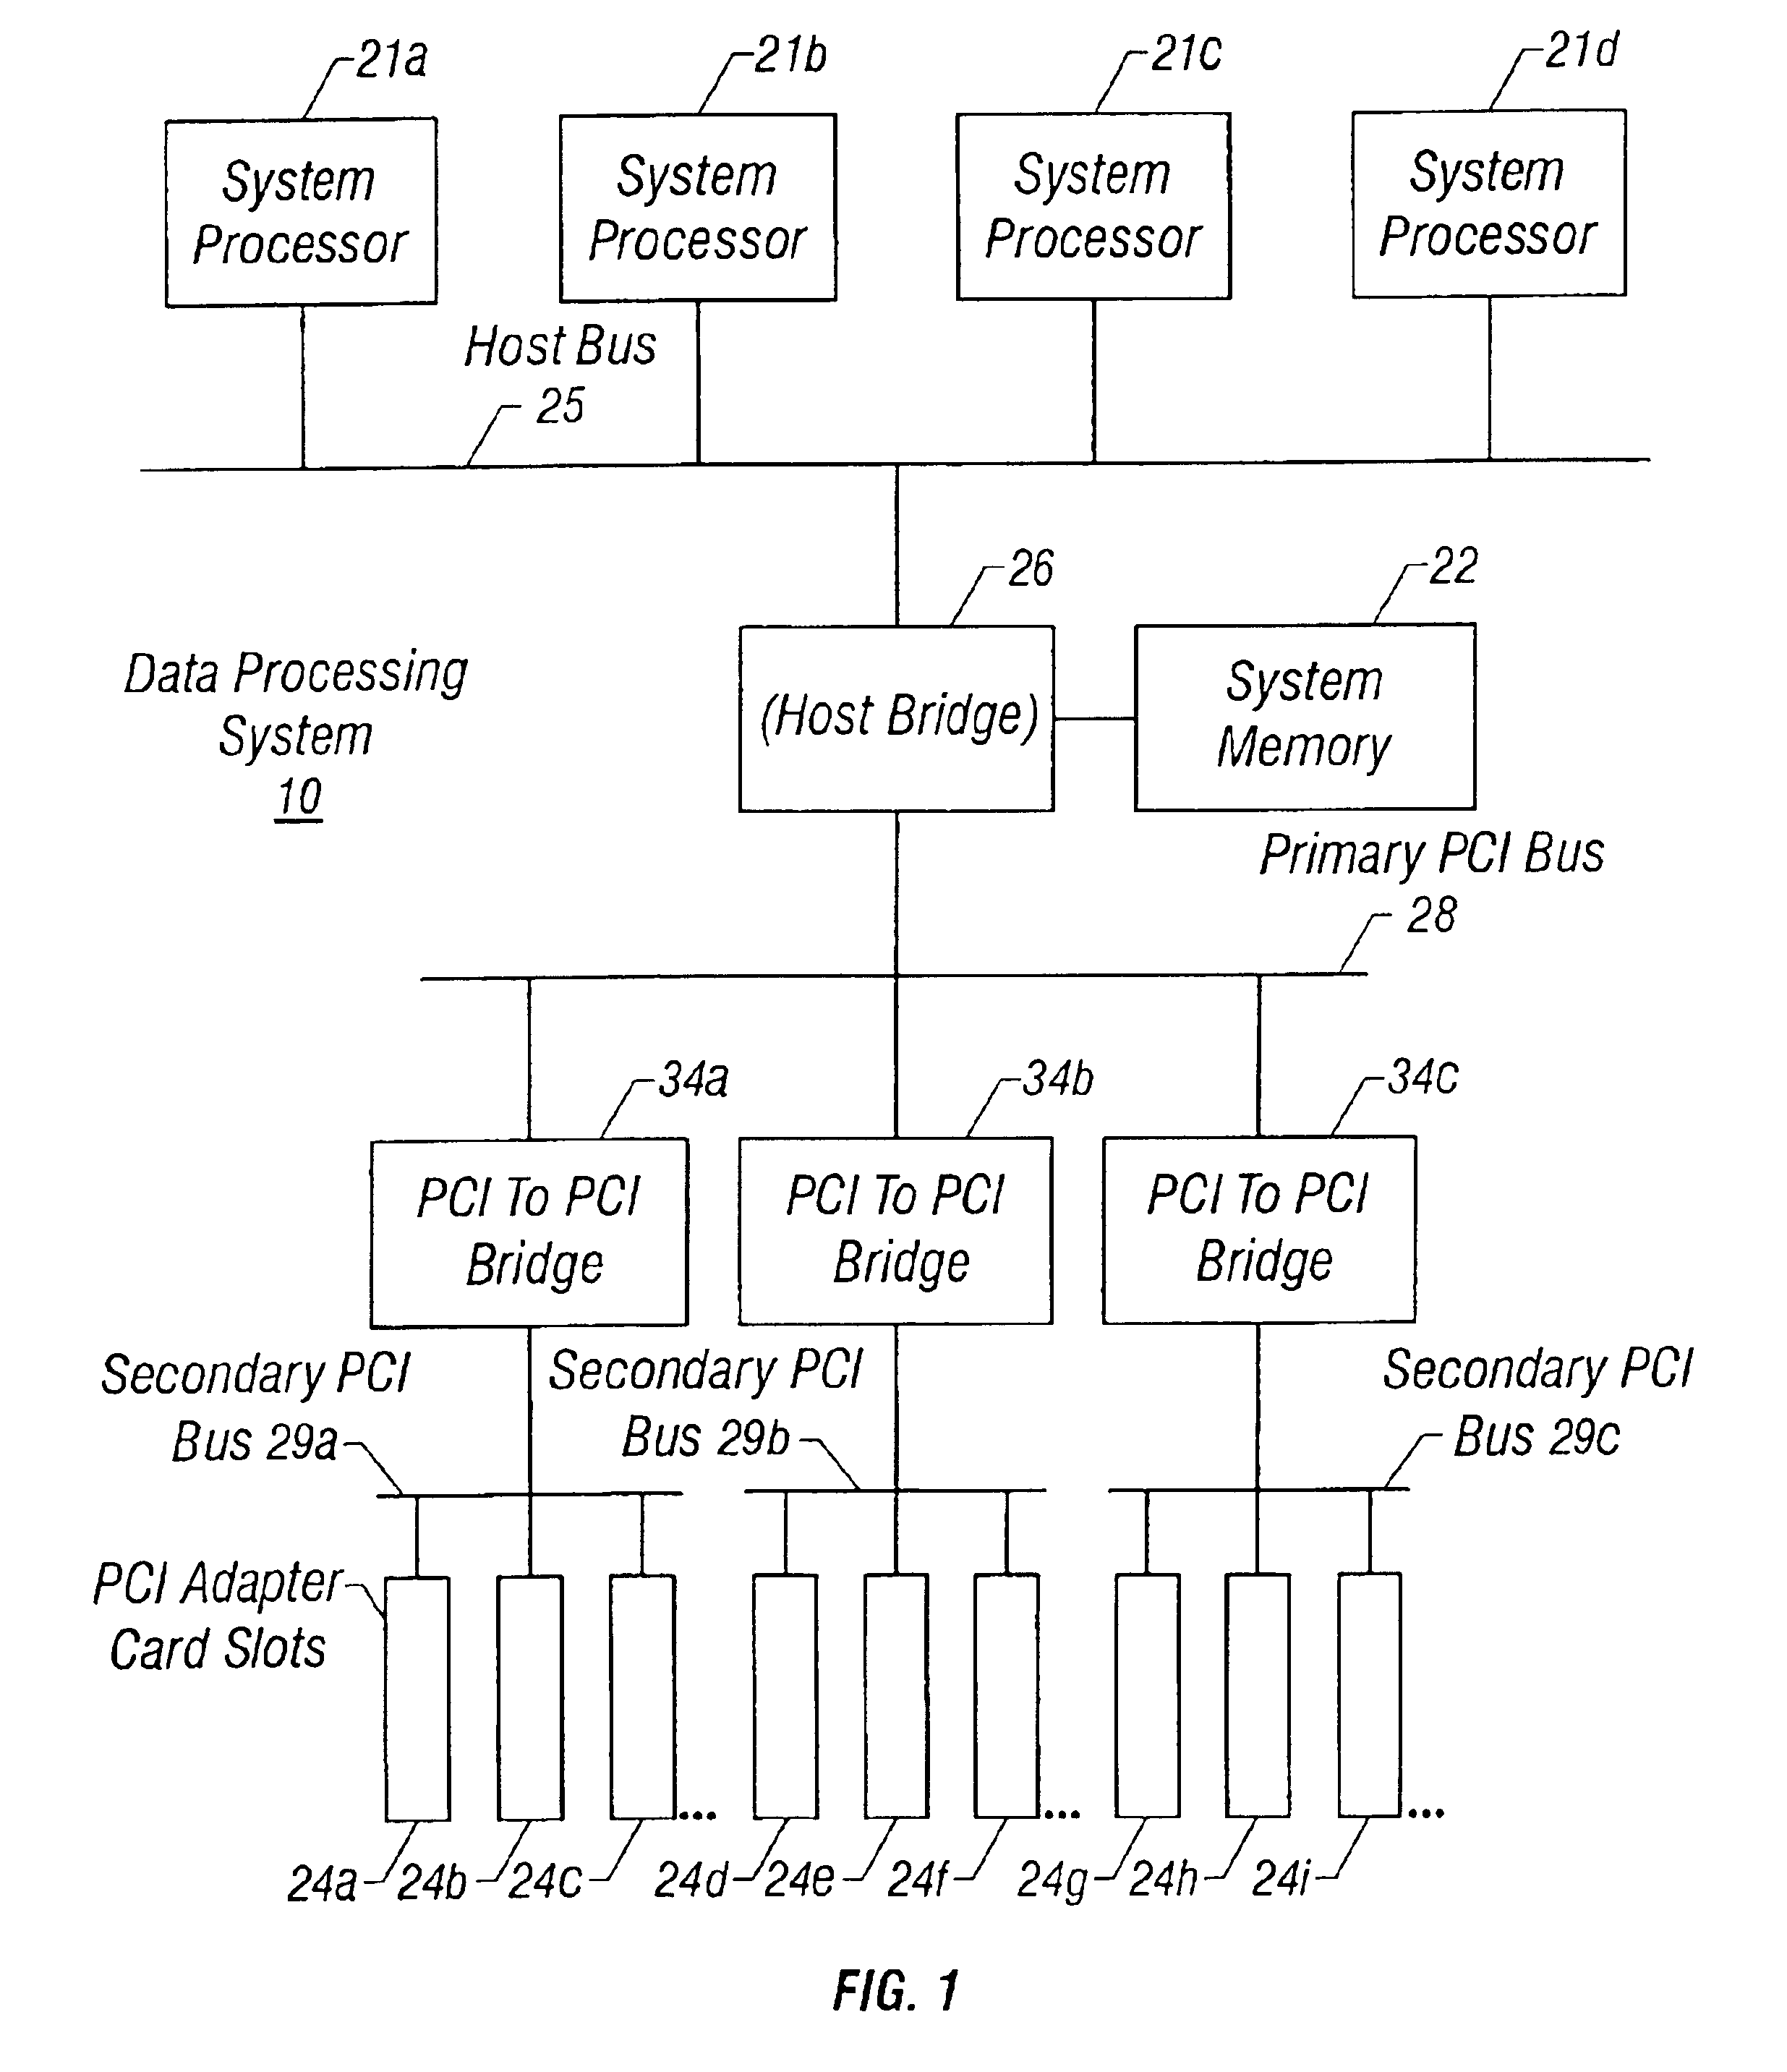
[0035]With reference now to the figures, and in particular, with reference to FIG. 1, there is depicted a block diagram of an exemplary data processing system 10 in which a preferred embodiment of the present invention may be implemented. As illustrated, data processing system 10 includes one or more system processor(s) 21a-21d and input / output (I / O) host bridge 26, herein referred to as “host bridge 26,” coupled by a first interconnect (host bus) 25. System processor(s) 21a-21d, implemented as any generation of Pentium™ processor available from Intel Corporation in Santa Clara, Calif., are coupled to host bus 25 and execute software instructions to control the operation of data processing system 10. Host bridge 26 couples system memory 22 and a primary peripheral component interconnect (PCI) bus 28 to both host bus 25 and system processor(s) 21a-21d. System memory 22, coupled to host bridge 26 and provides storage for software and data, may include both read-only memory (ROM) and r...


PUM


Abstract

A data processing system and method analyze the performance of its components by obtaining measures of usage of the components over time as well as electrical requirements of those components to recommend an optimal configuration. The location in the system and the time duration that any one or more components is in a performance-limiting or bottleneck condition is determined. Based on the observed bottlenecks, their times of occurrence and their time duration, more optimal configurations of the system are recommended. The present invention is particularly adapted for use in data processing systems where a peripheral component interconnect (PCI) bus is used.

Description

CROSS REFERENCE TO RELATED APPLICATIONS[0001]The present application is related to U.S. patent application Ser. No. 09 / 256,452 (now abandoned) “System and Method for Monitoring and Analyzing Computer System Performance and Making Recommendations for Improving It”, filed on Feb. 23, 1999, assigned to the assignee of the present application and incorporated herein by reference.[0002]The present application is related to U.S. patent application Ser. No. 09 / 918,330 (still pending), “System and Method for Identifying One or More Optimum Configurations of a Data Processing System” filed on Jul. 30, 2001, assigned to the assignee of the present application and incorporated herein by reference.[0003]The present application is related to U.S. patent application Ser. No. 09 / 283,362 (now abandoned), “System and Method for Predicting Computer System Performance and for Making Recommendations for Improving Its Performance”, Ser. No. 09 / 283,362, and Mar. 31, 1999 assigned to the assignee of the p...

Claims


Application Information

Patent Timeline
IPC IPC(8): G06F11/34
CPCG06F11/3409G06F11/349G06F11/3485G06F2201/81G06F2201/88
Inventor ATHERTON, WILLIAM EDWARDBERTRAM, RANDAL LEEMCKNIGHT, GREGORY JOSEPHPIAZZA, WILLIAM JOSEPH
Owner LENOVO GLOBAL TECH INT LTD
Why Eureka
Eureka Blog
Learn More