Graphical user interface with process quality indicator

a technology of process quality and user interface, applied in the field of manufacturing processes, can solve the problems of difficulty in real time and lack of intuitive feeling for operators, and achieve the effect of fast and intuitive understanding of the manufacturing process

Inactive Publication Date: 2006-01-31
MKS INSTR INC
View PDF9 Cites 37 Cited by
  • Summary
  • Abstract
  • Description
  • Claims
  • Application Information

AI Technical Summary

Benefits of technology

[0007]By providing a display mechanism that displays an icon with either the location and / or the color of the icon indicating process quality, a user of a system is provided with a fast and intuitive understanding of the manufacturing process as it relates to a desirable process.

Problems solved by technology

A problem with this approach is the need for a human operator to interpret the numerical value results and take appropriate action based upon the numbers provided by this statistical analysis of the processor.
This is difficult to achieve in real time during the processing of the wafer, and also does not provide an intuitive feel to the operator as to when the process is not being performed properly.

Method used


Image

  • Graphical user interface with process quality indicator
  • Graphical user interface with process quality indicator
  • Graphical user interface with process quality indicator

Examples


Embodiment Construction

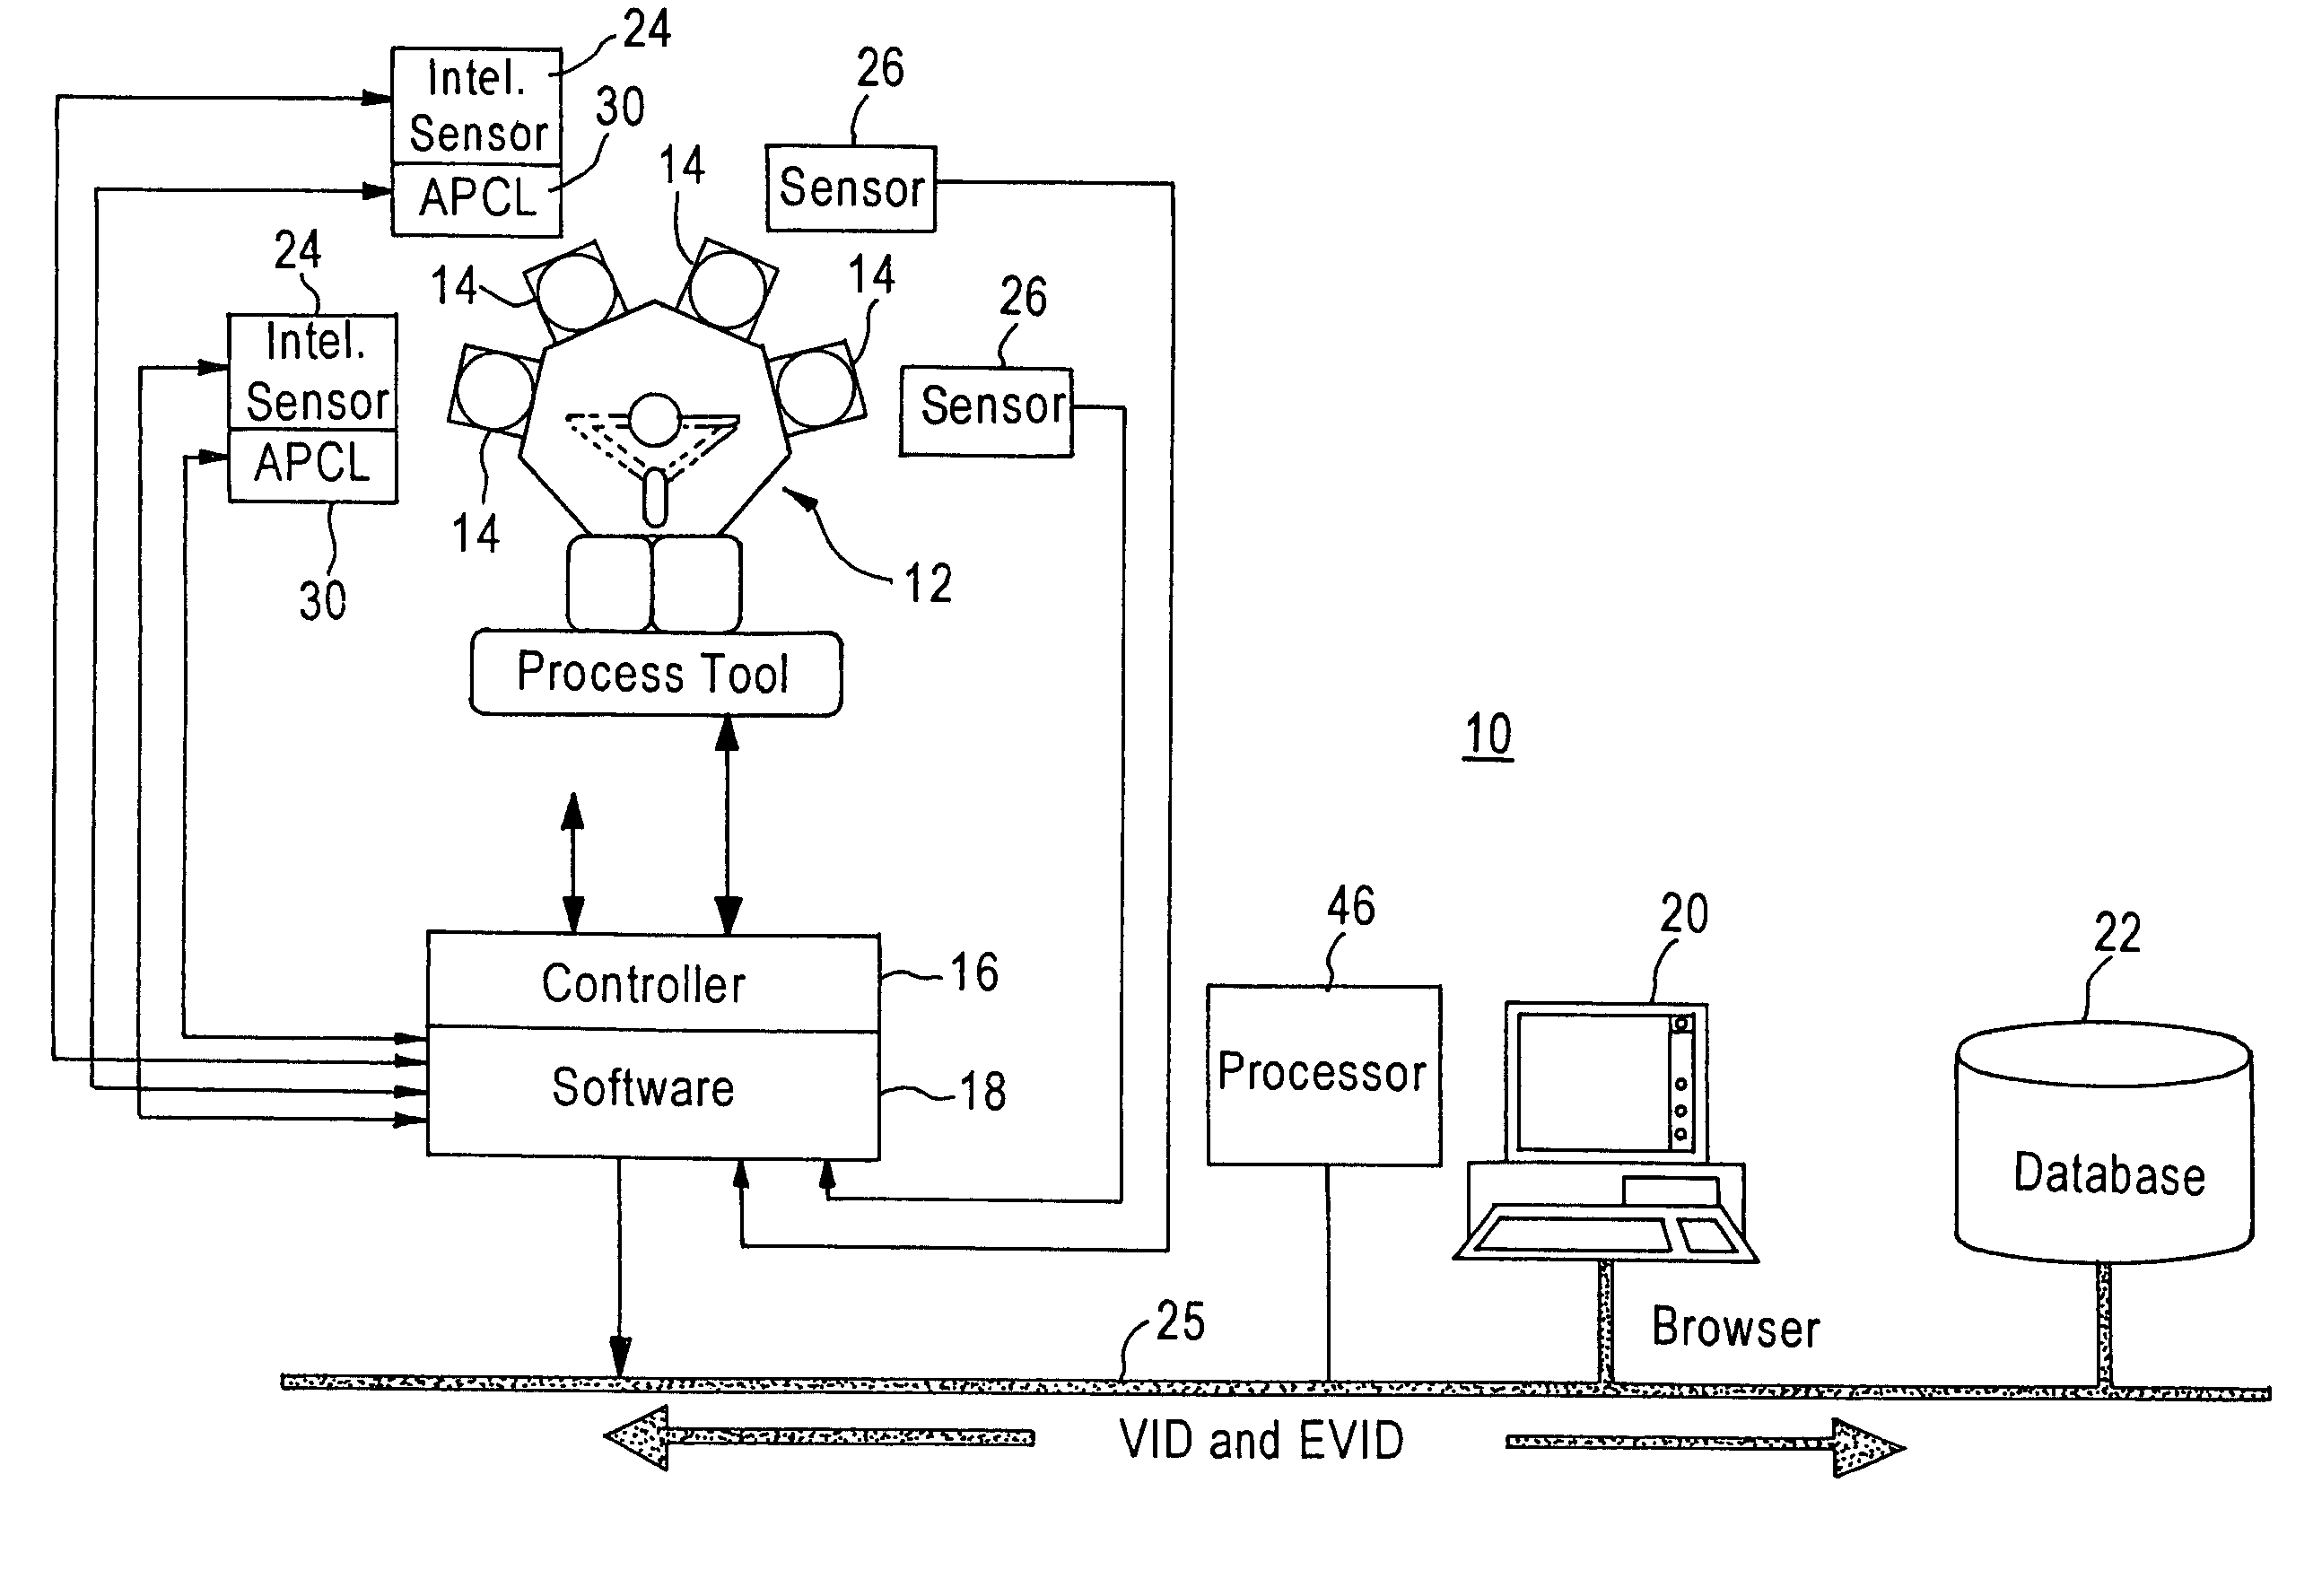
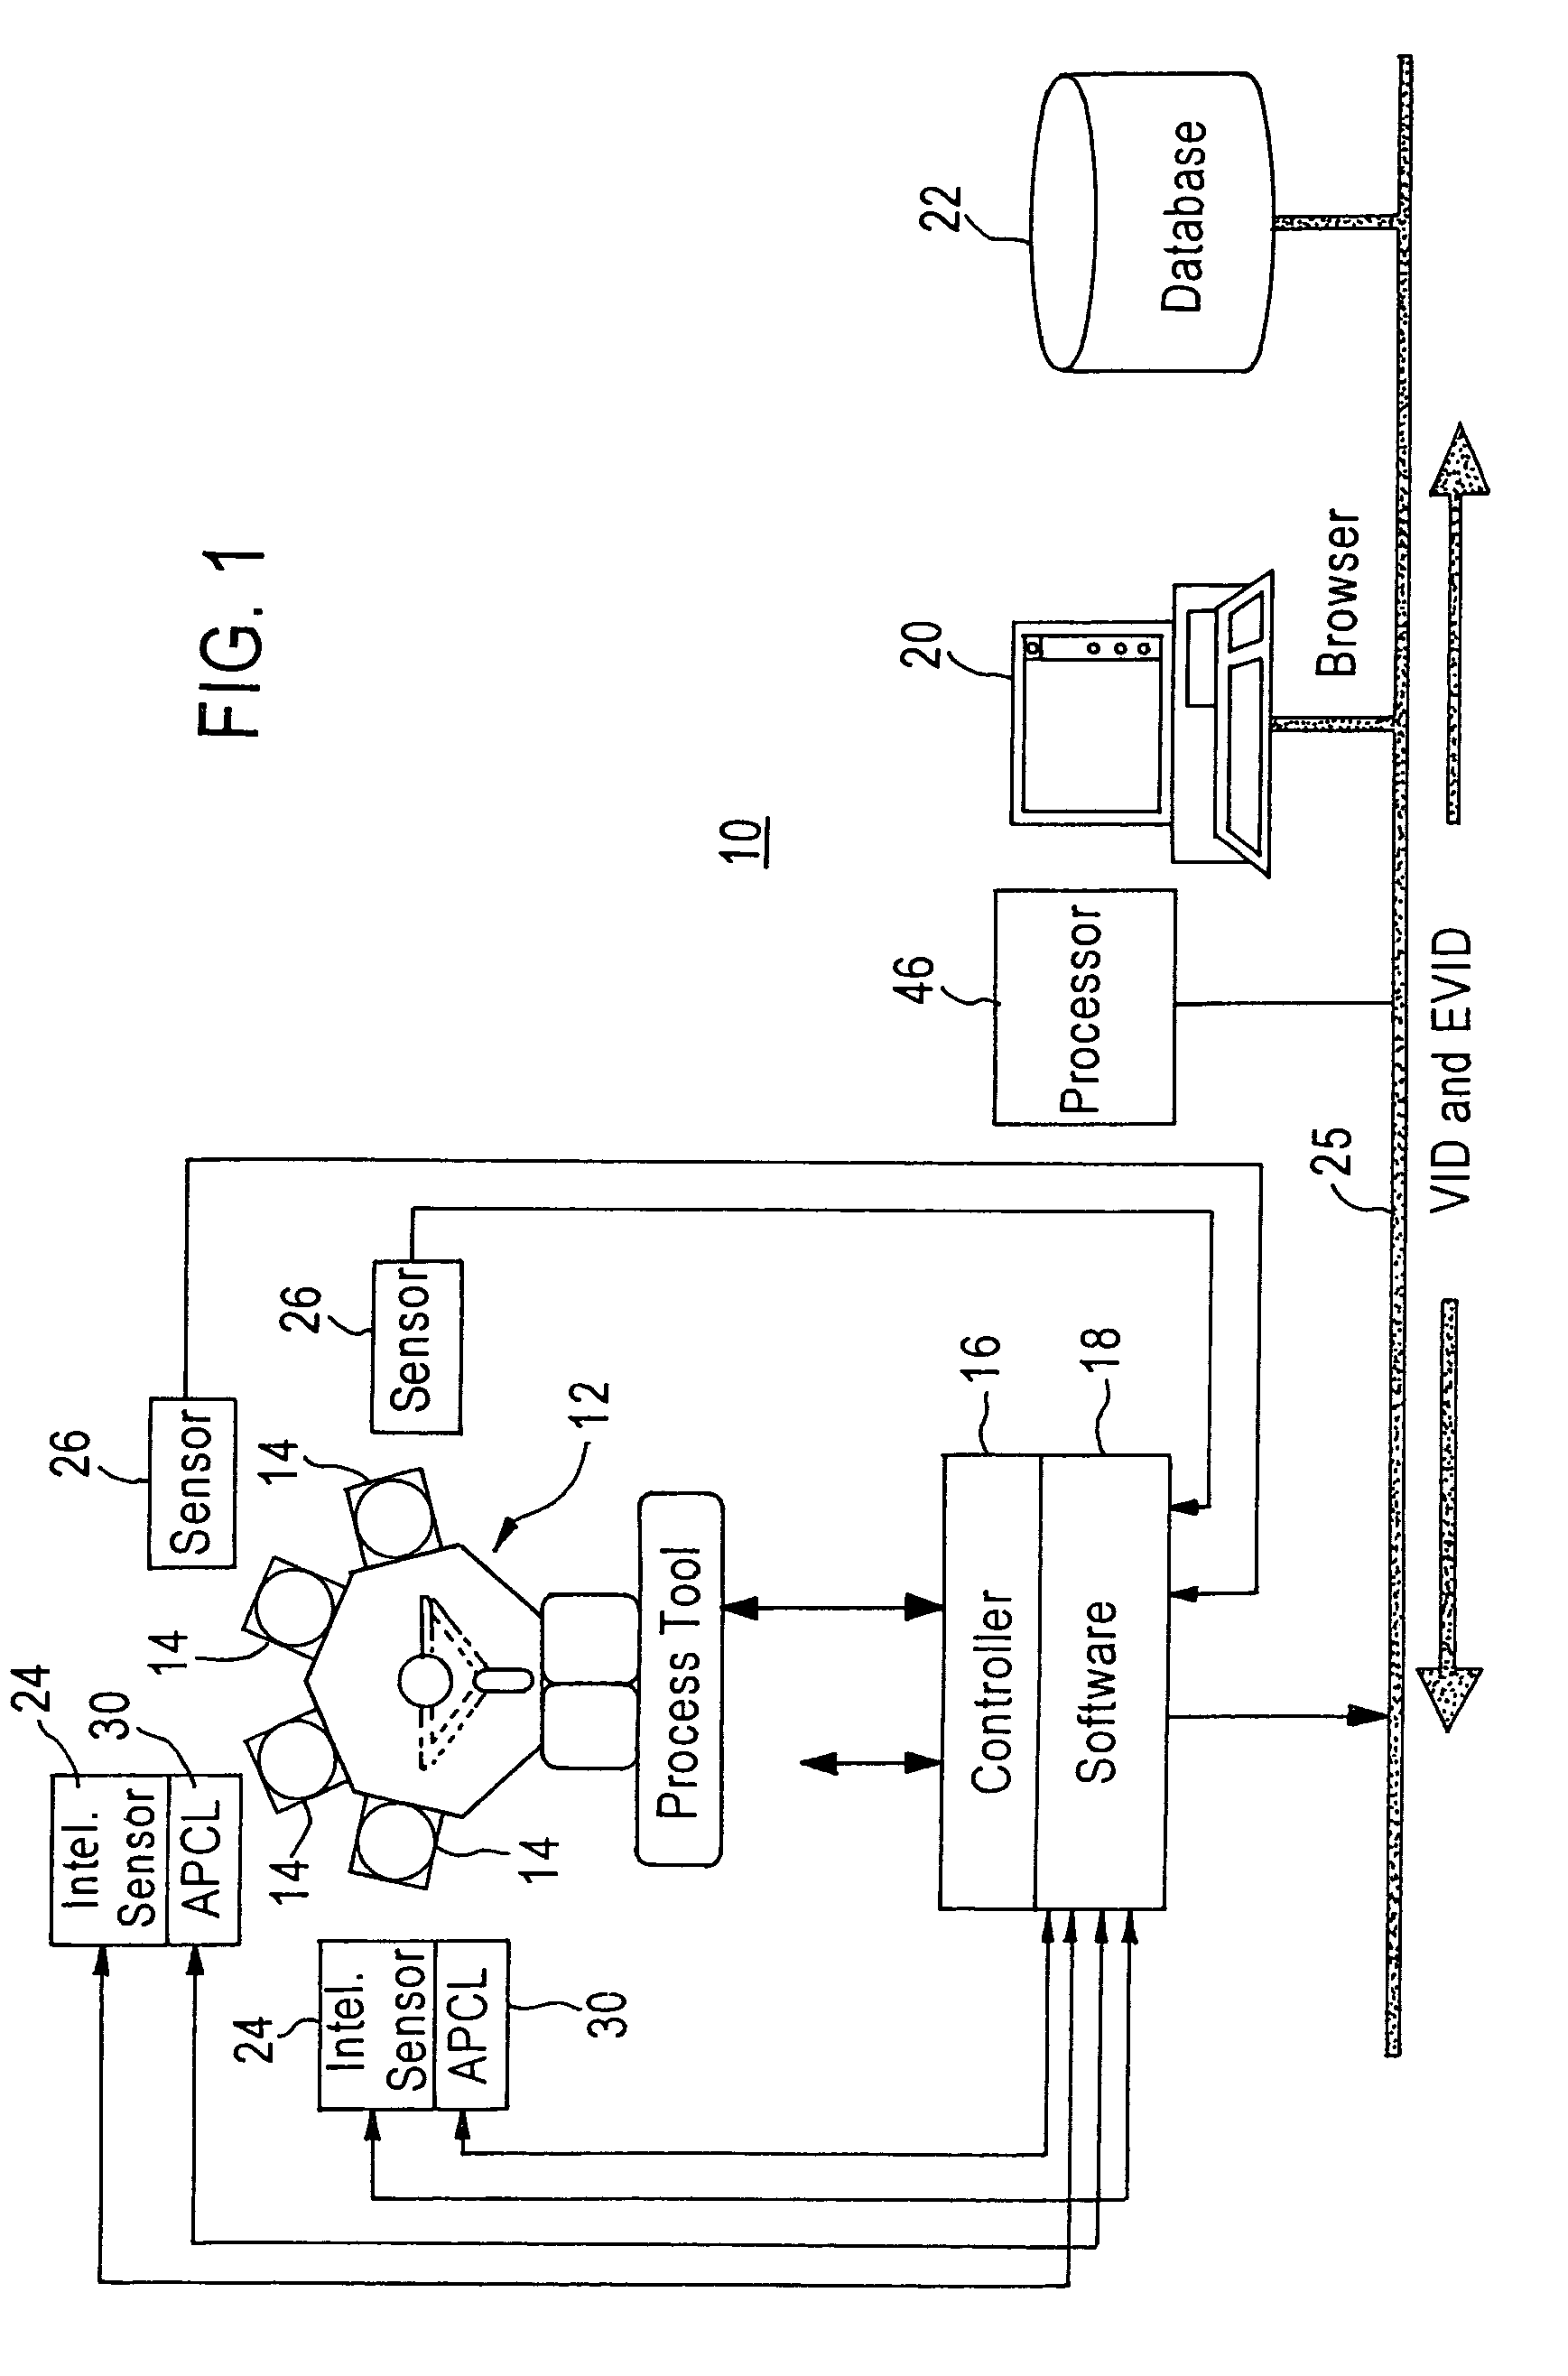
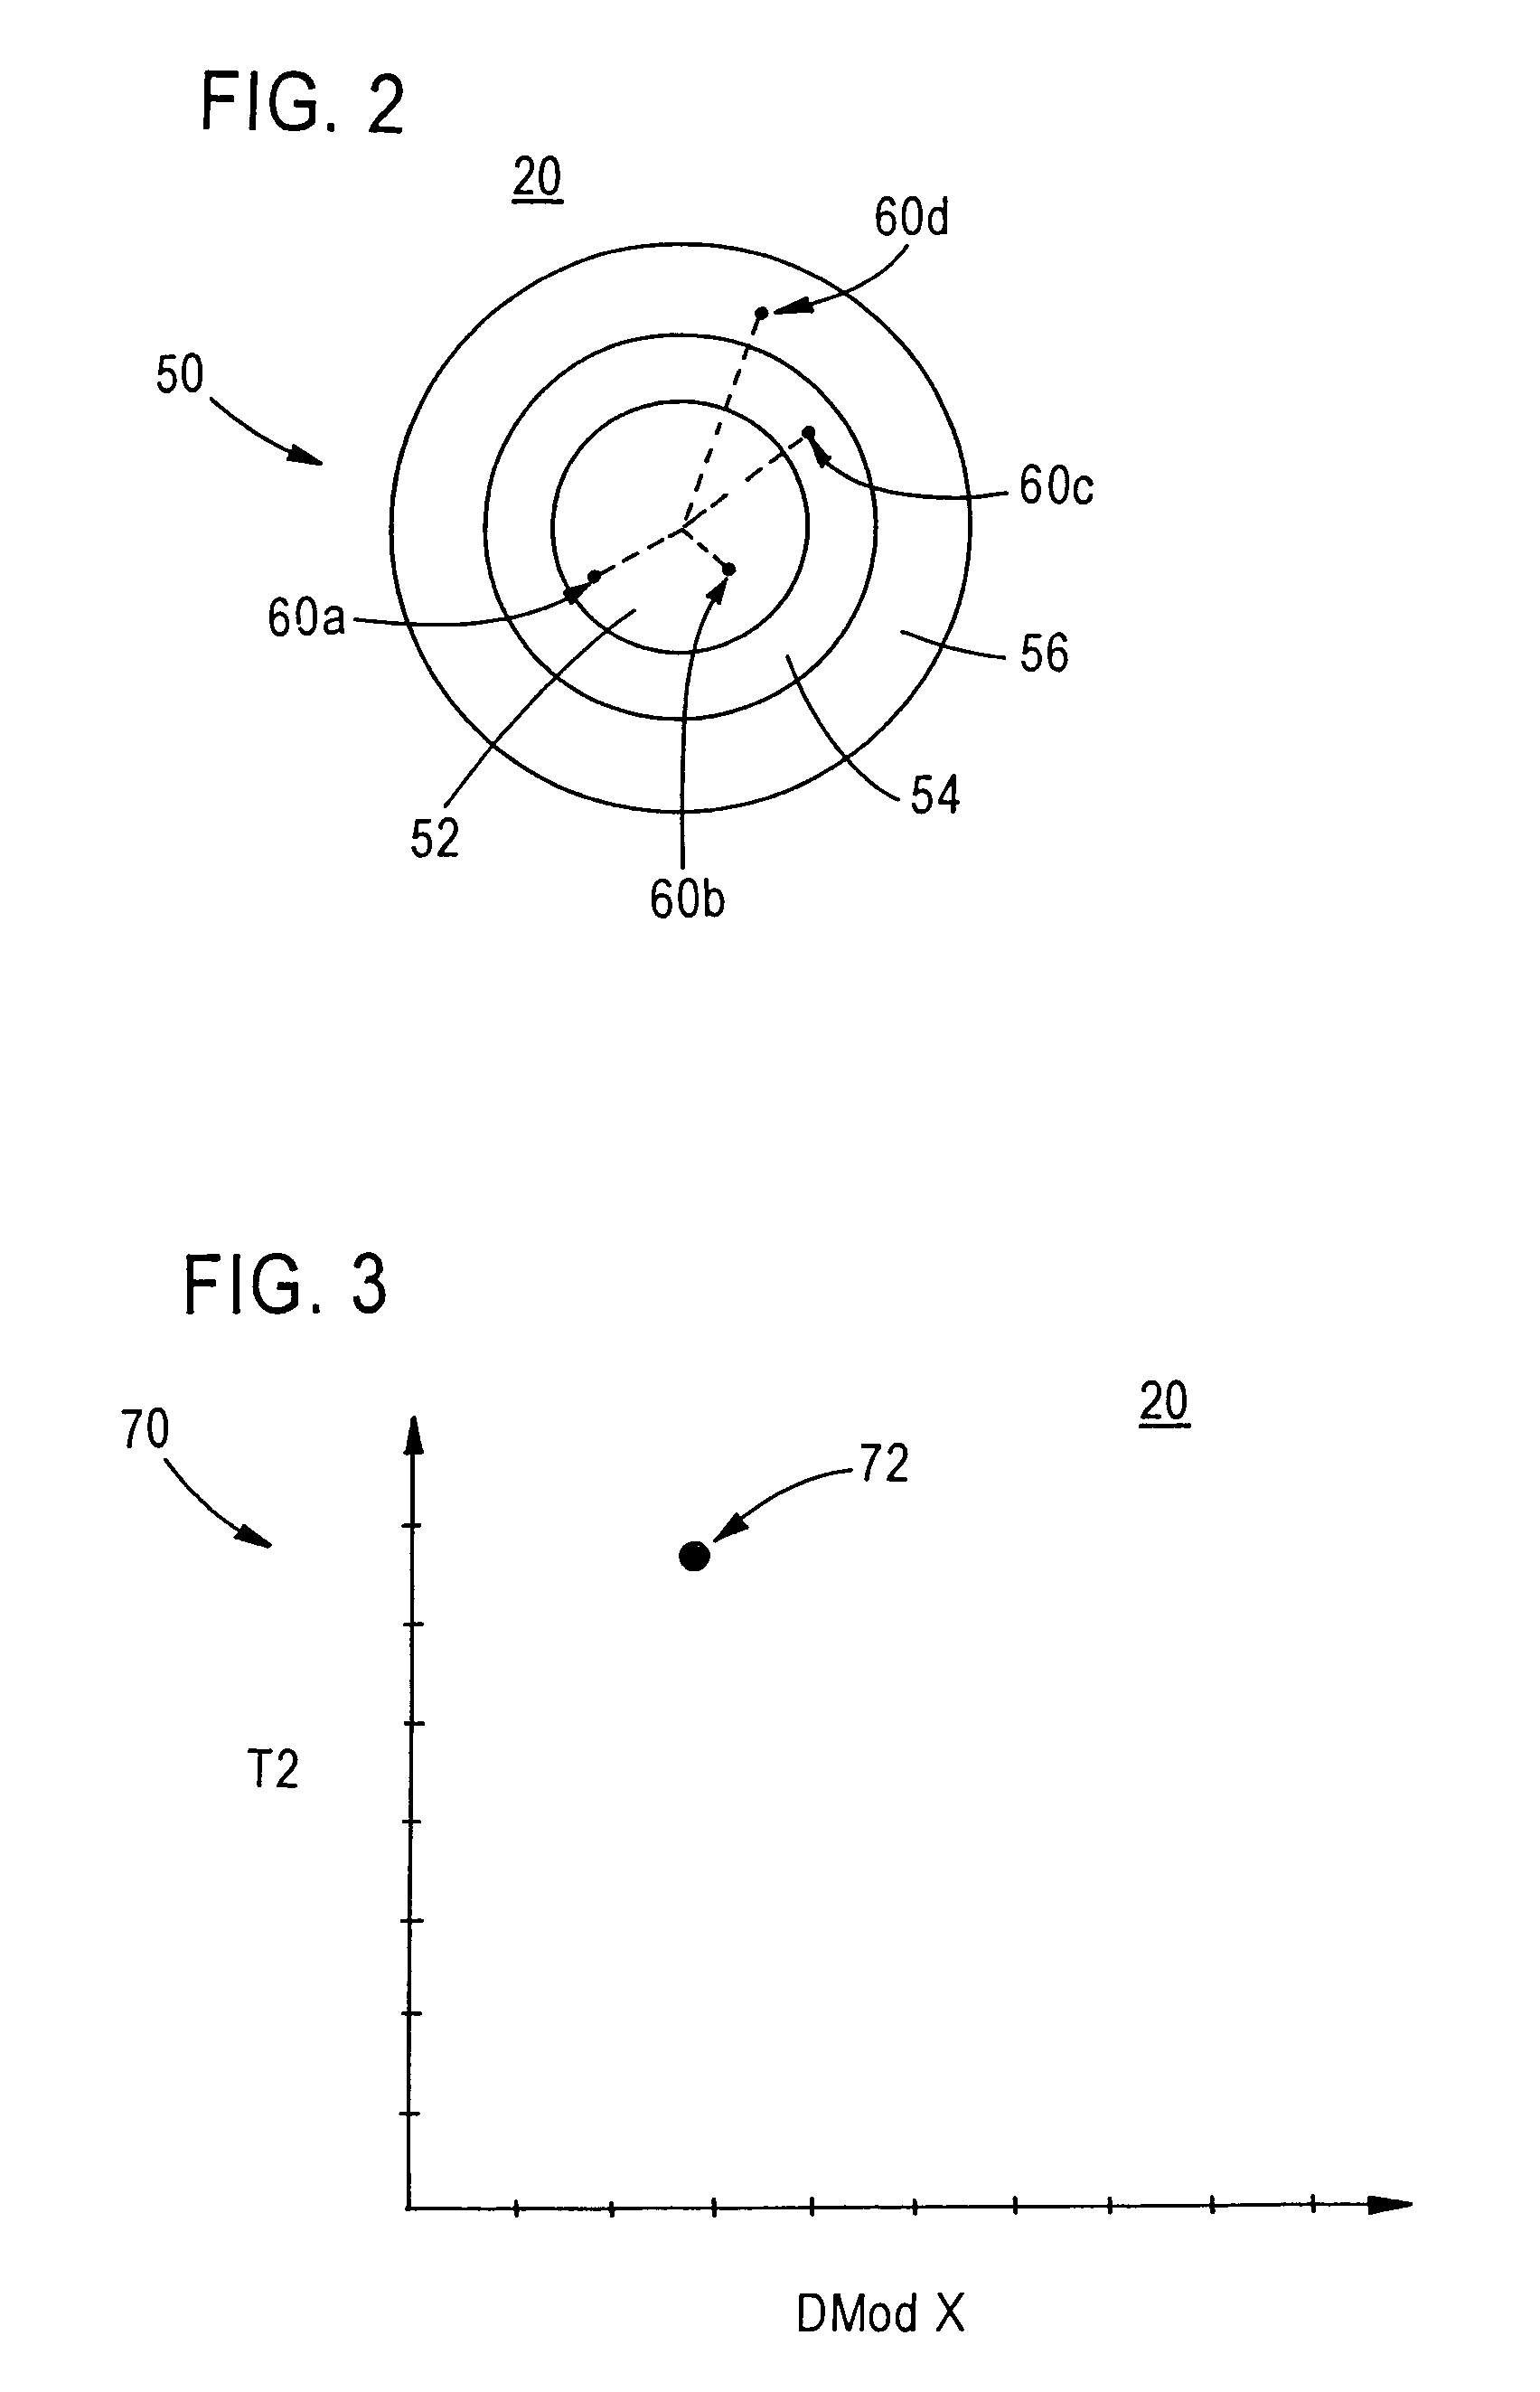
[0014]The present invention addresses and solves problems related to the displaying of process information and determination of whether the quality of a process is within acceptable limits. This is achieved, in part, by a graphical user interface (GUI) that provides a visual indication to a user as to whether a process is being performed within acceptable parameters. This graphical depiction provides a user with an intuitive grasp of whether the process is being performed within acceptable limits or whether modifications need to be made to the process. The graphical nature of this analysis and depiction avoids a numerical analysis and interpretation by a human operator. Hence, less-skilled operators may be employed, and training for these operators may be reduced.

[0015]FIG. 1 depicts in block diagram form an exemplary system constructed in accordance with an embodiment of the present invention. As described herein, the exemplary system is a semiconductor manufacturing system for man...


PUM


Abstract

A graphical user interface for enabling a user to graphically observe on a displaying mechanism a statistical measure of the process quality of a manufacturing process provides for the display of an icon representing a workpiece. The location and color of the icon on the displaying mechanism indicates the process quality of the manufacturing process for the represented workpiece.

Description

FIELD OF THE INVENTION[0001]The present invention relates to the field of manufacturing processes, such as semiconductor manufacturing processes, and a graphical user interface for such process.BACKGROUND OF THE INVENTION[0002]In modem manufacturing processes, it is generally desirable to provide as much control and automation as possible. In order to improve the processes as much as possible, and to provide as great a control as possible, large amounts of information are collected and analyzed that allow for refinement of the process and improve quality control.[0003]For example, during a semiconductor manufacturing process, a large number of sensors can be used to monitor the processes and provide sensoric data to a processor. The data is processed and analyzed and adjustments are made to the processes as necessary based upon that analysis. The processor's analysis produces results that indicate values corresponding to a particular wafer that is either currently being processed or...

Claims


Application Information

Patent Timeline
Patent Type & Authority Patents(United States)
IPC IPC(8): G06F19/00G05B19/418H01L
CPCG05B19/41875G05B2219/45031G05B2219/35502Y02P90/02G06F3/0481G06Q10/06
Inventor LEV-AMI, UZISIFNATSCH, GUENTERATTWOOD, MARK
Owner MKS INSTR INC
Why Eureka
Try Eureka