Evaluation system for vehicle operating conditions and evaluation method thereof

a vehicle operating condition and evaluation system technology, applied in the direction of machines/engines, liquid/fluent solid measurement, process and machine control, etc., can solve the problems of fuel economy deterioration and insufficient aid to the improvement of driving skills, so as to achieve favorable fuel consumption ratio, improve fuel economy, and improve fuel economy

Inactive Publication Date: 2006-04-04
MIYAMA
View PDF17 Cites 87 Cited by
  • Summary
  • Abstract
  • Description
  • Claims
  • Application Information

AI Technical Summary

Benefits of technology

[0009]When traveling at a certain steady vehicle speed, fuel economy improves when a high speed side gear is used. When traveling at a vehicle speed V, for example, a vehicle may be driven at the vehicle speed V at a point S or a point R in the figure, but fuel economy is better if the vehicle is driven at the point R than the point S. Hence, if traveling at the point S, fuel economy can be improved by shifting up as shown by an arrow A. If the accelerator is gradually depressed from the point R, the vehicle speed increases along an arrow B and the vehicle travels at a steady speed at a point at which drive force and running resistance balance. If excessive drive force is extremely small, the fuel economy deteriorates gradually as shown by the arrow B, but due to the presence of even a slight accelerating resistance, the actual fuel economy is worse.
[0011]Although the same acceleration can be obtained in a plurality of gear positions, fuel economy improves as the gear position increases. When obtaining an acceleration a in FIG. 18, for example, the fuel economy can be improved from C to D by traveling in second gear rather than first gear. This is because in so doing, the engine is operated in or in the vicinity of a region of a favorable fuel consumption ratio which is shown by the diagonally shaded portion in FIG. 19.
[0012]The wide arrows P in FIGS. 17 through 19 indicate the directions in which the fuel consumption ratio worsens. The arrows P generally match the directions of increase in NOx and smoke. This is because a diesel engine is operated at a leaner air / fuel ratio (excess air ratio λ>1, equivalence ratio φ<1) than stoichiometric air / fuel ratio (approximately 14.9), and hence, as shown in FIG. 20, when attempting to obtain greater engine torque, stoichiometric air / fuel ratio is neared from the leaner air / fuel ratio with the result that the fuel economy worsens and NOx and smoke increase.
[0014]It is therefore an object of this invention to provide a driver with information which aids driving skill enhancement, to improve fuel economy through improvements in driving operations, and to realize low engine emissions.
[0016]According to this invention, when an operation which worsens fuel economy, such as rapid acceleration, is performed, the extra amount of fuel consumed (excess fuel consumption) is calculated and displayed. When an operation which worsens fuel economy is performed, this is immediately converted into an increase in excess fuel consumption and displayed as such. As a result, a driver can recognize the driving operation which caused the deterioration in fuel economy, and this can be used as a reference when improving driving operations. Moreover, the driver can be caused to recognize the extent to which fuel economy is worsened by his / her driving operations, and thus the driver can be encouraged to improve his / her driving skill.

Problems solved by technology

However, simply displaying the fuel economy cannot be said to be sufficient in aiding the improvement of driving skills since the driver cannot learn specifically how to improve driving operations in order to enhance fuel economy and does not know the degree to which fuel economy is enhanced by improving driving operations.
When the engine rotation speed increases, friction inside the engine and air resistance acting on the vehicle body increase, and thus when the vehicle speed increases in each gear position, fuel economy deteriorates.

Method used


Image

  • Evaluation system for vehicle operating conditions and evaluation method thereof
  • Evaluation system for vehicle operating conditions and evaluation method thereof
  • Evaluation system for vehicle operating conditions and evaluation method thereof

Examples


Embodiment Construction

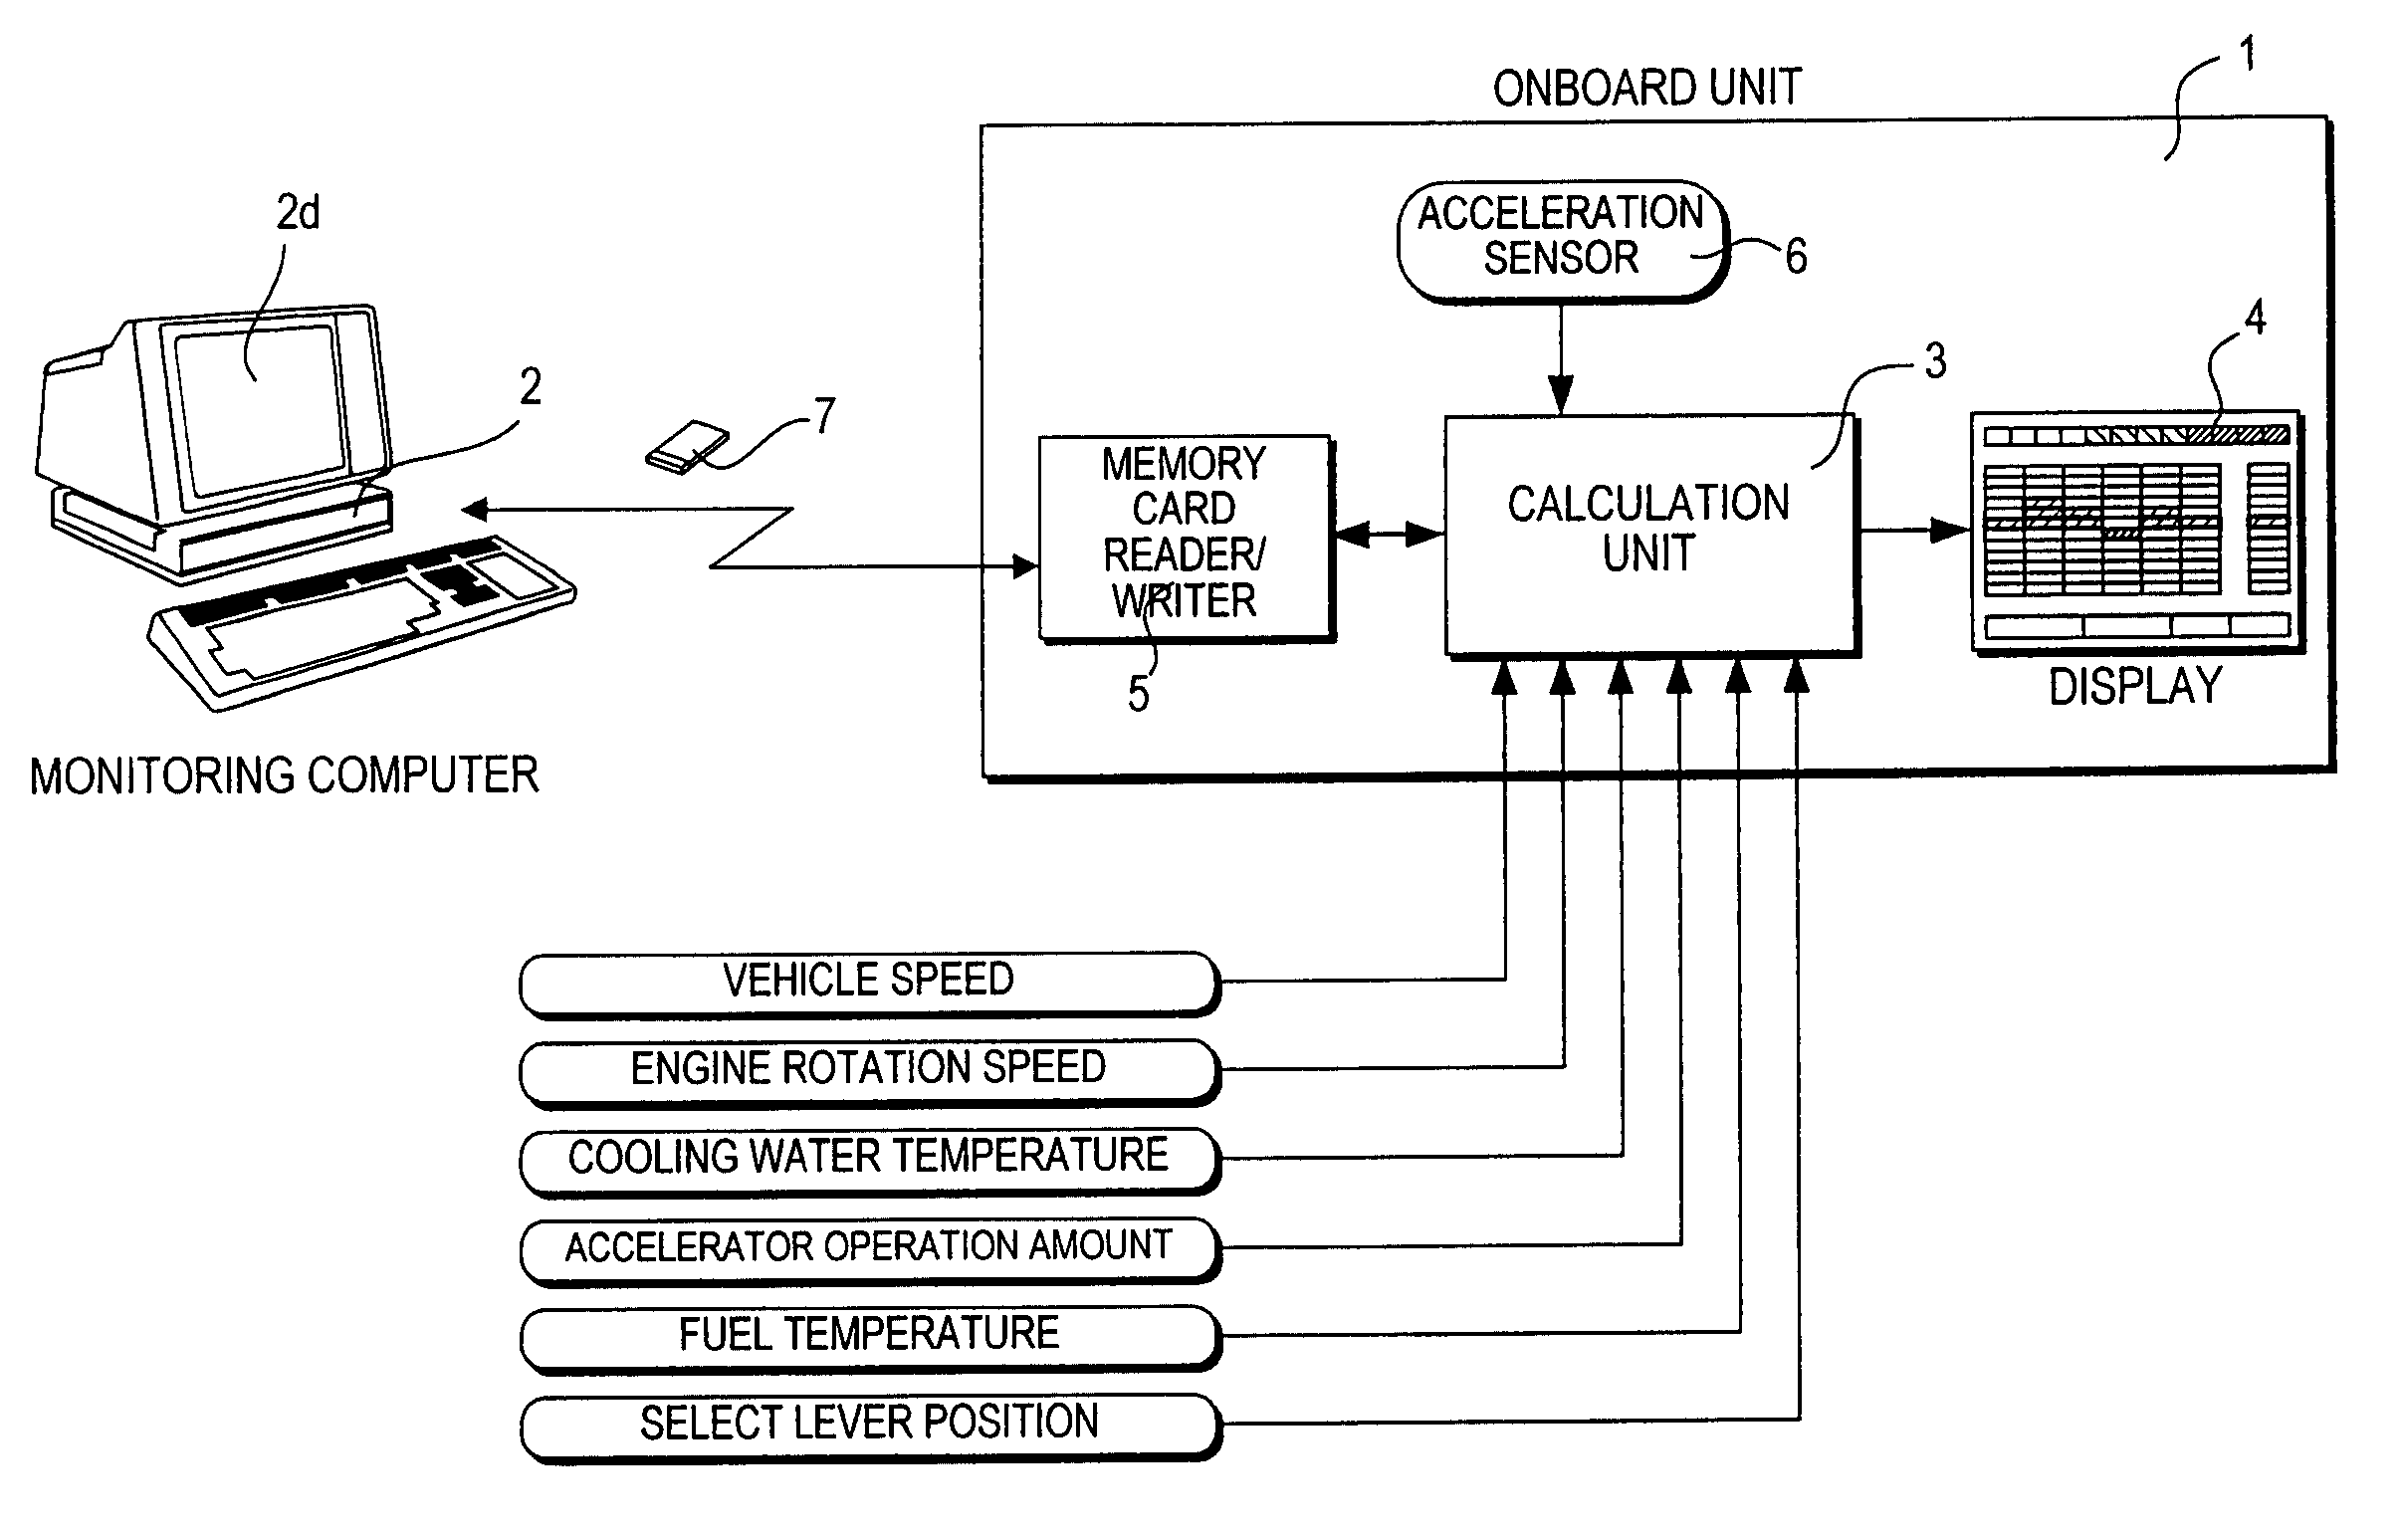
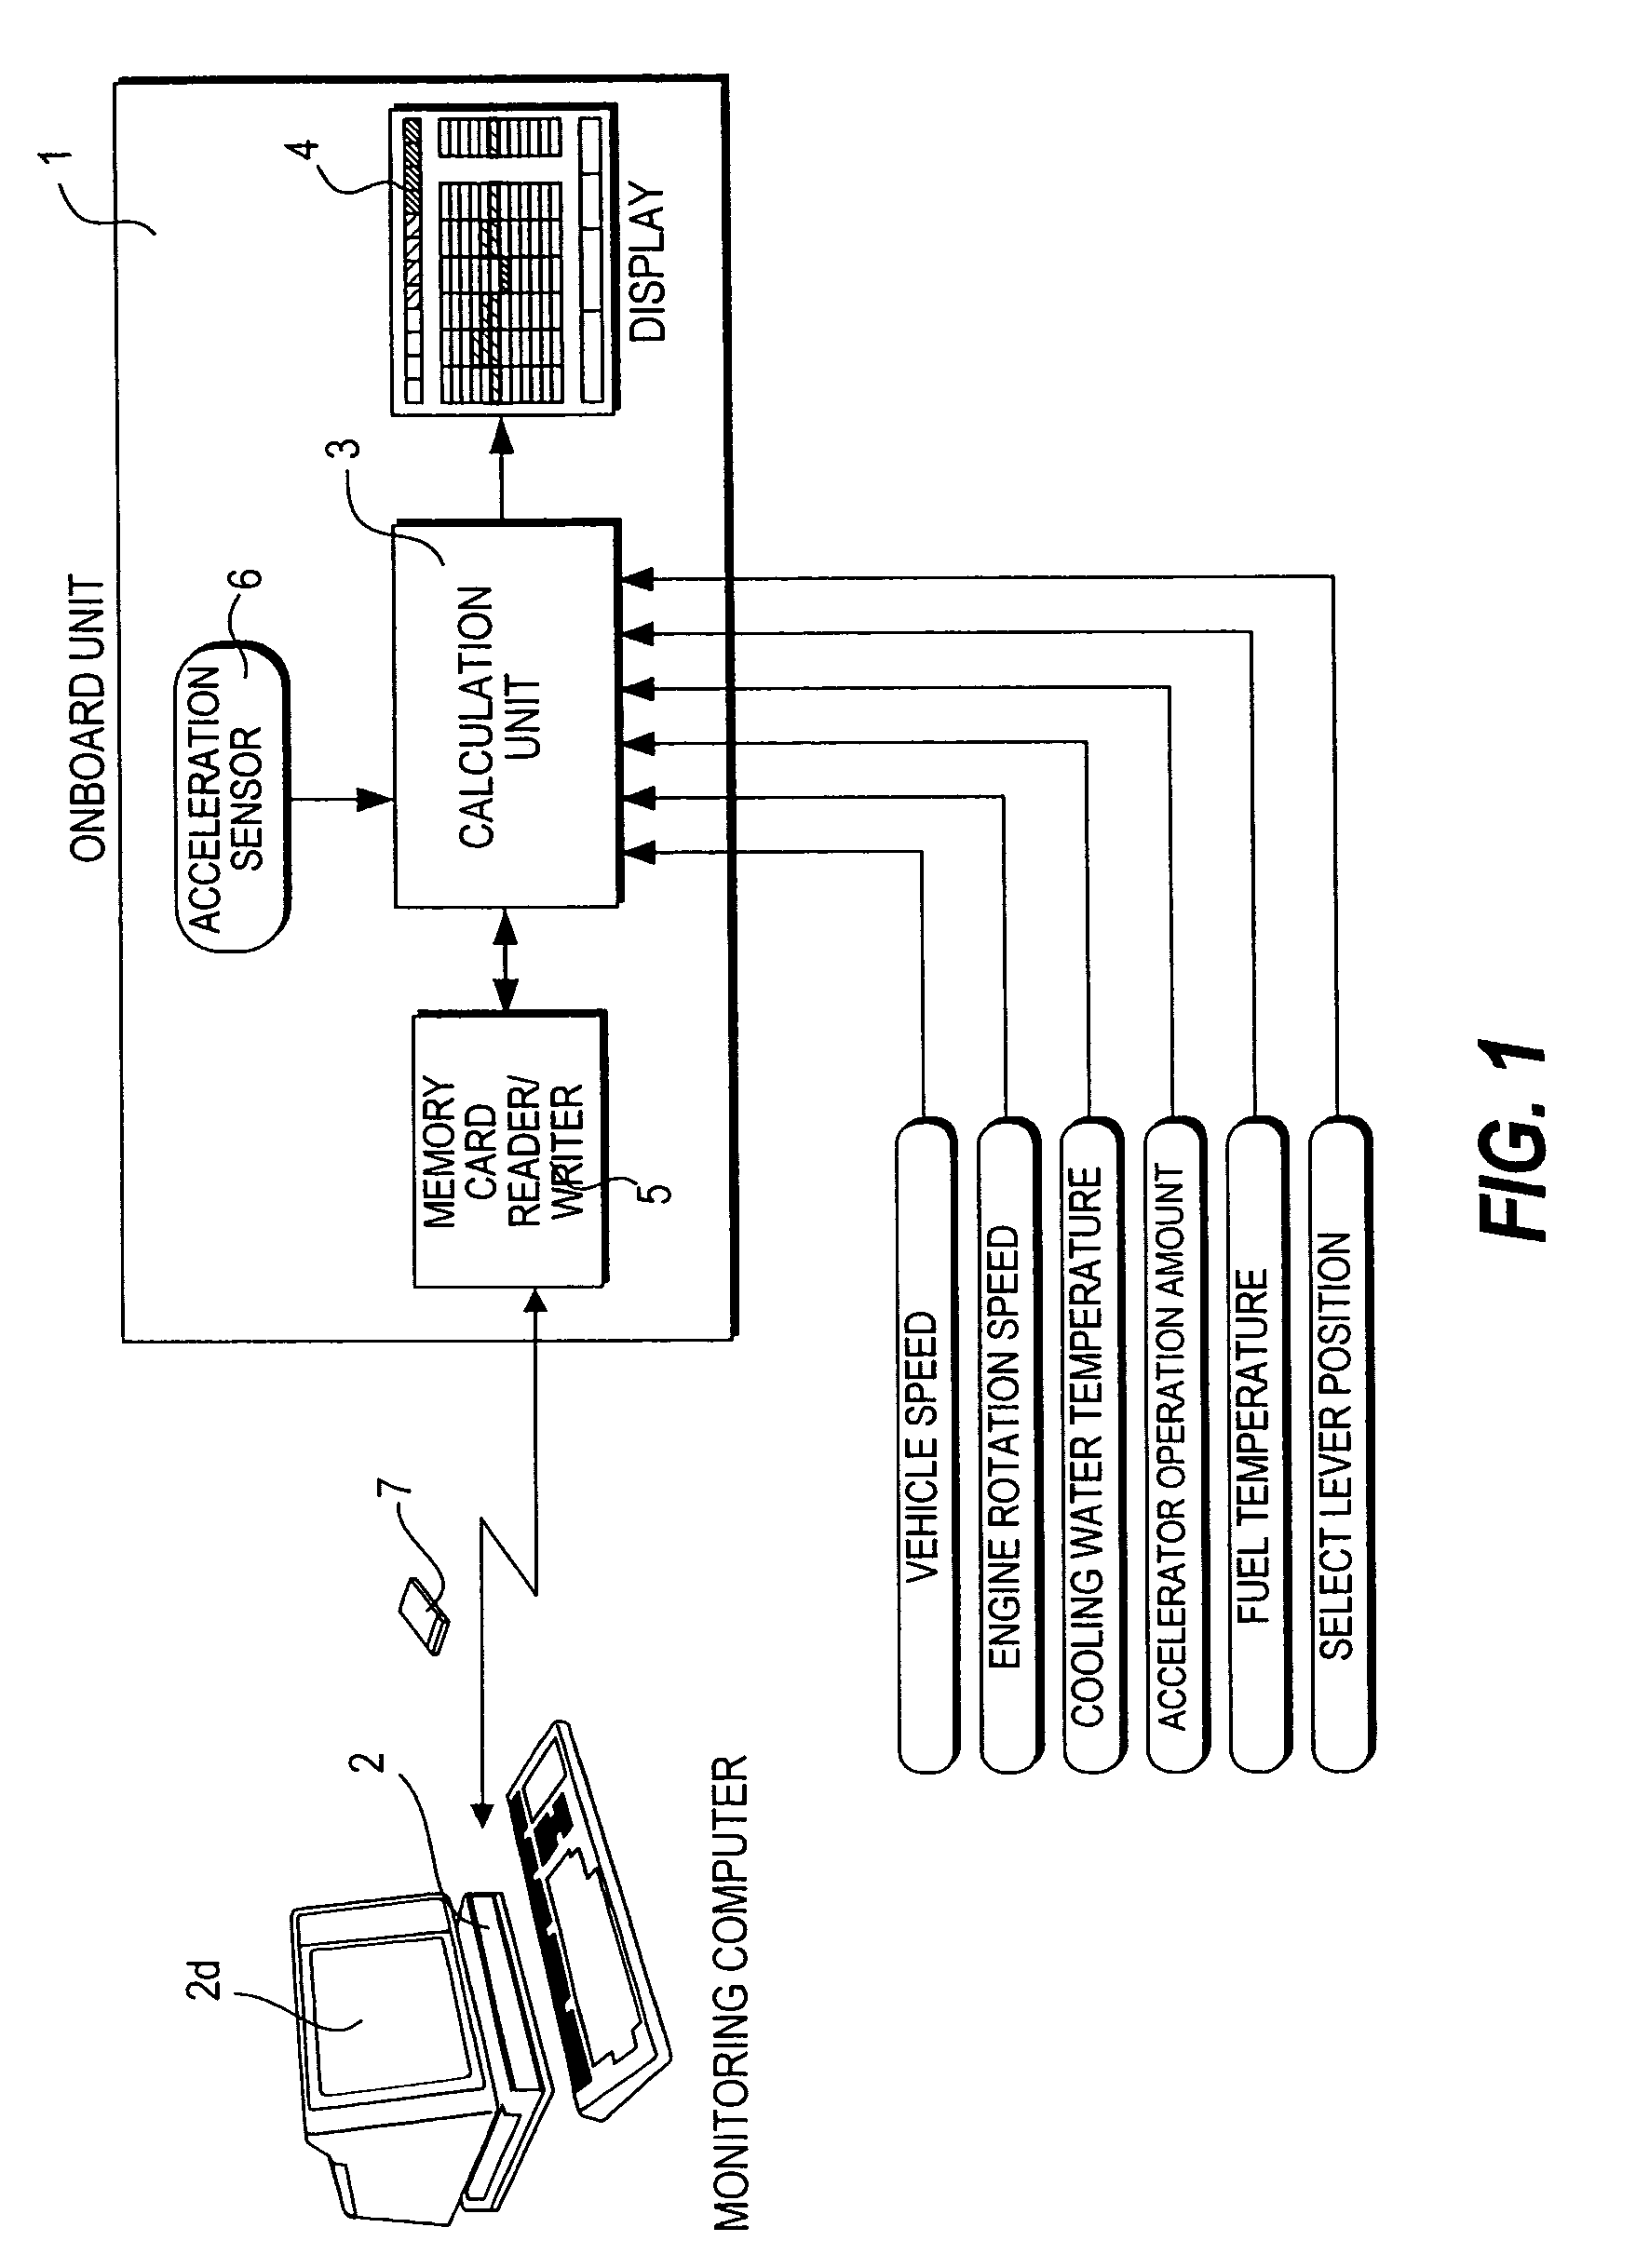
[0038]FIG. 1 is a block diagram showing the constitution of an evaluation system for vehicle operating conditions according to this invention. This system includes an onboard unit 1 which is mounted in a vehicle subject to evaluation and a monitoring computer 2 for monitoring the vehicle.

[0039]The onboard unit 1 includes a calculation unit 3 comprising a CPU, memory, and an input / output interface, a display 4 such as an LCD, a memory card reader / writer 5, and an inbuilt acceleration sensor 6. The display 4 is mounted in the vehicle in a position where it can be easily seen by the driver.

[0040]Signals outputted from the vehicle subject to evaluation such as a vehicle speed signal, an engine rotation speed signal, a cooling water temperature signal, an accelerator operation amount signal, a fuel temperature signal, a select lever position signal, and so on, and an acceleration signal from the inbuilt acceleration sensor 6 are inputted into the calculation unit 3. These vehicle output ...


PUM


Abstract

A calculation unit (3) determines whether or not an operation which worsens fuel economy has been performed, and if it is determined that an operation which worsens fuel economy has been performed, the calculation unit (3) respectively calculates the actual amount of consumed fuel and an amount of fuel that would have been consumed had the operation that worsens fuel economy not been performed. The calculation unit (3) then calculates an amount of fuel consumed in excess due to the operation which worsens fuel economy by subtracting the amount of fuel that would have been consumed had the operation that worsens fuel economy not been performed from the actual amount of consumed fuel. A display (4) displays the calculated excess fuel consumption amount.

Description

[0001]1. Field of the Invention[0002]This invention relates to a system for evaluating—vehicle operating conditions such as fuel economy.[0003]2. Description of the Related Art[0004]JP2000-205925A, published by the Japan Patent Office in 2000, discloses a fuel economy display device. This device calculates fuel consumption on the basis of a fuel injection pulse signal outputted from an engine controller, calculates traveled distance on the basis of a vehicle speed pulse signal outputted from a vehicle speed sensor, and calculates and displays the fuel economy by dividing the calculated traveled distance by the fuel consumption.SUMMARY OF THE INVENTION[0005]By means of this fuel economy display device, a driver can learn the fuel economy while in motion. However, simply displaying the fuel economy cannot be said to be sufficient in aiding the improvement of driving skills since the driver cannot learn specifically how to improve driving operations in order to enhance fuel economy and...

Claims


Application Information

Patent Timeline
Patent Type & Authority Patents(United States)
IPC IPC(8): G06G7/70G06F19/00F02D41/04G05B23/02G06F17/00G07C5/00G07C5/08
CPCG07C5/0858F02D41/045F02D2041/228G07C5/008F02D2200/0625
Inventor MINAMI, KATSUAKIKUMAGAI, SATOSHIHAMURO, TAKAONAGAHARA, HIDEKI
Owner MIYAMA
Why Eureka
Try Eureka