
Fault detection and classification based on calculating distances between data points

Inactive Publication Date: 2006-05-09
GLOBALFOUNDRIES INC
View PDF8 Cites 36 Cited by
  • Summary
  • Abstract
  • Description
  • Claims
  • Application Information

AI Technical Summary

Benefits of technology

[0010]In a further embodiment of the present invention, an article comprising one or more machine-readable storage media containing instructions is provided for fault detection and classification based on calculating distances between data points. The one or more instructions, when executed, enable the processor to receive a data sample representative of measurements of variables that are associated with a process operation, perform principal component analysis on the data sample

Problems solved by technology

Analyzing large amounts of collected data, however, poses a challenge because of the processing power or resources that are required to process the data, possibly within a specified amount of time.
Because of limited processing capabilities and / or time constraints, users often times choose and analyze only a selective subset of variables that are considered to be more important, while ignoring the other variables.
However, excluding measured variables that are not considered to be desirable by users may result in the loss of valuable information, particularly from the standpoint of fault detection and classification.
Relying on incomplete data may result in false fault detection or misclassification.

Method used


Image

  • Fault detection and classification based on calculating distances between data points
  • Fault detection and classification based on calculating distances between data points
  • Fault detection and classification based on calculating distances between data points

Examples


Embodiment Construction

[0019]Illustrative embodiments of the invention are described below. In the interest of clarity, not all features of an actual implementation are described in this specification. It will of course be appreciated that in the development of any such actual embodiment, numerous implementation-specific decisions must be made to achieve the developers' specific goals, such as compliance with system-related and business-related constraints, which will vary from one implementation to another. Moreover, it will be appreciated that such a development effort might be complex and time-consuming, but would nevertheless be a routine undertaking for those of ordinary skill in the art having the benefit of this disclosure.

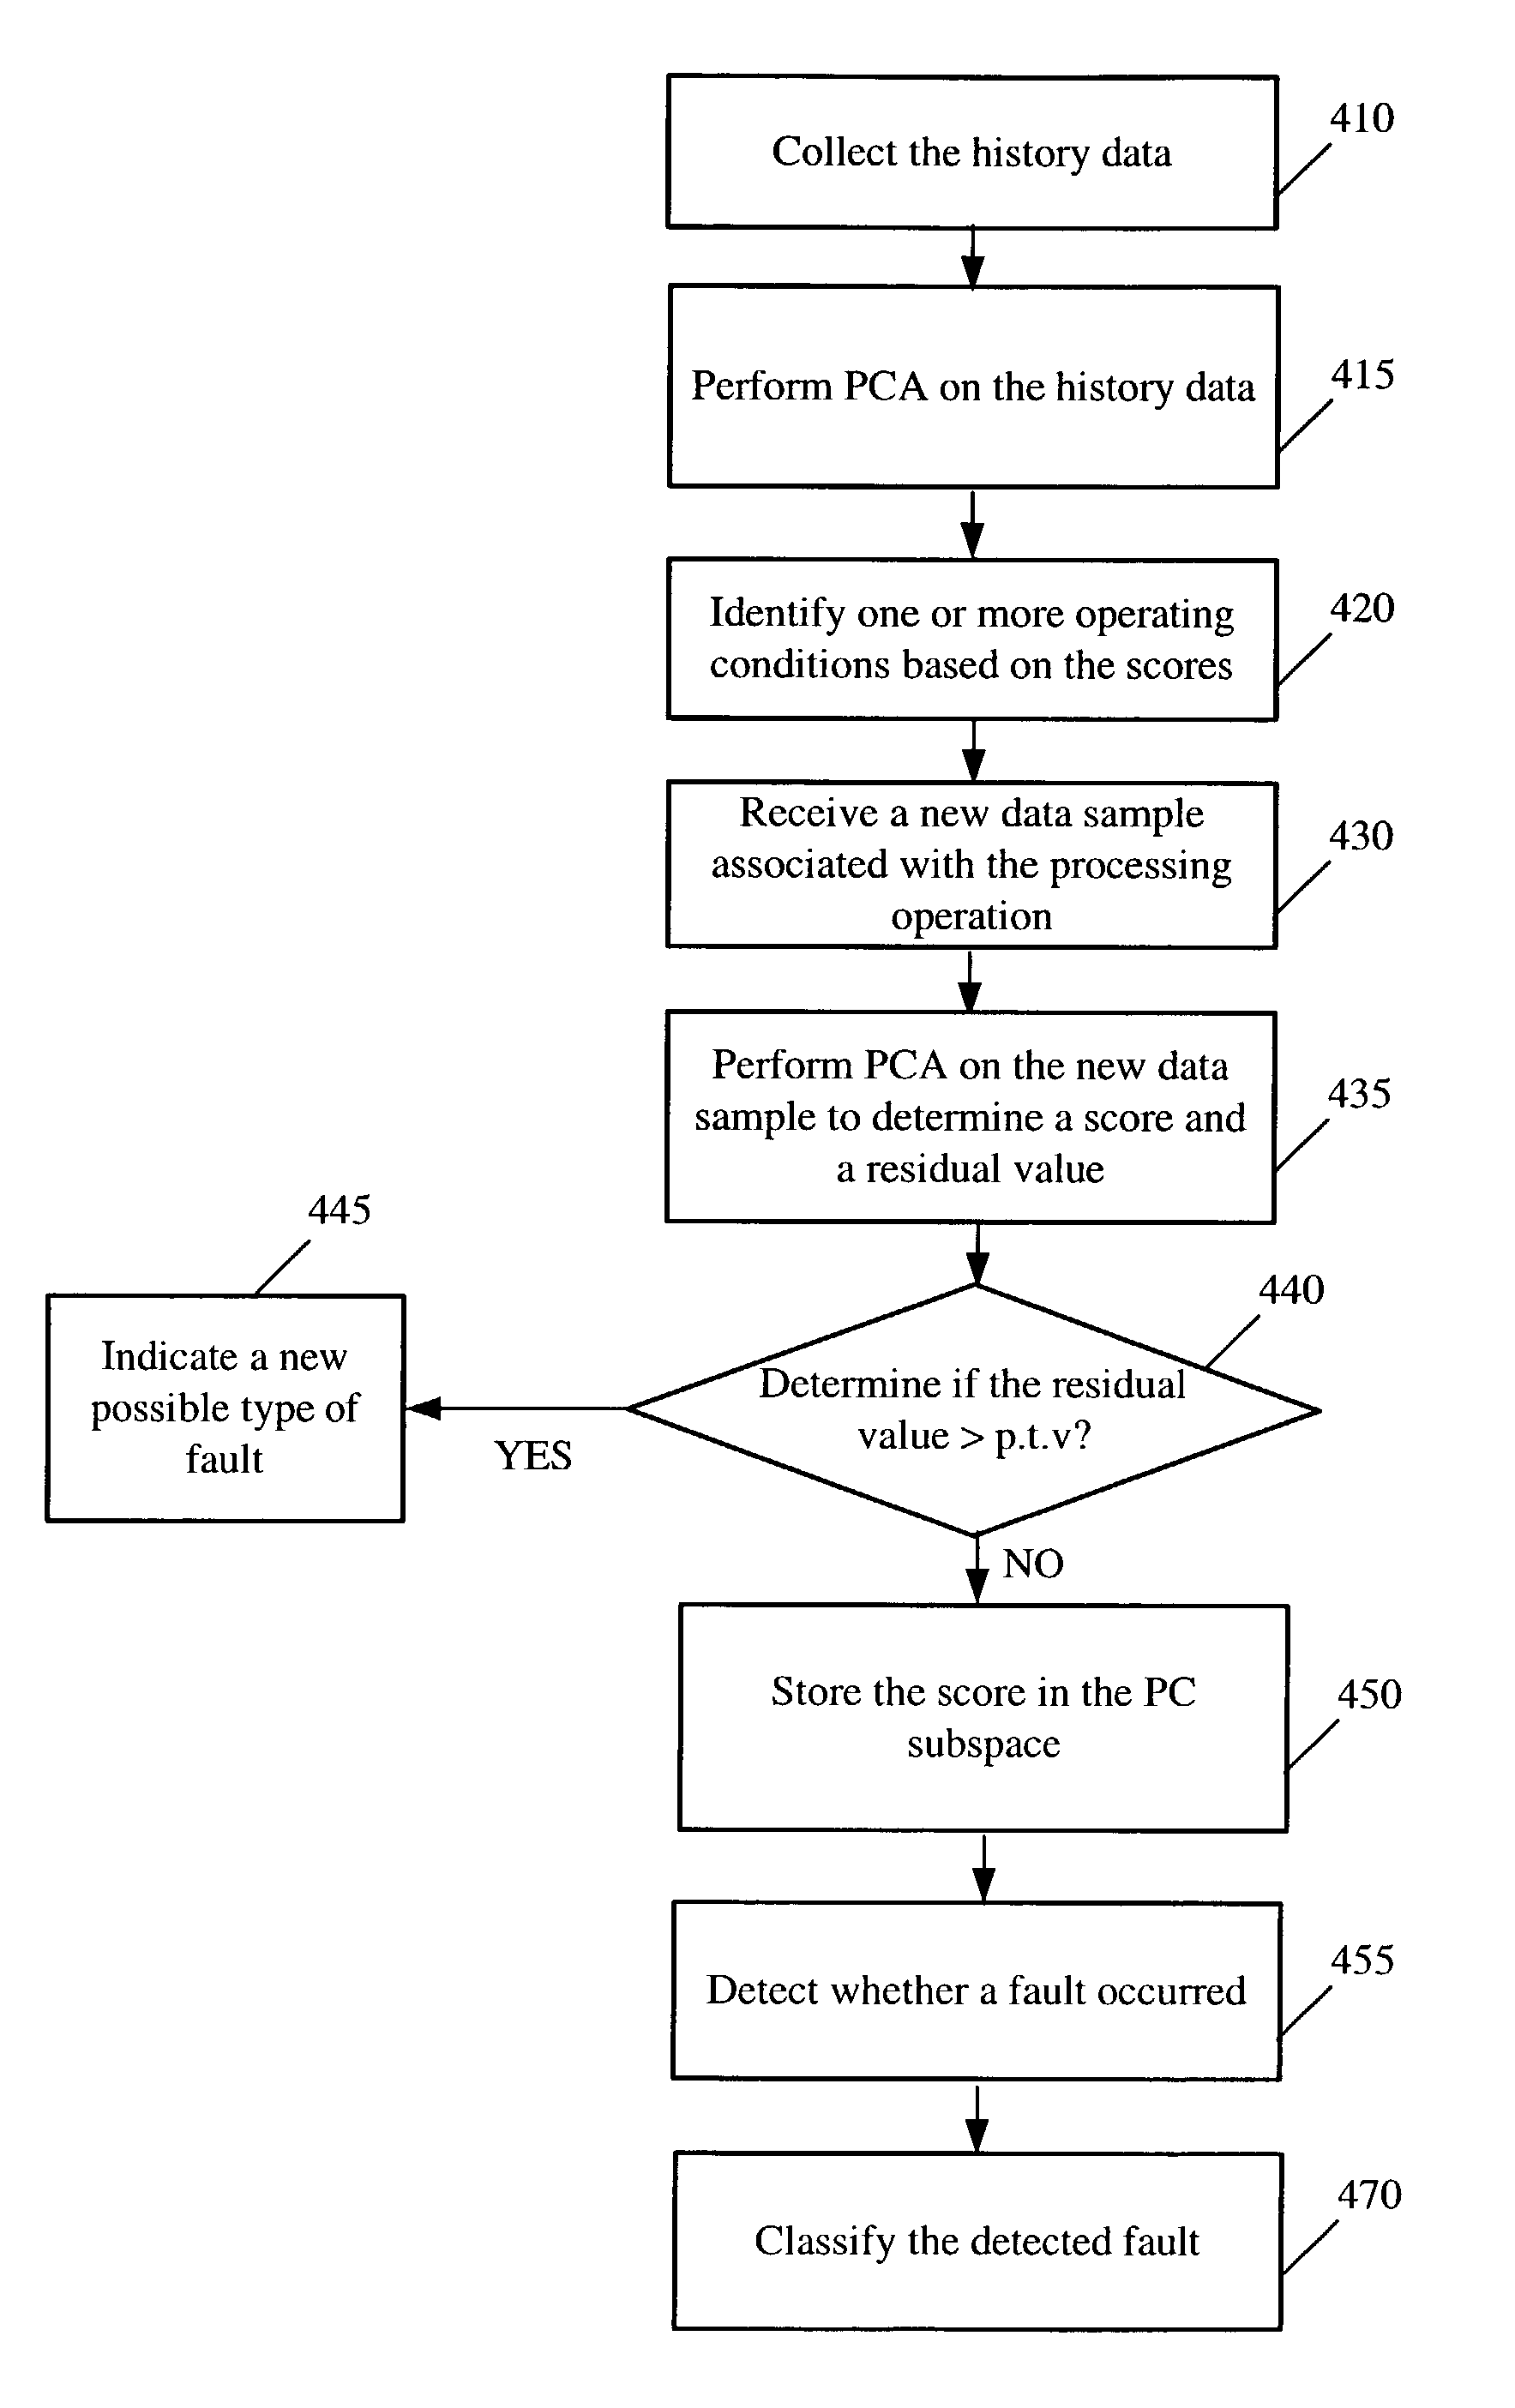
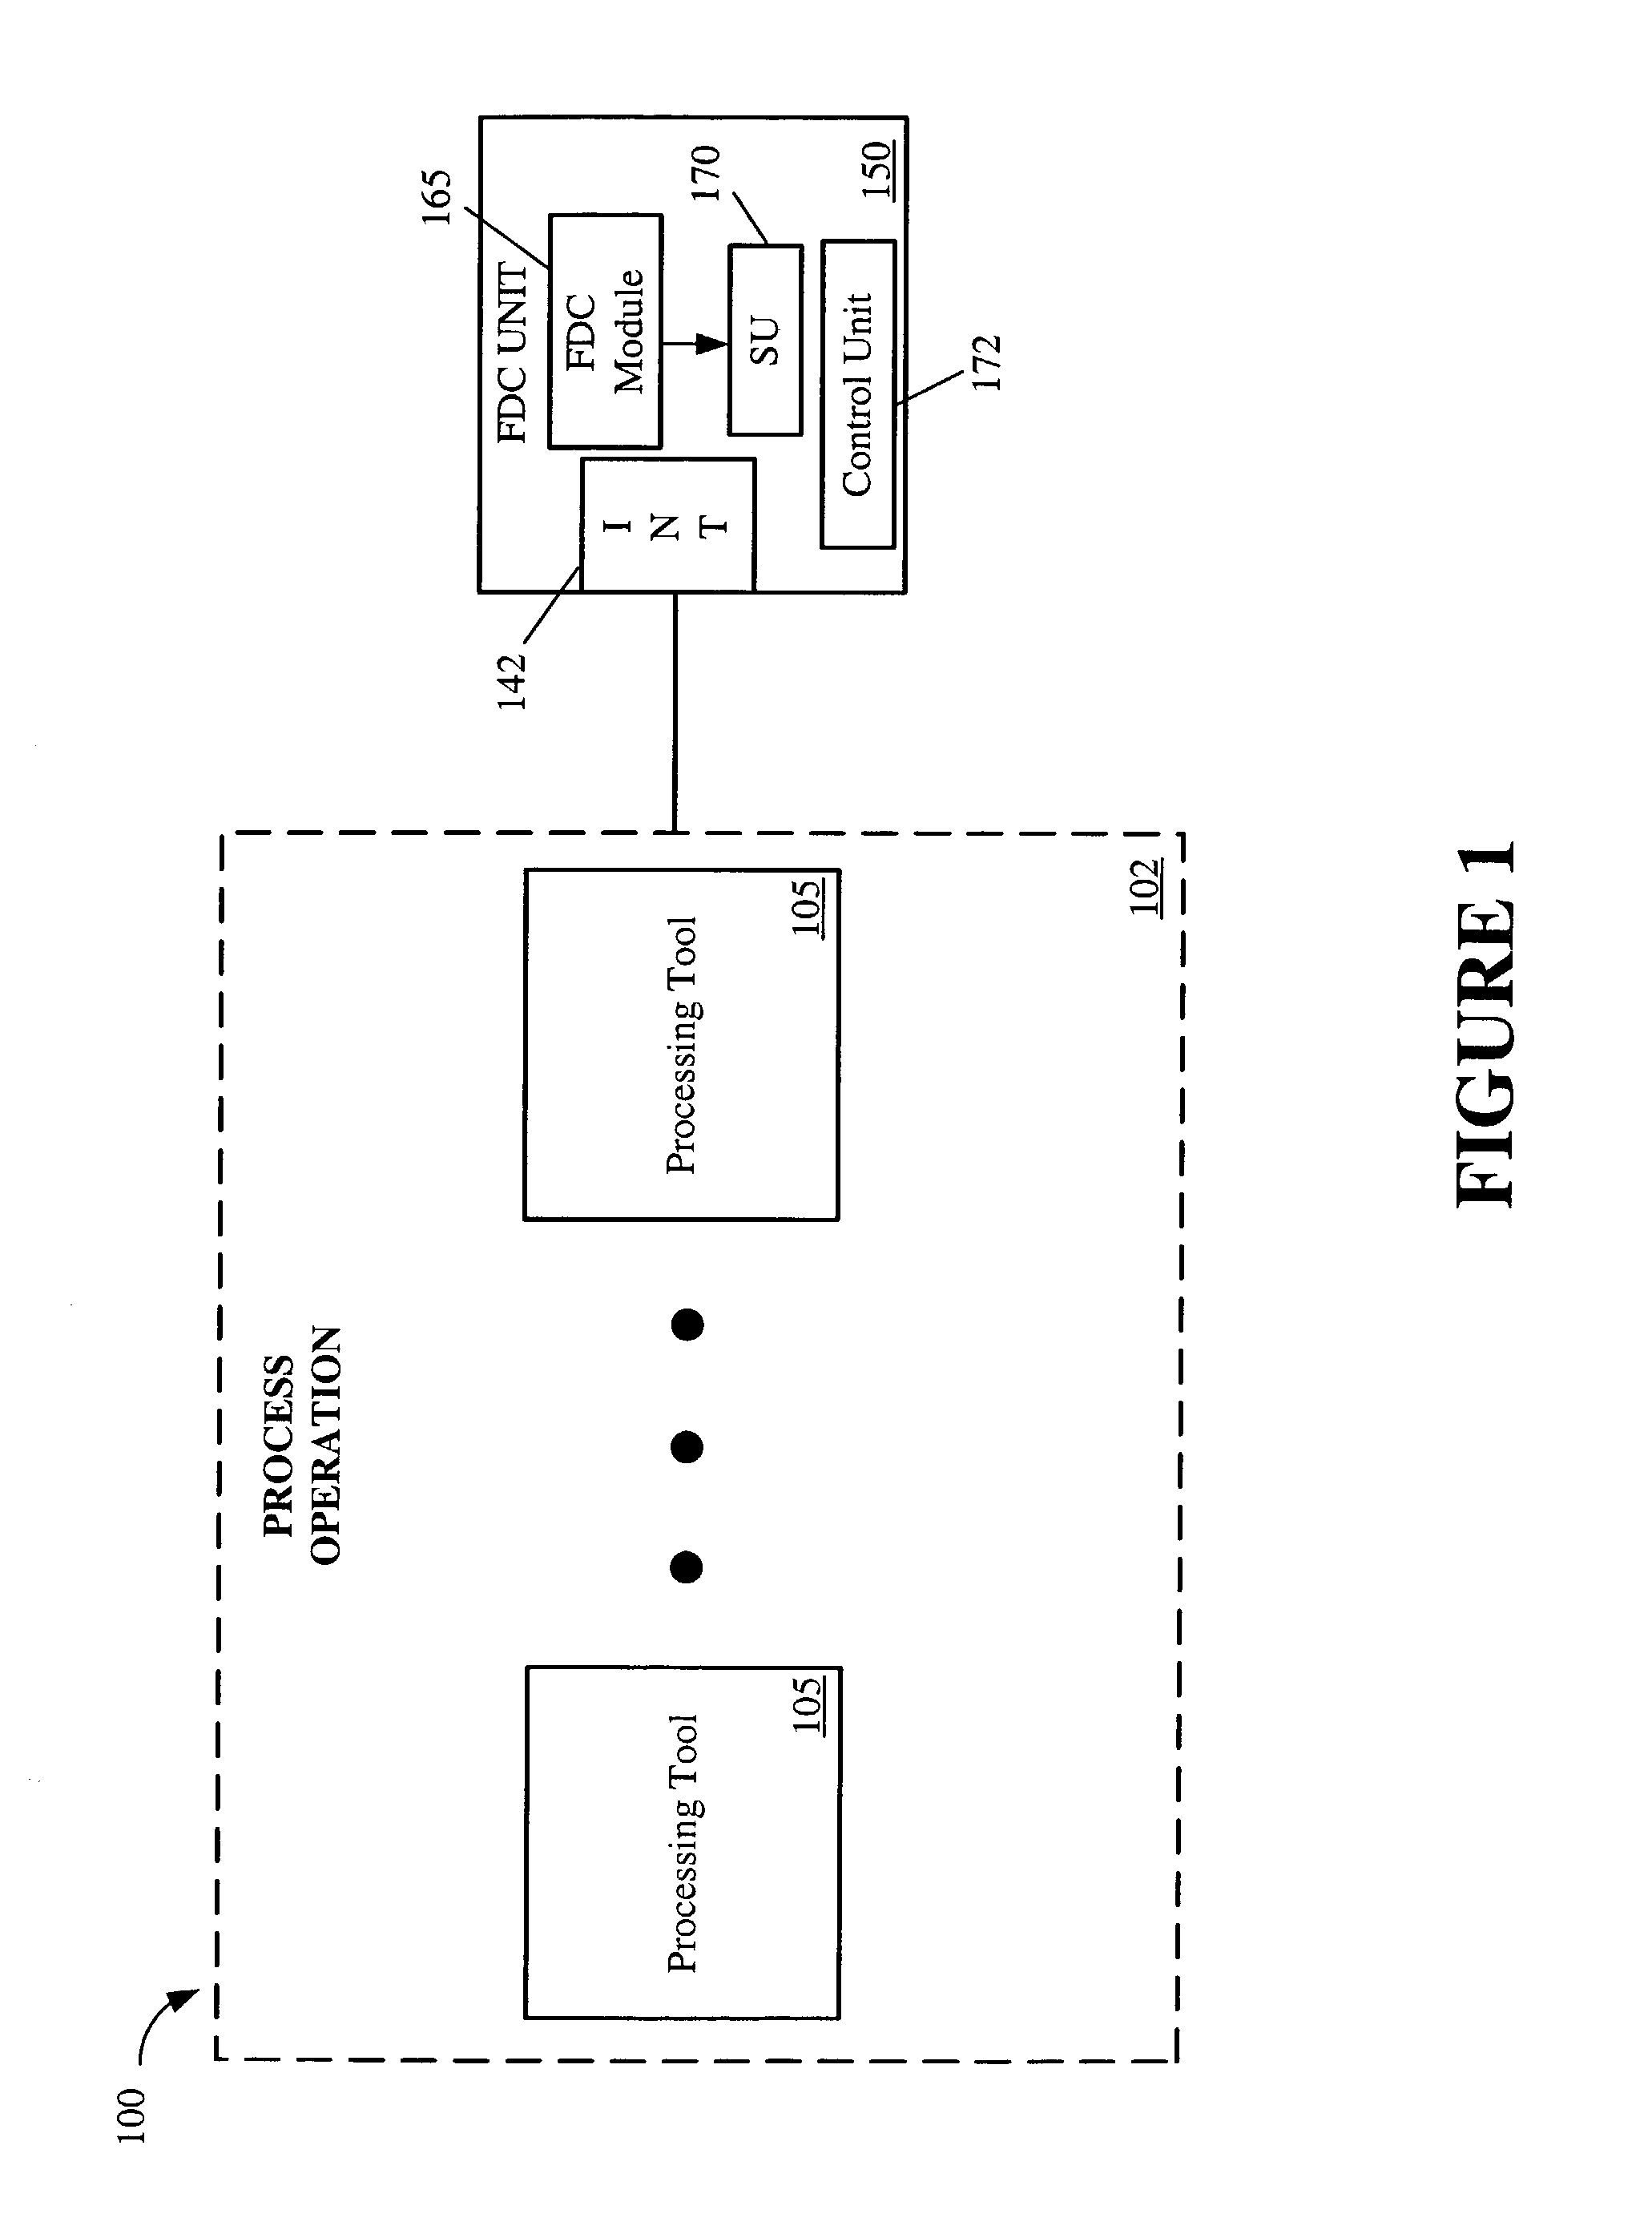
[0020]Turning now to the drawings, and specifically referring to FIG. 1, a block diagram of a system 100 is illustrated, in accordance with one embodiment of the present invention. The system 100 in the illustrated embodiment is capable of performing an industrial process, such a...


PUM


Abstract

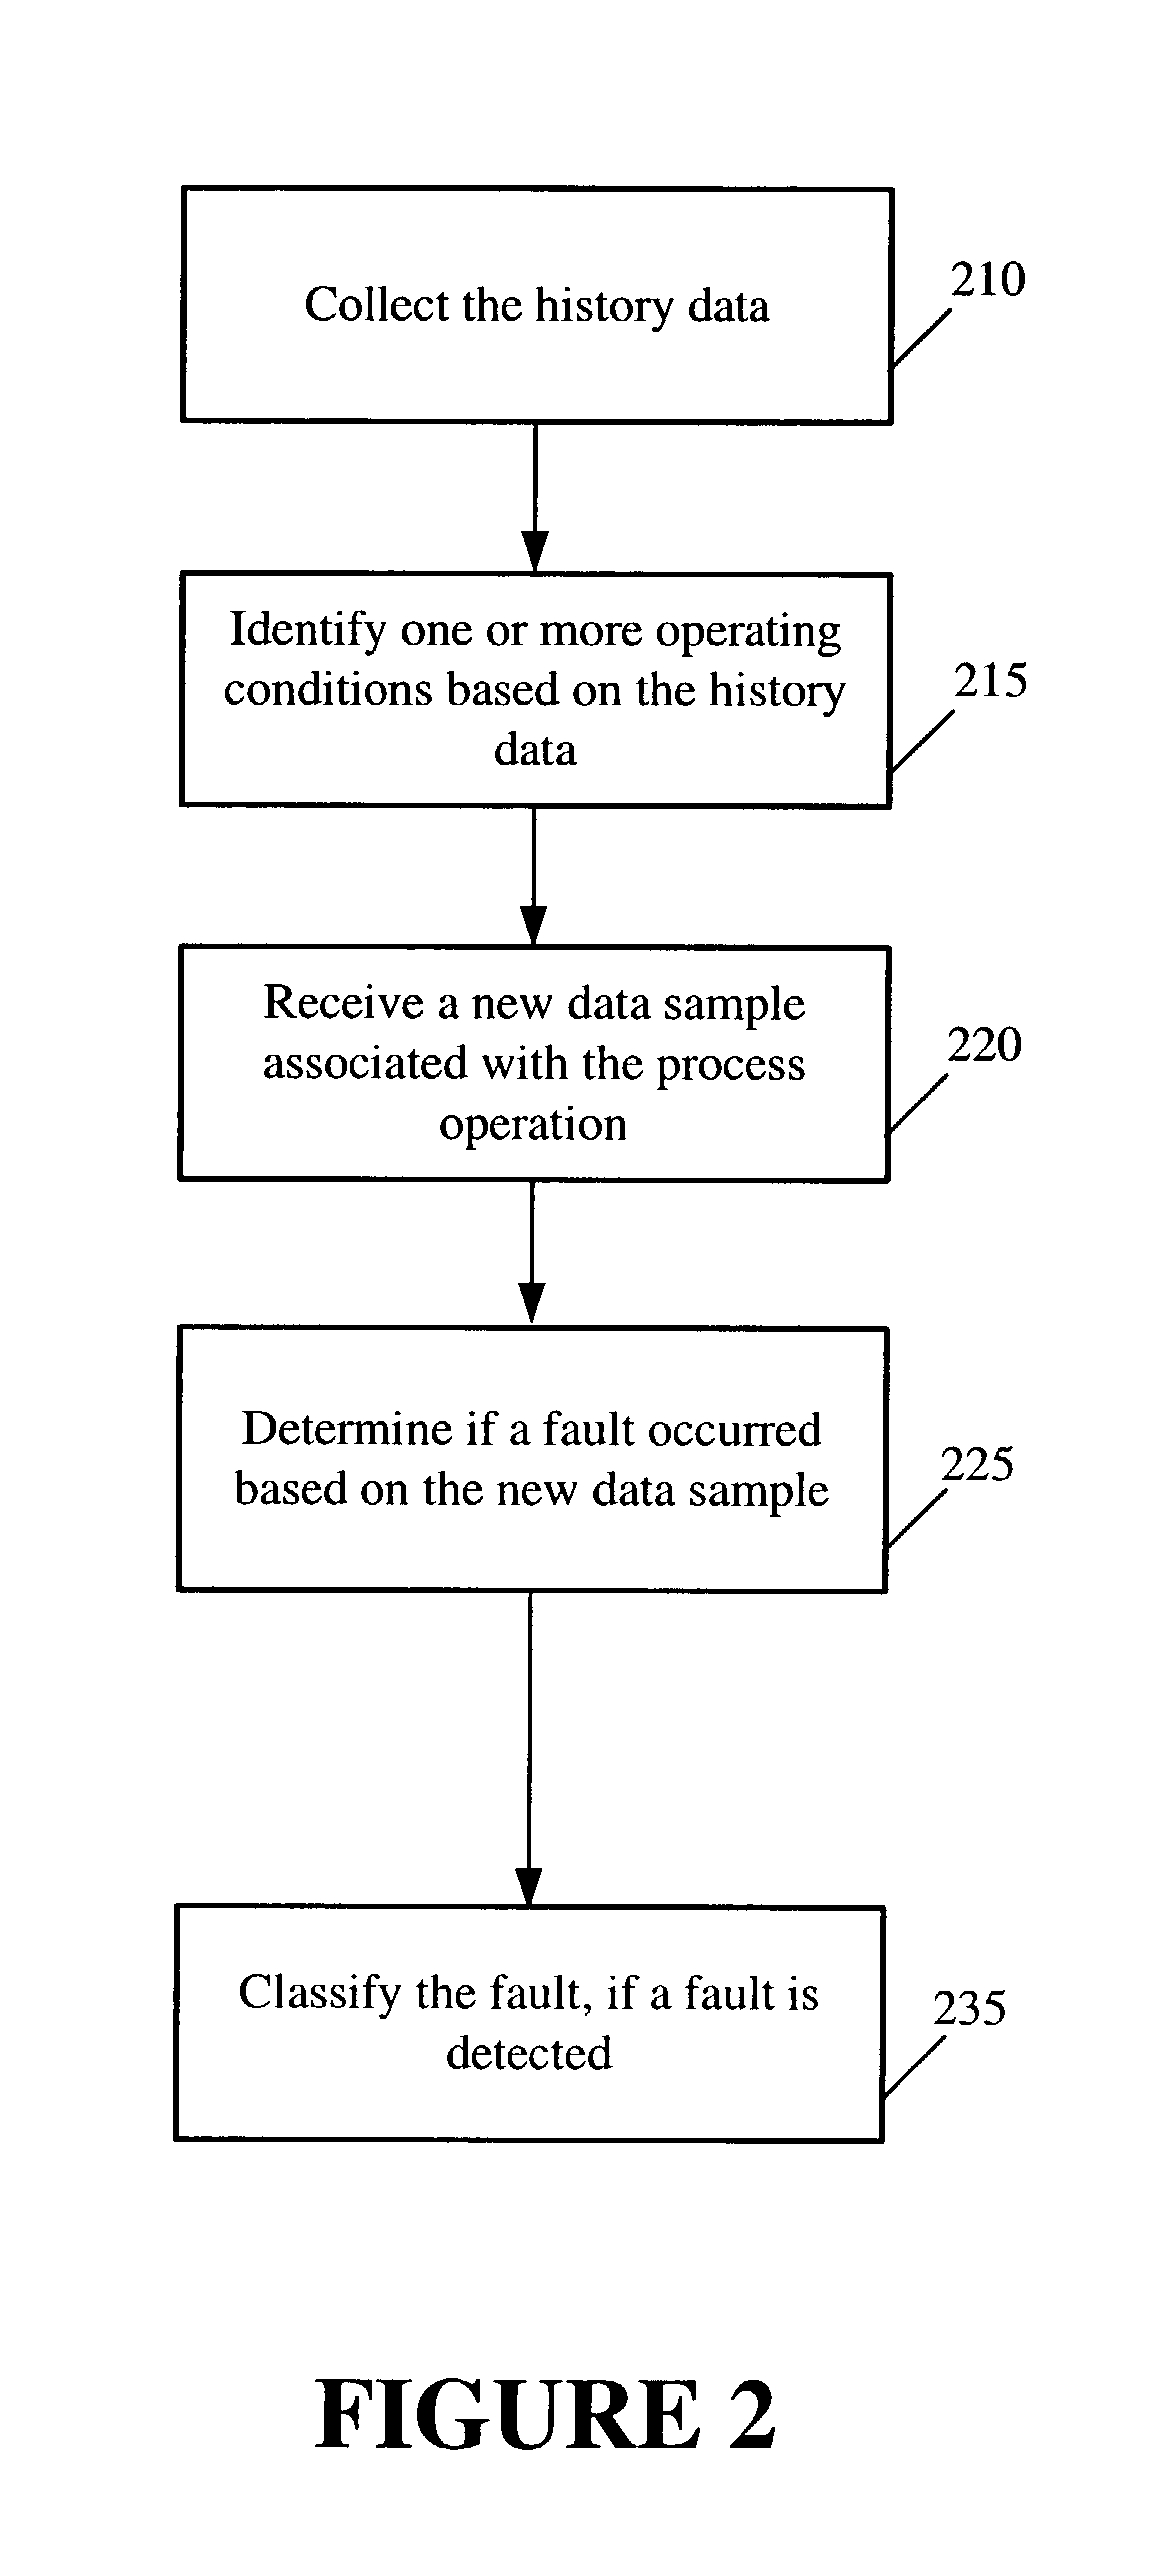
A method and apparatus is provided for fault detection and classification based on calculating distances between data points. The method comprises receiving a data sample representative of measurements of one or more variables associated with a process operation, determining a distance between the data sample and one or more data points of a history data of the process operation and detecting a fault associated with the process operation based on the distance between the data sample and the one or more data points of the history data.

Description

BACKGROUND OF THE INVENTION[0001]1. Field of the Invention[0002]This invention relates generally to an industrial process, such as a semiconductor manufacturing process, a photographic process or a chemical process. More particularly, the invention relates to detecting and classifying faults in the industrial process based on calculating distances between data points.[0003]2. Description of the Related Art[0004]There is a constant drive to increase the quality, reliability, and throughput of industrial processes, which may include, but are not limited to, semiconductor manufacturing processes, photography processes, and / or chemical processes. In an effort to improve the overall process, the trend has been to measure and record more process variables than before, variables such as temperature, pressure, and concentrations of gas mixtures or chemical agents, and to use those measured variables in controlling the process.[0005]The amount of data that is collected for a given process in...

Claims


Application Information

Patent Timeline
IPC IPC(8): G06F19/00
CPCG05B23/024
Inventor WANG, JINCHERRY, GREGORY A.
Owner GLOBALFOUNDRIES INC
Learn More