Method and system for displaying network performance, cost, maintenance, and infrastructure wiring diagram

a network performance and infrastructure wiring diagram technology, applied in the direction of transmission monitoring, receiver monitoring, instruments, etc., can solve the problems of reducing the workload of wireless system design engineers and technicians to deploy such systems, maximizing the performance of wireless systems, and reducing the cost of in-building and microcellular wireless communication devices. achieve the effect of facilitating the three-dimensional, multi-colored display of predicted performance results

Inactive Publication Date: 2007-07-10
WIRELESS VALLEY COMM
View PDF112 Cites 71 Cited by
  • Summary
  • Abstract
  • Description
  • Claims
  • Application Information

AI Technical Summary

Benefits of technology

[0024]It is therefore an object of the present invention to facilitate the three-dimensional, multi-colored display of predicted performance results for any type of wireless communication system, or any communication system, network, or the like which includes wireless communication components.
[0028]It is yet another object of the present invention to provide a mechanism for coloring, shading, and otherwise rendering a solid representation of said three-dimensional display utilizing multiple colors and transparency effects.
[0030]According to the present invention, a system is provided for allowing a RF system designer to dynamically model a wireless system electronically in any environment. The method includes the selection and placement of models of various wireless system hardware components, such as antennas (point, omnidirectional, directional, leaky feeder, etc.), transceivers, amplifiers, cables, splitters, and the like, and allows the user to visualize, in three-dimensions, the effects of their placement and movement on overall system performance throughout the modeled environment. Thus, the placement of components can be refined and fine-tuned prior to actual implementation of a system to ensure that all required regions of the desired service area are blanketed with adequate RF coverage, data throughput, or system performance. The three-dimensional (3-D) visualization of system performance provides RF system designers with tremendous insight into the functioning of the modeled wireless communication system, and represents a marked improvement over previous visualization techniques.

Problems solved by technology

As wireless communication systems proliferate, radio frequency (RF) coverage within and around buildings, and radio signal penetration into and out of buildings, has become a critical design issue for wireless engineers who must design and deploy cellular telephone systems, paging systems, or new wireless technologies such as personal communication systems,(PCS), wireless local area networks (WLAN), and local multi-point distribution systems (LMDS).
The costs of in-building and microcellular wireless communication devices are diminishing while the workload for wireless system design engineers and technicians to deploy such systems is increasing sharply.
Thus, maximizing the performance of a wireless system may involve the complex analysis of multiple, potentially unrelated factors.
Such displays, although useful, are limited by their two-dimensional nature in conveying all nuances of the wireless system performance.
While most of the above papers describe a comparison of measured versus predicted RF signal coverage and present tabular or two dimensional (2-D) methods for representing and displaying predicted data, they do not report a comprehensive method for visualizing and analyzing wireless system performance.
The “Radio Propagation” and “Site-Specific” papers make reference to 3-D modeling, but do not offer display methods or graphical techniques to enable a user to visualize signal coverage or interference in 3-D.

Method used


Image

  • Method and system for displaying network performance, cost, maintenance, and infrastructure wiring diagram
  • Method and system for displaying network performance, cost, maintenance, and infrastructure wiring diagram
  • Method and system for displaying network performance, cost, maintenance, and infrastructure wiring diagram

Examples


Embodiment Construction

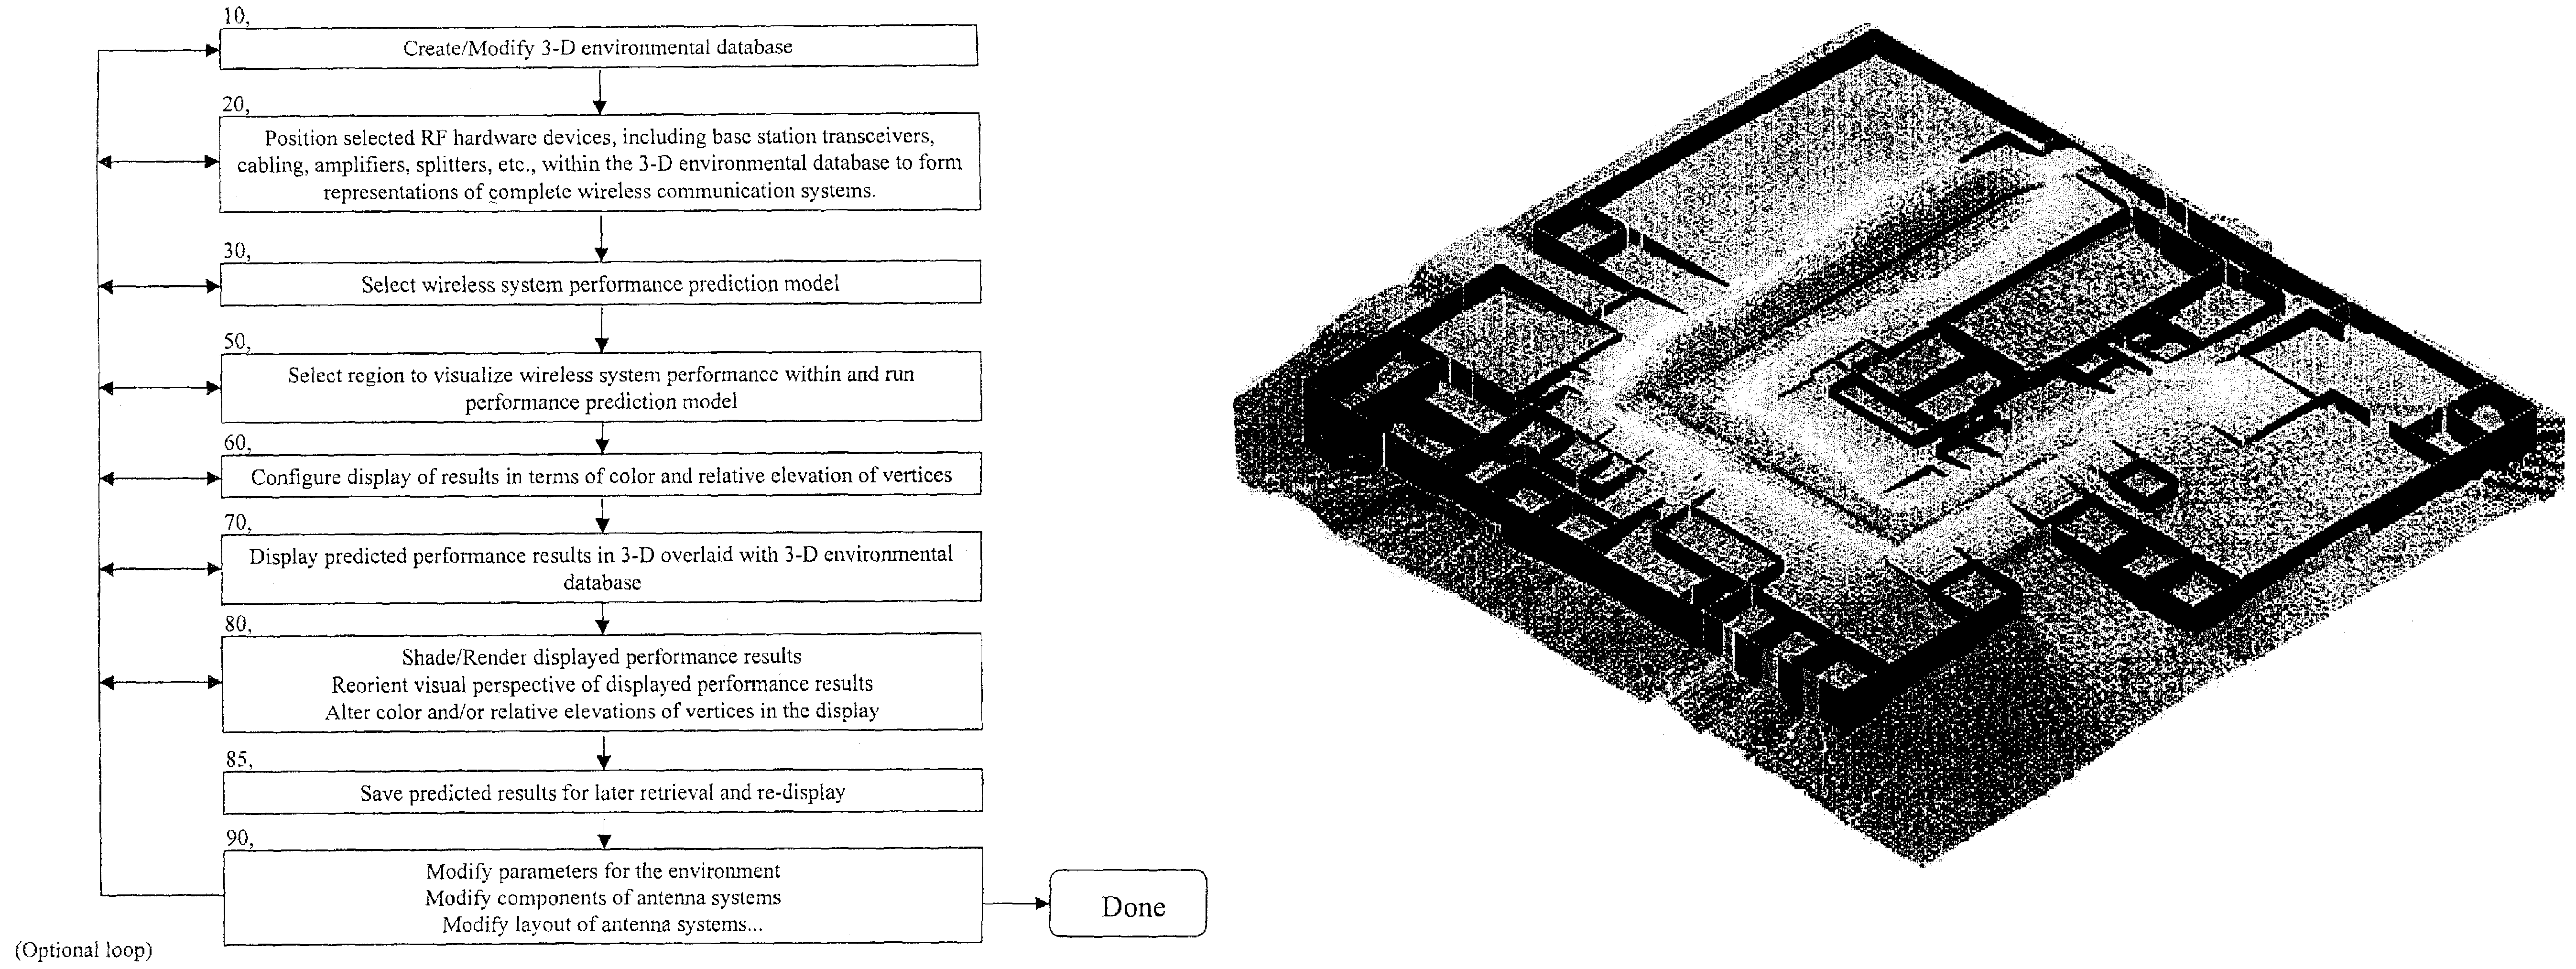
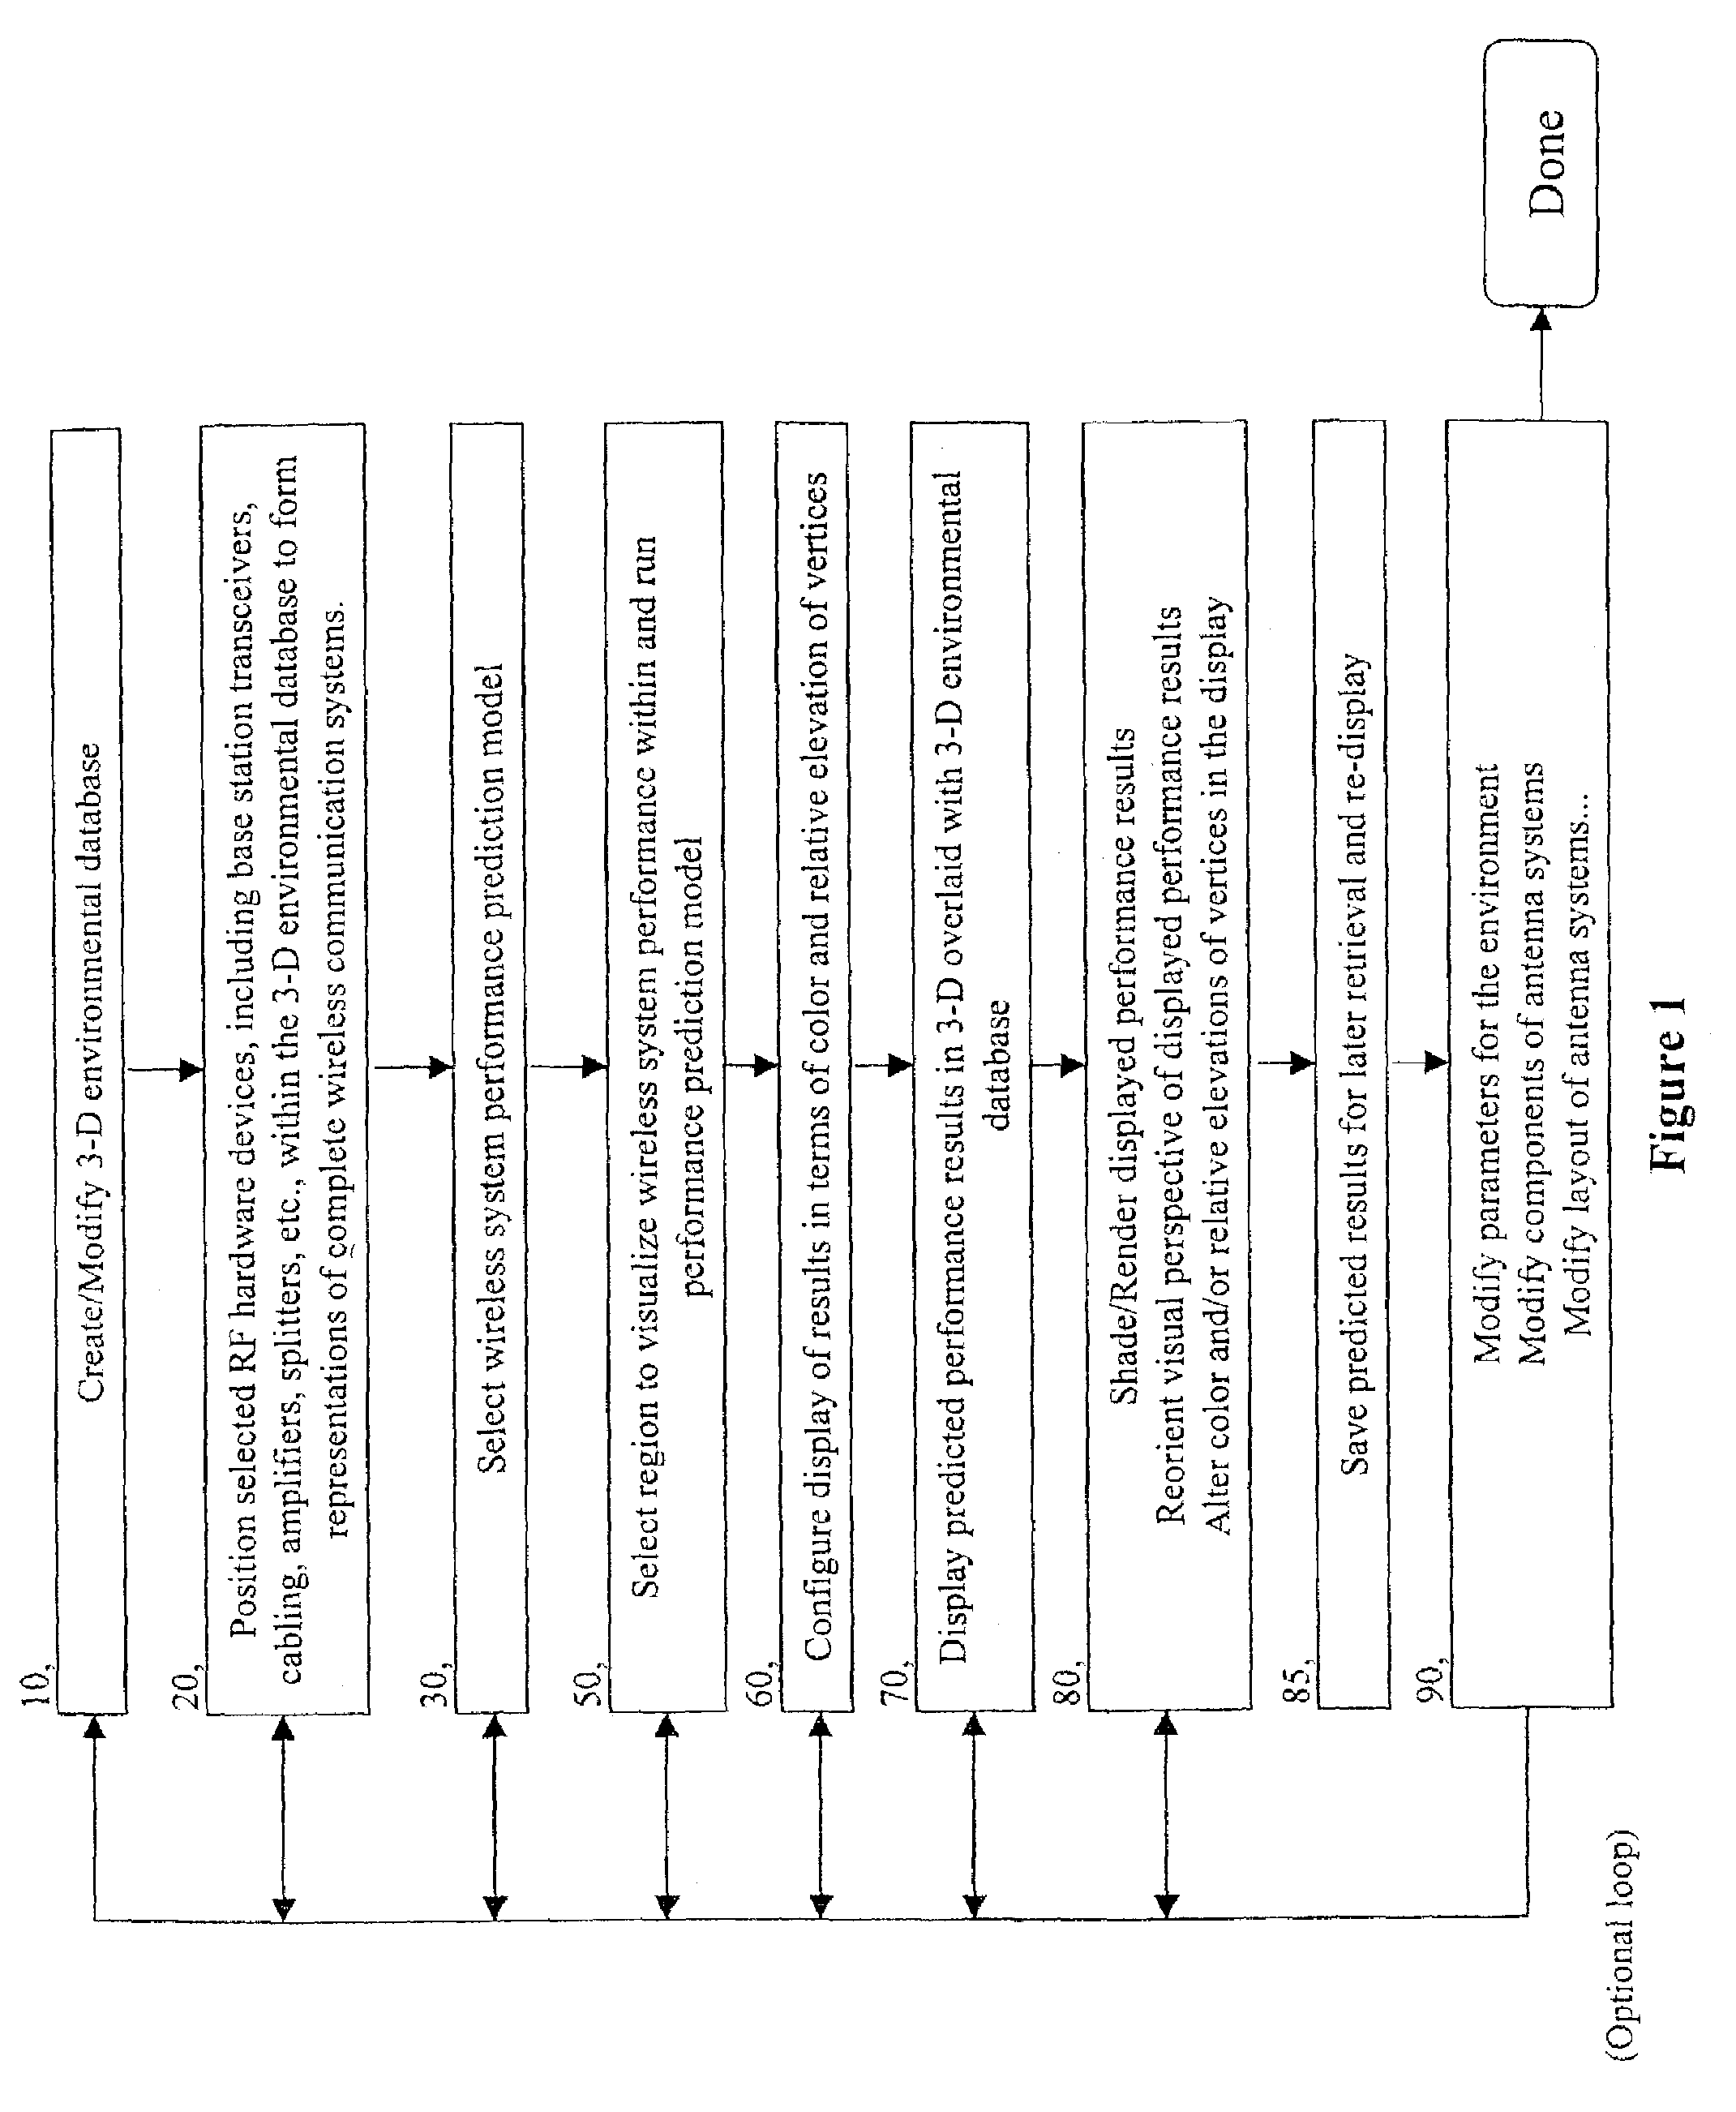
[0048]The present method and apparatus allow for assessing the performance of a wireless communication system to a much higher level of precision than previously possible. The present method is a significant advance over the prior art in the display of predicted performance of wireless communication systems. The design of wireless communication systems is often a very complex and arduous task, with a considerable amount of effort required to simply analyze the results of predicted performance. In the prior art, the only options available for displaying predicted coverage areas involve the two-dimensional display of boundary contours or colored grids overlaid with a two-dimensional representation of the environment. It would be advantageous to a design engineer to have more information conveyed with respect to the communication system and its predicted or measured performance in the physical environment.

[0049]Referring to FIG. 1, there is shown a flow diagram according to the present...


PUM


Abstract

A network which includes electromagnetic components, such as a wireless communications system, is designed, optimized, modified and / or saved or exported to another applications program using a graphical interface. A display may present a graphical rendering of performance characteristics in a site specific manner showing elements such as walls, doors, windows, furniture, people, foliage, and terrain. The locations where performance characteristic information are presented can be automatically selected and adjusted to present more or less information. The display can be viewed at multiple perspectives, and the viewing angle can be adjusted. In one embodiment, the display can graphically present information related to two different performance characteristics. An infrastructure wiring diagram can be generated for analysis or for exportation to other applications using the system, wherein after components are positioned and connected within the context of a site map, the site map itself is eliminated or significantly reduced in prominence.

Description

CROSS-REFERENCE TO RELATED APPLICATIONS[0001]This application is a continuation-in-part (CIP) application of U.S. Ser. No. 10 / 244,409filed Sep. 17, 2002, which is a continuation of U.S. patent application Ser. No. 09 / 352,678filed Jul. 14, 1999, now U.S. Pat. No. 6,499,006, and the complete contents of these applications is herein incorporated by reference. The invention described is also related to U.S. Pat. Nos. 6,317,599, 6,442,507, and 6,493,679, and the complete contents of these patents are herein incorporated by reference.DESCRIPTIONBACKGROUND OF THE INVENTION[0002]1. Field of the Invention[0003]The present invention generally relates to engineering and management systems for the design, maintenance and optimization of communication systems. More particularly, the invention is directed to a method and apparatus for displaying the performance of wireless communication systems in any environment (e.g., buildings, floors within a building, campuses, within cities, an outdoor sett...

Claims


Application Information

Patent Timeline
Patent Type & Authority Patents(United States)
IPC IPC(8): G06F17/50G06F17/10G06F3/00H04B17/00H04W16/20
CPCH04W16/20H04B17/23H04B17/3913H04B17/309H04B17/318H04B17/336
Inventor RAPPAPORT, THEODORE S.SKIDMORE, ROGER R.
Owner WIRELESS VALLEY COMM
Why Eureka
Try Eureka