Systems and methods for visualization of data sets containing interrelated objects

a technology of data sets and objects, applied in the field of visualization systems and methods, can solve the problems of not simplifying the display of data to the user, and achieve the effect of easy comprehension and easy navigation of visual representation

Inactive Publication Date: 2007-09-11
MOON GLOW SERIES 82 OF ALLIED SECURITY TRUST I
View PDF14 Cites 45 Cited by
  • Summary
  • Abstract
  • Description
  • Claims
  • Application Information

AI Technical Summary

Benefits of technology

[0007]The present invention discloses methods and systems for the visualization of data sets containing a large number of interrelated objects (or items) from data sets having two properties, namely that subsets of items in a data set relate to each other, a

Problems solved by technology

However, the visualization system of the '139 patent fail to represent data sets having two properties, namely that subsets of items in a data set relate to each other, and the relationships between items have an affinity value

Method used


Image

  • Systems and methods for visualization of data sets containing interrelated objects
  • Systems and methods for visualization of data sets containing interrelated objects
  • Systems and methods for visualization of data sets containing interrelated objects

Examples


Embodiment Construction

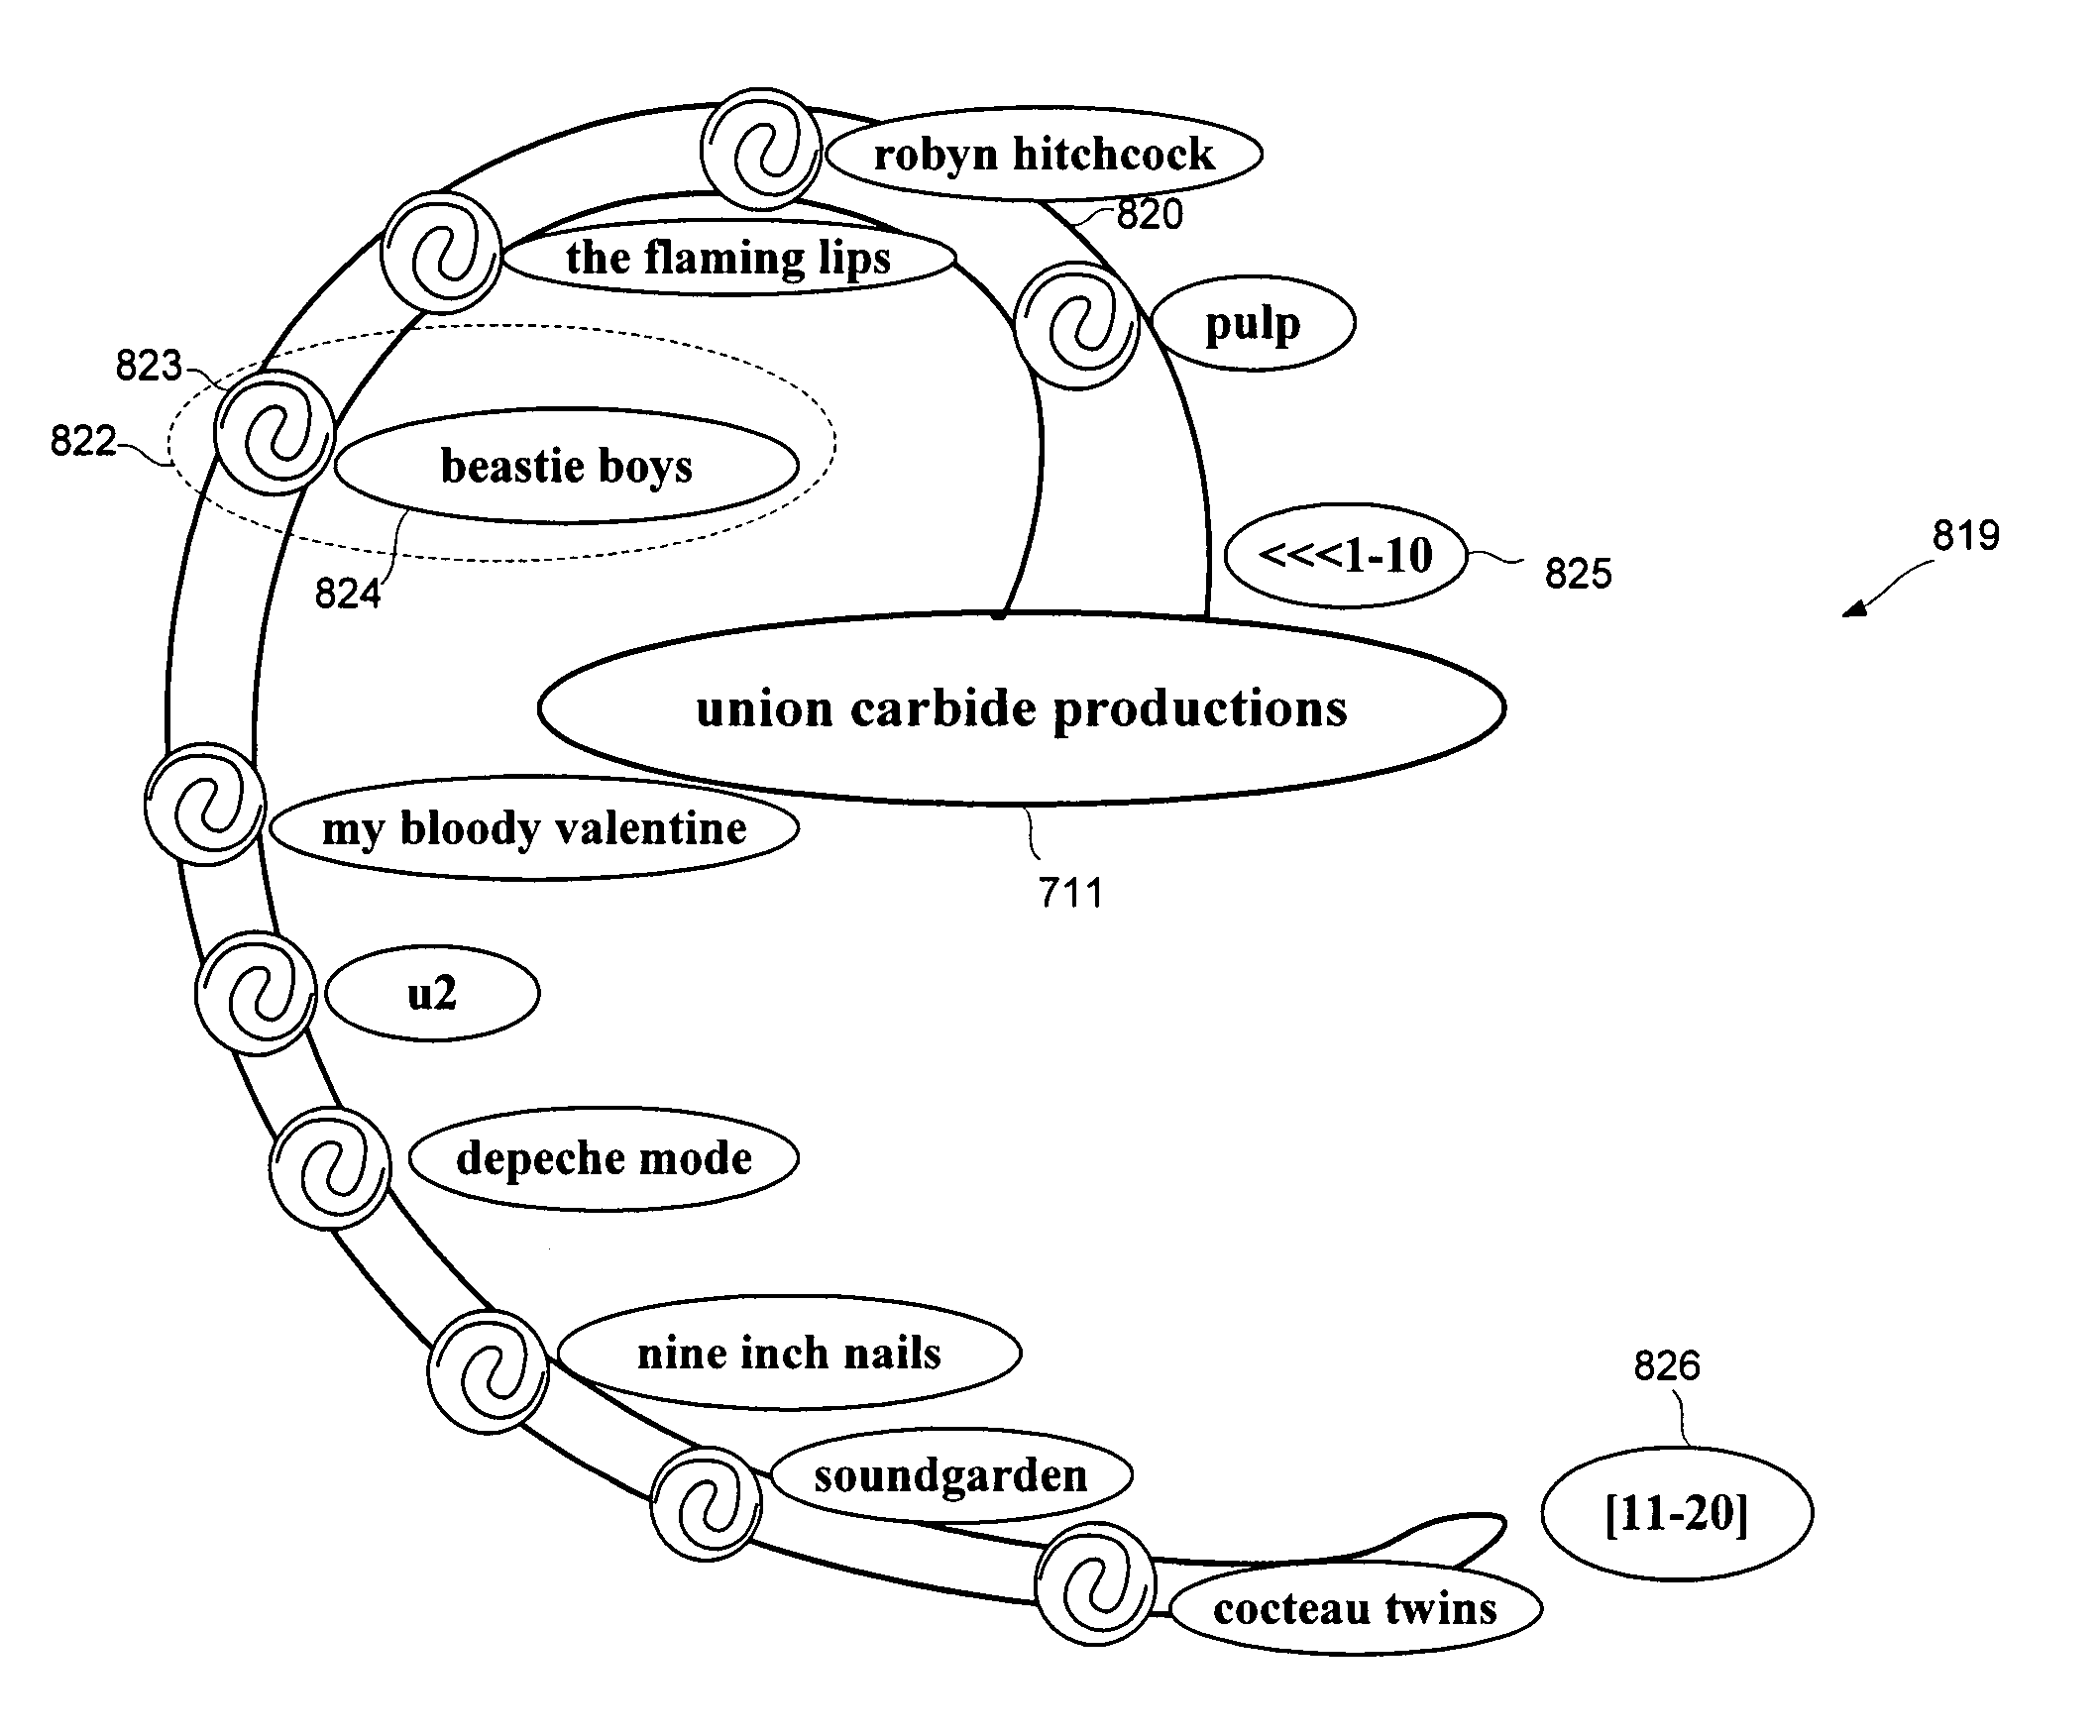
[0018]Visualization of a data set refers to the use of various techniques to convey the overall structure of information by visual means. In particular, visual cues can be used to represent relations between objects. Visual cues can include, for example, using segments of a curve to represent the affinity (or strength) of the relationship between objects, and using gradations of the width and color of the curves to represent the intensity of the affinity relationships between the objects.

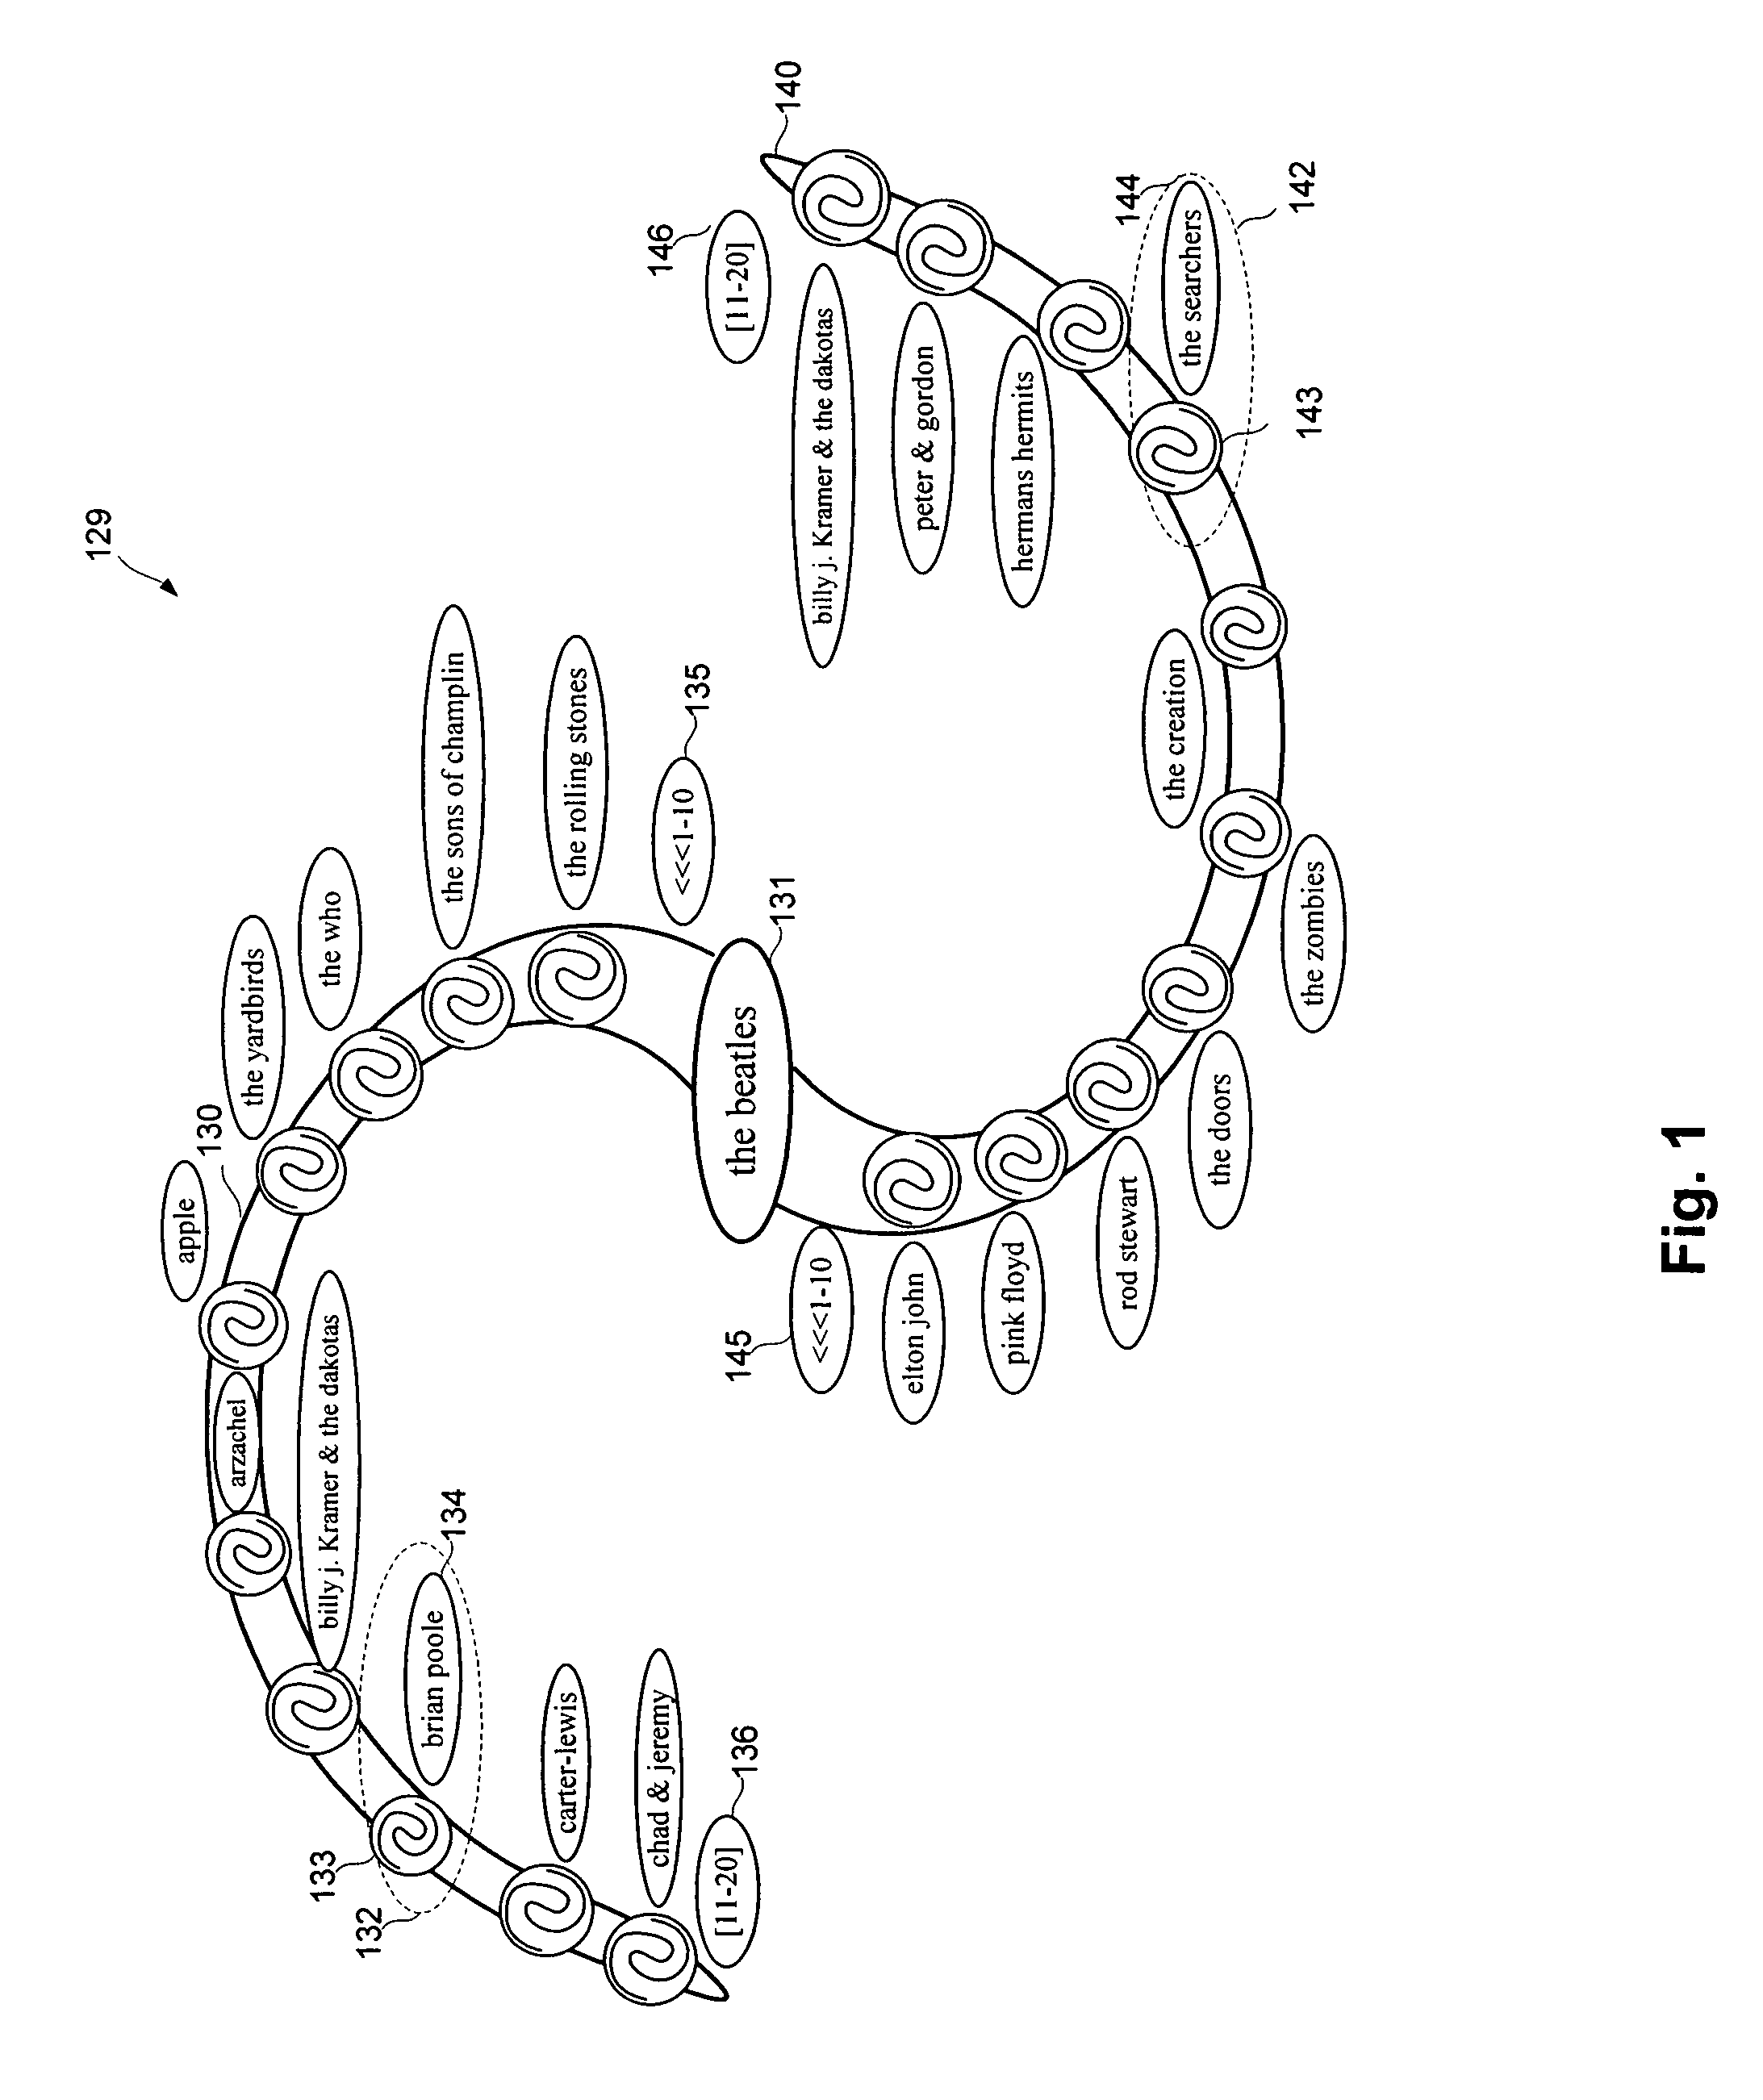
[0019]Referring now to FIG. 1, there is shown a diagram of most closely related items according to the present invention. In particular, FIG. 1 shows an affinity chart 129 including first and second affinity curves 130 and 140 including a principal item 131 and first and second pluralities of related items 132 and 142. Each related item 132, 142 includes a navigational link 133, 143 respectively and a search link 134, 144 respectively. Adjacent to the principal item 131 and at one end of a selected ...


PUM


Abstract

A visualization of a set of related data items is accomplished by ranking a plurality of secondary data items with respect to their relationship to a principal data item. The set of related data items may be stored in any form, including, for example, as a relational database, an object database, or an XML document. The related items display names can be formatted and ranked according to the properties of the item, so as to avoid duplication and information overload for the user. The ranked data can be displayed along curved segments in a graphical chart, so as to allow convenient visualization of the data and the data's relationship to the principal item that may be prominently displayed at the center of the chart.

Description

RELATED APPLICATIONS[0001]The present application claims priority to Provisional Application No. 60 / 162,465 filed Oct. 29, 1999. The present application also relates to co-pending U.S. application Ser. No. 09 / 574,108, filed May 19, 2000. Each of the above referenced applications is incorporated herein by reference in its entirety.BACKGROUND[0002]1. Field of the Invention[0003]The present invention relates to visualization systems and methods and more particularly to systems and methods for enabling visualization of data sets containing large numbers of objects.[0004]2. Description of the Related Art[0005]U.S. Pat. No. 5,966,139, granted to Anupam et al. and assigned to Lucent Technologies Inc., relates to scalable data segmentation and visualization. In particular, the '139 patent describes visualization of relatively large amounts of data in a limited display space, including segmentation of data, mapping of segments to a node within a display space based upon a specified nodal lay...

Claims


Application Information

Patent Timeline
IPC IPC(8): G09G5/02G06F17/30G06F7/00G06T11/20
CPCG06F17/30994G06T11/206Y10S707/99953Y10S707/99935Y10S707/99933Y10S707/99934G06F16/904
Inventor JANNINK, JAN F.
Owner MOON GLOW SERIES 82 OF ALLIED SECURITY TRUST I
Why Eureka
Try Eureka