
Method and system for displaying dendrogram

a dendrogram and data technology, applied in the field of methods and systems for displaying data, can solve the problems of difficult to find the functions of the entire gene, the complexity of the gene network can be studied, and the data will be subjected to clustering

Inactive Publication Date: 2008-01-01
HITACHI LTD
View PDF7 Cites 13 Cited by
  • Summary
  • Abstract
  • Description
  • Claims
  • Application Information

AI Technical Summary

Benefits of technology

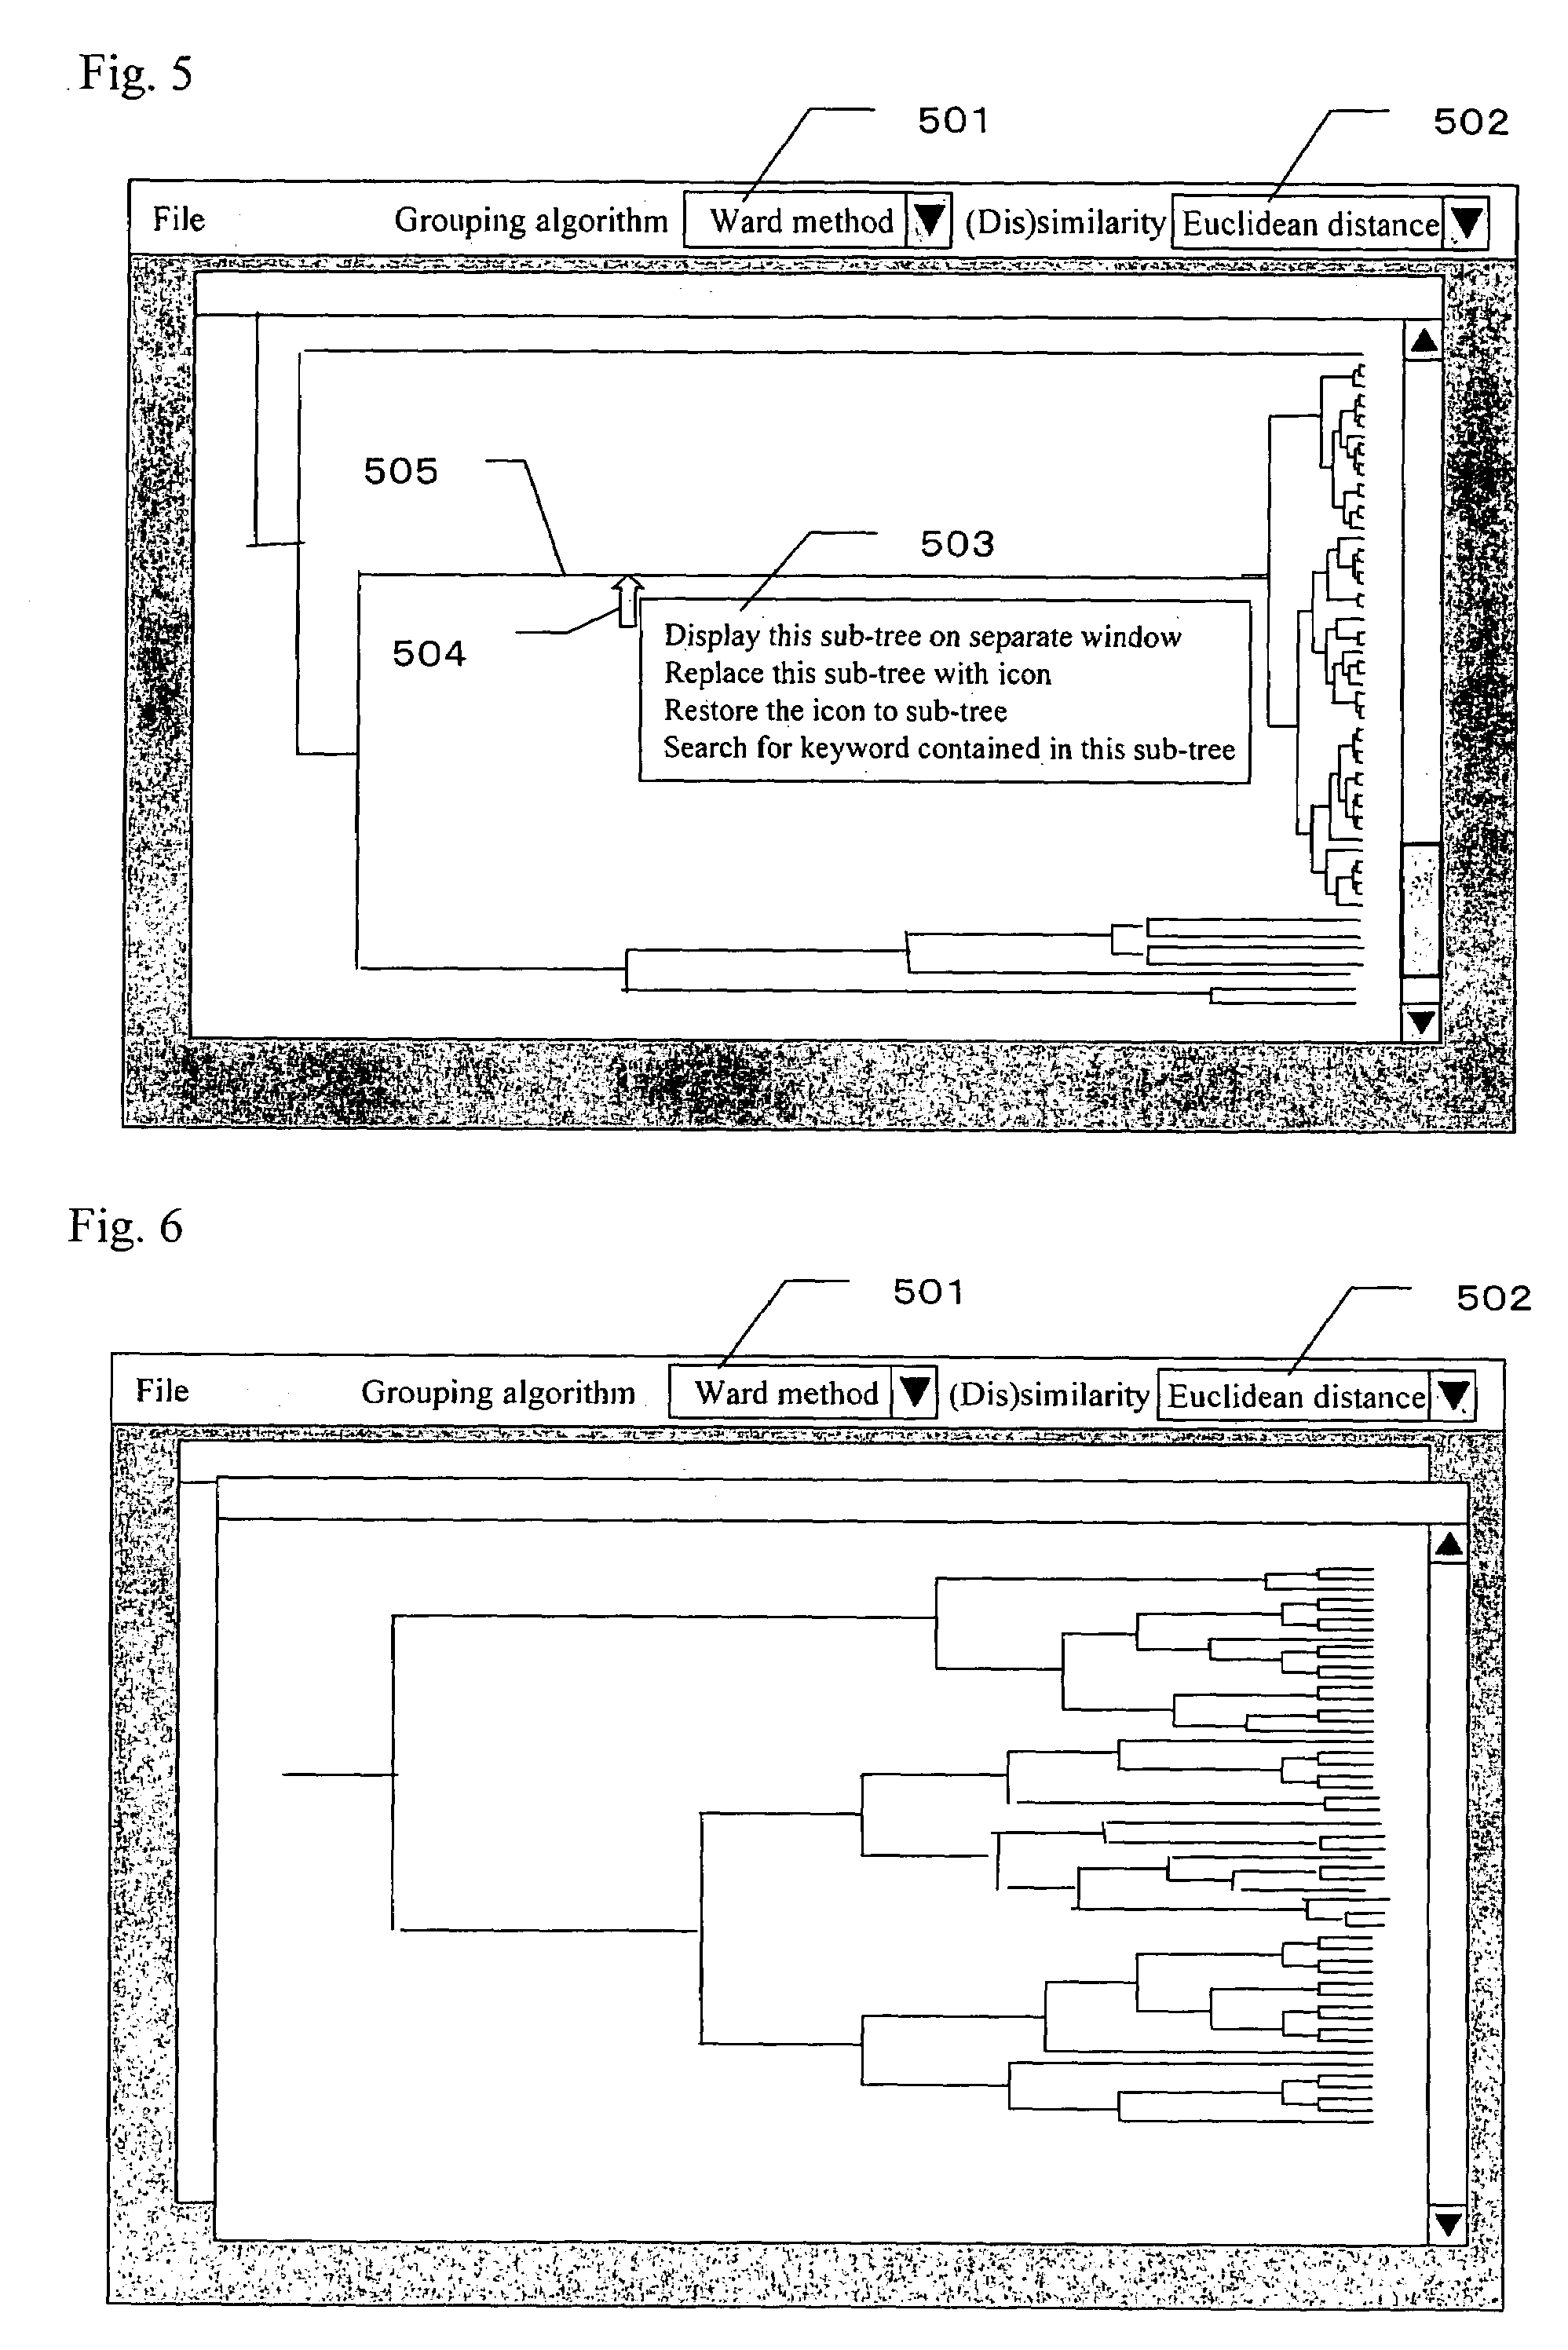
[0010]In order to achieve the above-mentioned objective, the present invention proposes a system for displaying a dendrogram which is provided with functions for selecting a branch in a dendrogram, displaying a subtree extending from the selected branch to the downstream leaves on a separate display window, replacing the subtree with an icon, restoring the icon to the subtree, and collecting and displaying keywords contained in the subtree. According to the present invention, subtrees of a produced dendrogram can be subjected to different clustering methods interactively. Keywords contained in the subtrees can be displayed in order to confirm success of clustering as well as to aid focusing of groupings and to aid selection of a clustering method.
[0017]FIG. 8 is a view showing an exemplary screen displayed upon selecting a command “search for keyword contained in this subtree” from the menu shown in FIG. 5. Among genes contained in the selected subtree, genes having gene information with a predetermined keywords are counted and the results are displayed as search results 801. When a keyword 802 is selected from the search results 801 with a mouse cursor 804 or the like, genes with this keyword 802 (in the figure, “ribosomal”) are marked on the dendrogram with marks 803 or the like. By doing so, types of genes assembled in the subtree can readily be known. When the grouping is found to be failed, another grouping algorithm or (dis)similarity can be selected for another clustering. This would aid selection of more appropriate clustering method.
[0018]According to the present invention, an analysis can be made effectively on a produced dendrogram.

Problems solved by technology

In an actual analysis of gene expression patterns, a enormous amount of data will be subjected to clustering.
Therefore, if the numbers of genes to be observed are larger, more complicated and detailed gene network can be studied.
However, as the number of genes is increased, it becomes very difficult to find the functions of the entire genes.
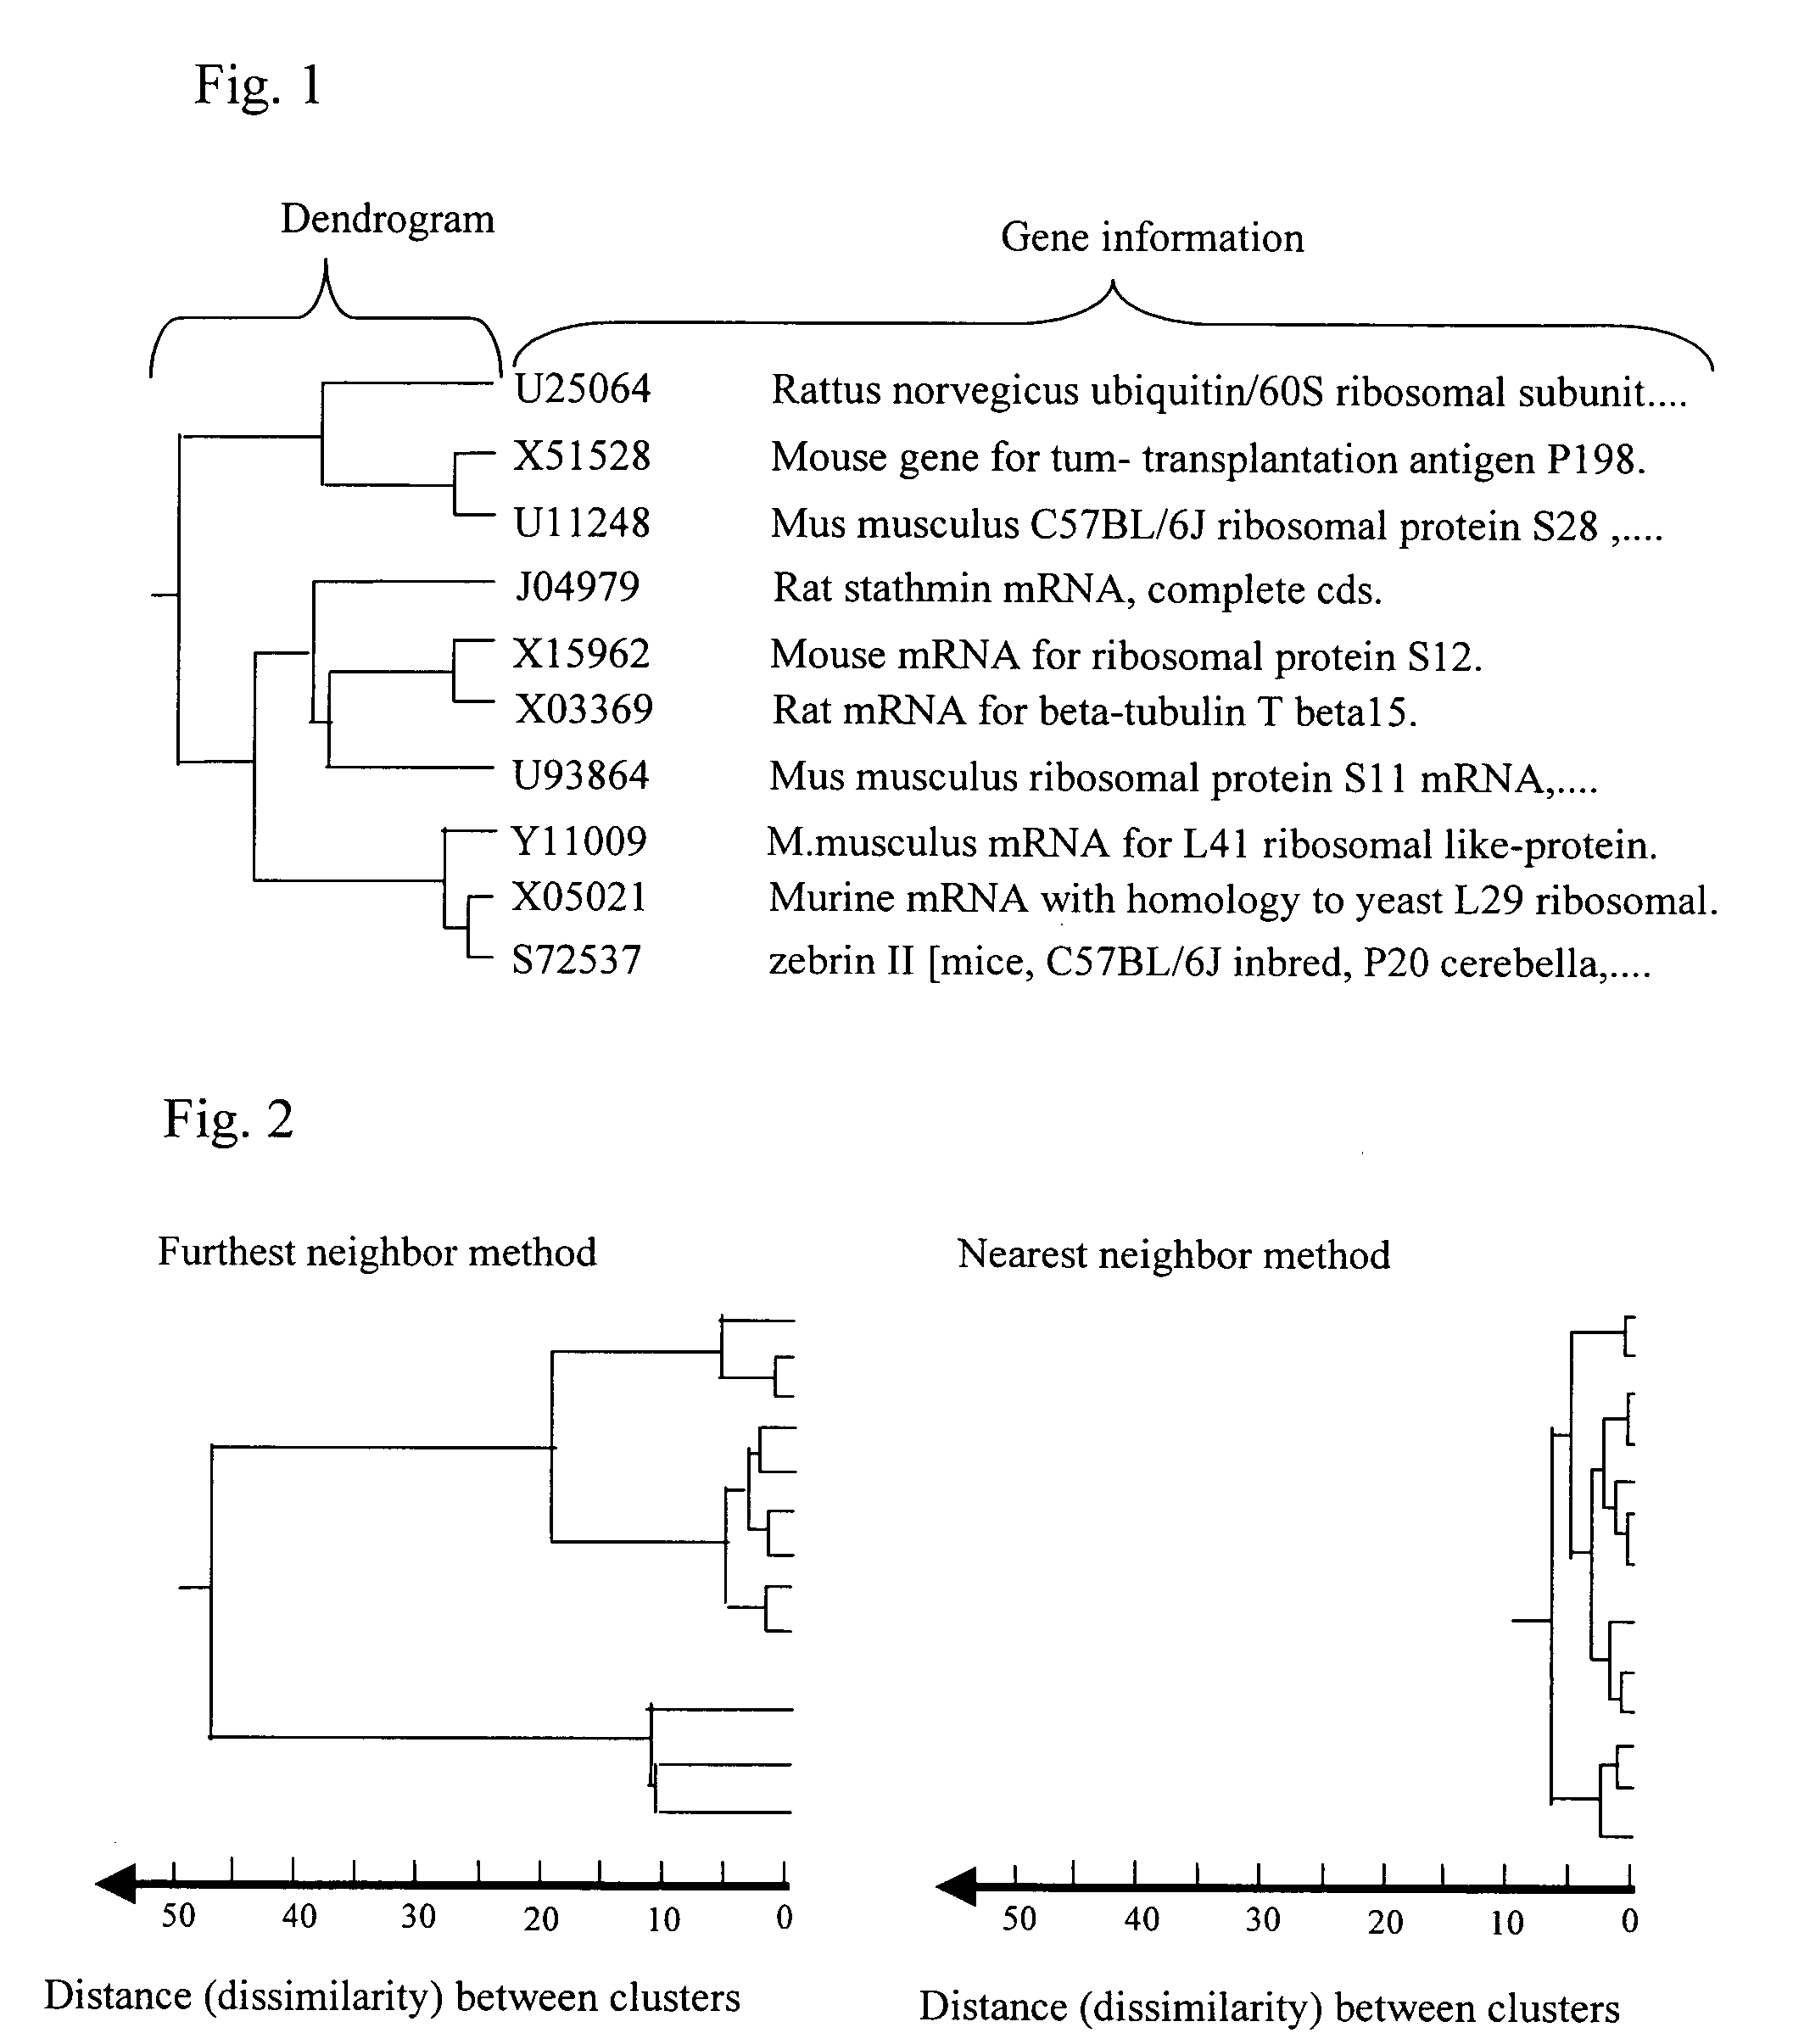
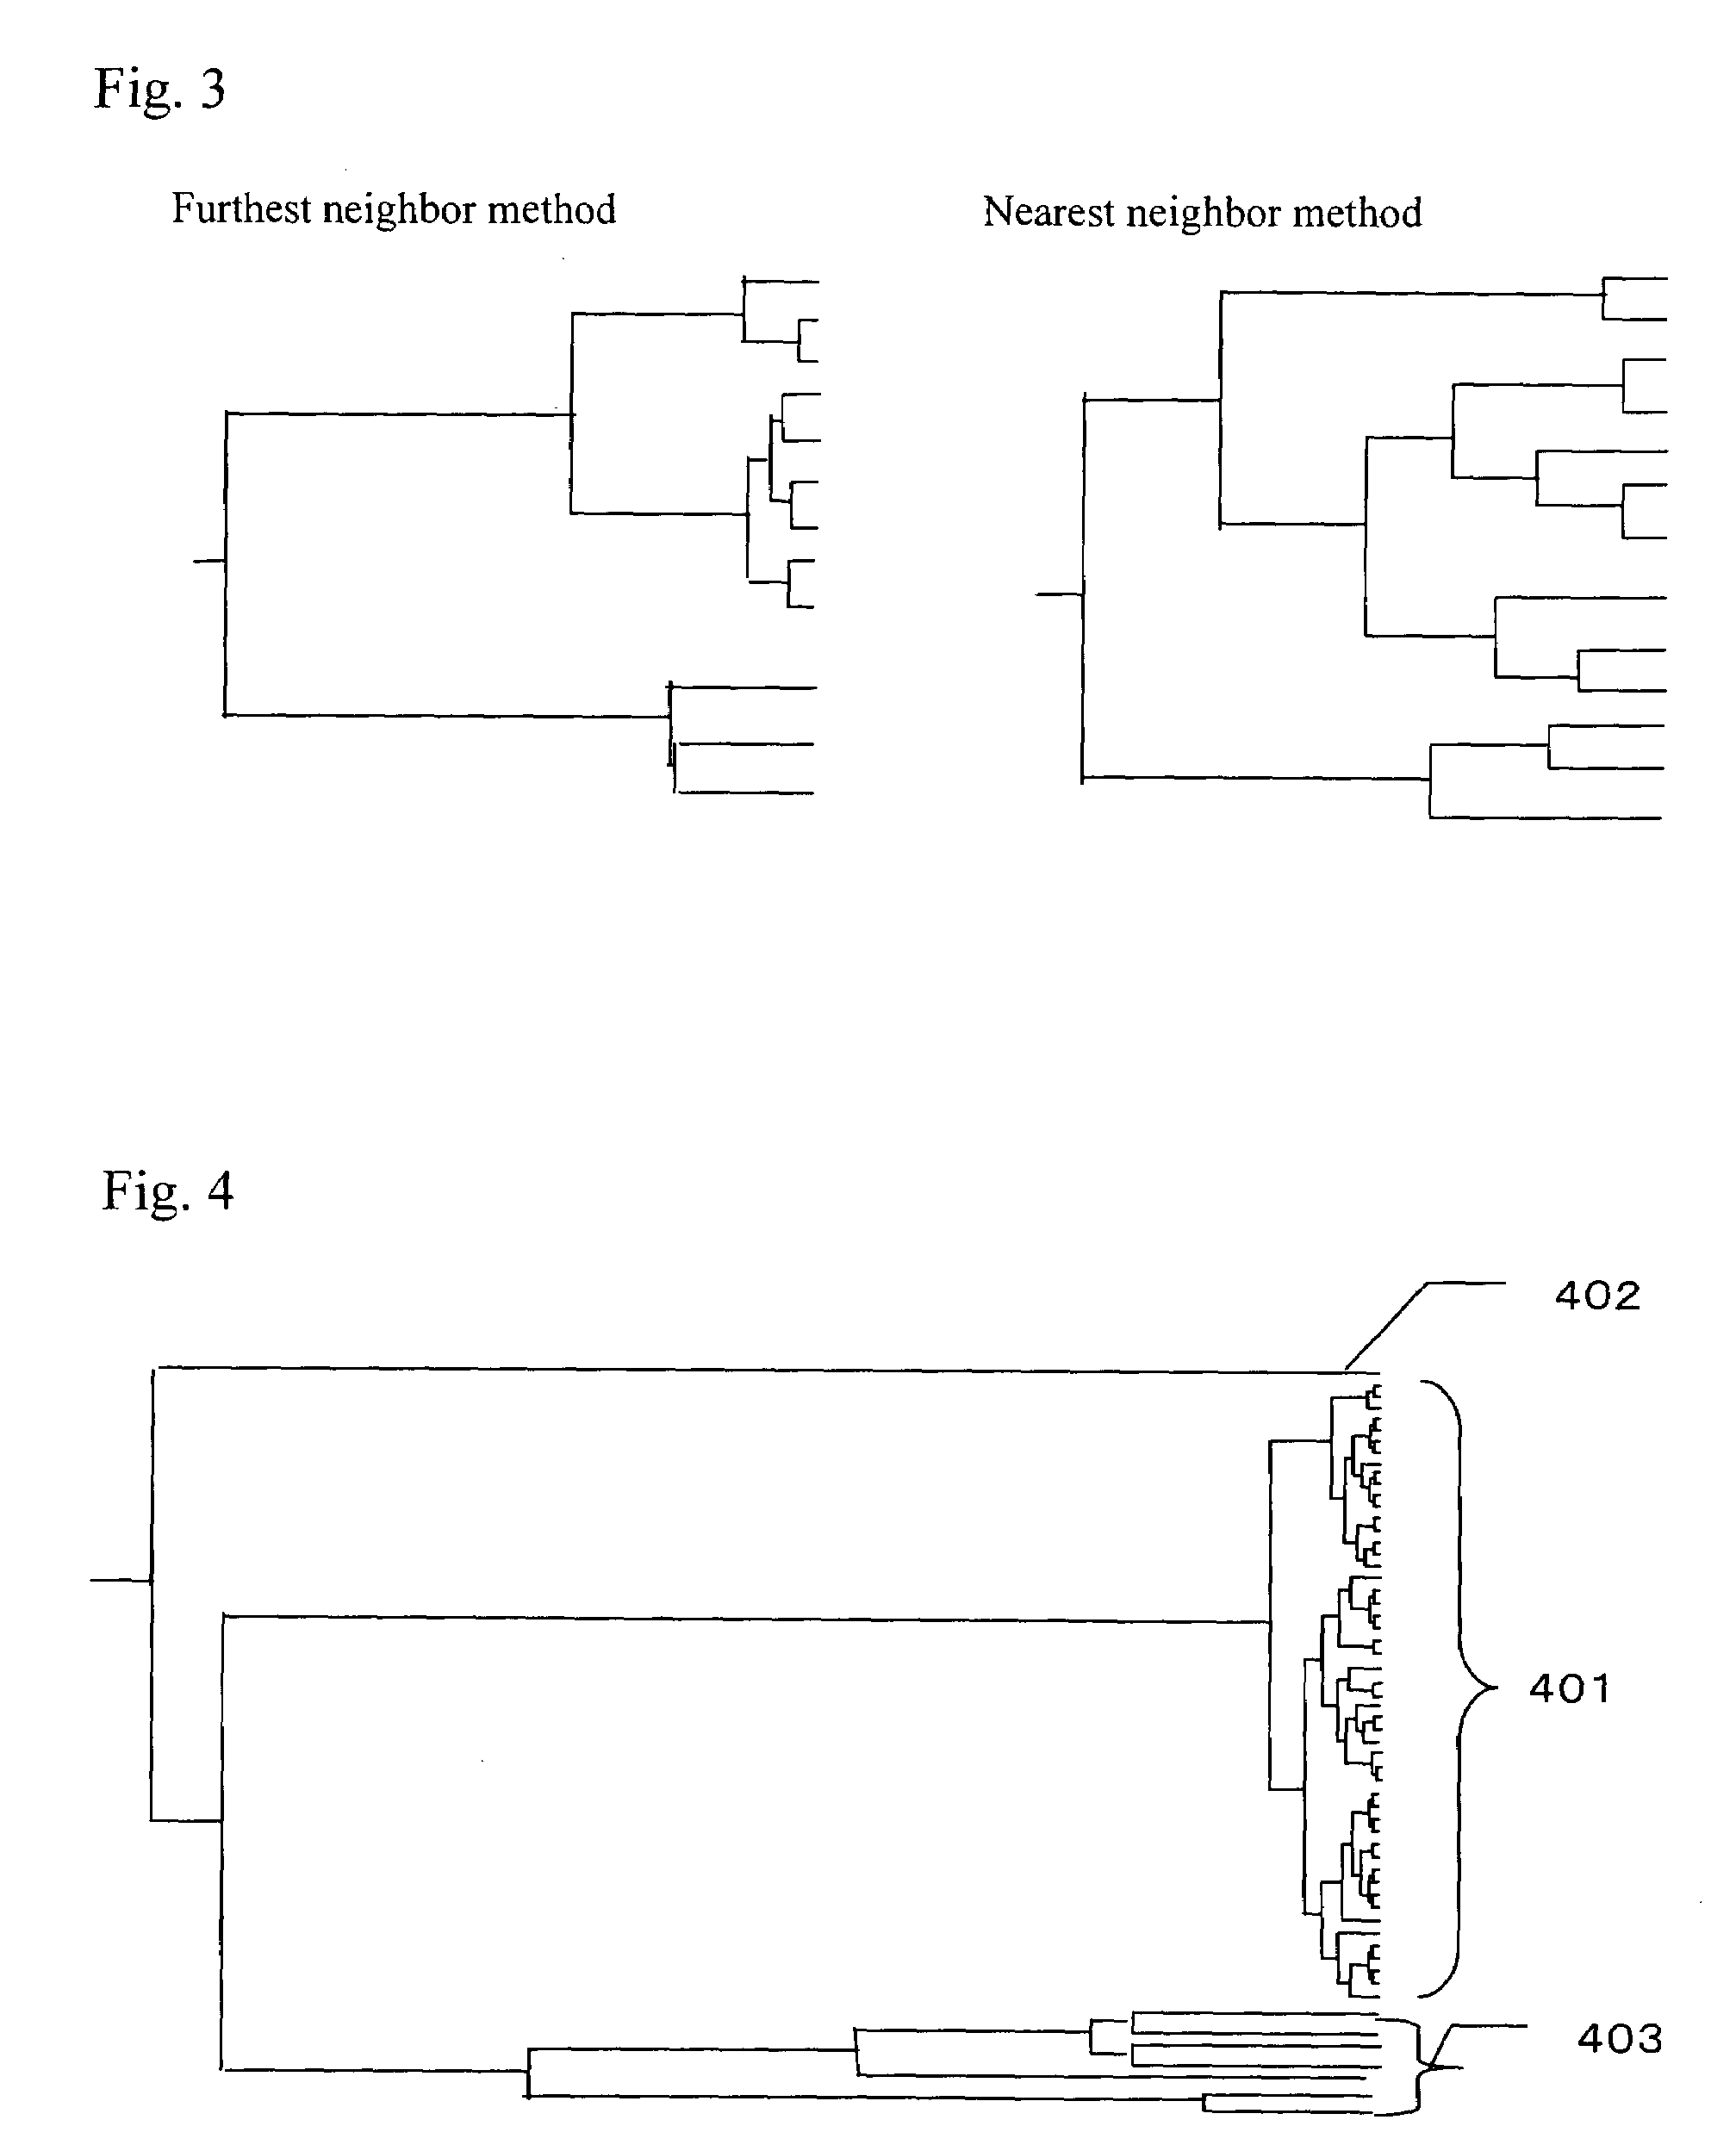
Since a dendrogram will represent several thousands to ten-thousands of genes, it is difficult from the display to judge what kind of grouping has been made.
According to a conventional clustering for a gene expression analysis, an interactive operation such as selecting a subtree and then subjecting the selected subtree to another clustering method, was impossible.
However, when the number of genes to be analyzed is numerous, it is difficult to determine which function or keyword should be focused on.

Method used


Image

  • Method and system for displaying dendrogram
  • Method and system for displaying dendrogram
  • Method and system for displaying dendrogram

Examples


Embodiment Construction

[0056]Hereinafter, the present invention will be described by way of examples with reference to the accompanying drawings. Although genes are exemplified as a subject of clustering in the following examples, the present invention is not limited thereto and is also applicable to other general biopolymers such as cDNAs, RNAs and DNA fragments.

[0057]FIG. 9 is a schematic view showing a configuration of an exemplary system for displaying a dendrogram according to the invention. The system is provided with gene data 901 for storing gene information and gene expression patterns, a clustering processor 902 for clustering based on the gene expression patterns, and analyzing and displaying the results in a dendrogram format, a display device 903 on which the dendrogram is displayed, input means such as a keyboard 904 and a mouse 905 for selecting a branch in the dendrogram or for selecting a clustering method, and a keyword dictionary file 906 for storing keywords of gene information to prov...


PUM

PropertyMeasurementUnit
brightnessaaaaaaaaaa
lengthaaaaaaaaaa
distanceaaaaaaaaaa

Abstract

The present invention represents a global state of branches in a whole dendrogram as well as detail of states of individual subtrees, to aid focusing of groupings and selection of a clustering method. The present invention selects a branch / subtree in a dendrogram displays the subtree on a separate window, replaces the subtree with an icon then restores the icon into the original subtree, and / or searches keywords contained in information of biopolymers in the subtree then highlight the locations of biopolymers containing the keywords in its information.

Description

FIELD OF THE INVENTION[0001]The present invention relates to a method and a system for displaying data (gene expression data) obtained by hybridization with a specific biopolymer such as a gene, in a visually comprehensible format so that functions and roles of the biopolymer (gene) can readily be studied.BACKGROUND OF THE INVENTION[0002]With the increase in the number of species that have been determined of their genome sequences, so called genome comparison has extensively been performed. Genome comparison aims at finding facts based on gene differences among species, for example, finding genes involved in evolution, finding a collection of genes which are considered to be common to all species, or, conversely, studying the nature unique to specific species. The recent development of infrastructures such as DNA chips and DNA microarrays has changed the interest in the art of molecular biology from information of interspecies to information of intraspecies, namely coexpression anal...

Claims


Application Information

Patent Timeline
Patent Type & Authority Patents(United States)
IPC IPC(8): G06F19/00C12N15/09G01N37/00G06F3/048G06F17/30G16B40/30G16B45/00
CPCG06F19/26G06K9/6219G06K9/6254G06F19/24G16B40/00G16B45/00G16B40/30G06F18/231G06F18/41
Inventor NOZAKI, YASUYUKIWATANABE, TSUNEHIKONAKASHIGE, RYOTAMURA, TAKURO
Owner HITACHI LTD
Learn More