
Alignment of mass spectrometry data

a mass spectrometry and data technology, applied in the field of data processing, can solve the problems of unsatisfactory variation that may get introduced in the mass spectrometry data, and achieve the effect of preventing the failure of alignmen

Inactive Publication Date: 2008-04-29
THE MATHWORKS INC
View PDF1 Cites 40 Cited by
  • Summary
  • Abstract
  • Description
  • Claims
  • Application Information

AI Technical Summary

Benefits of technology

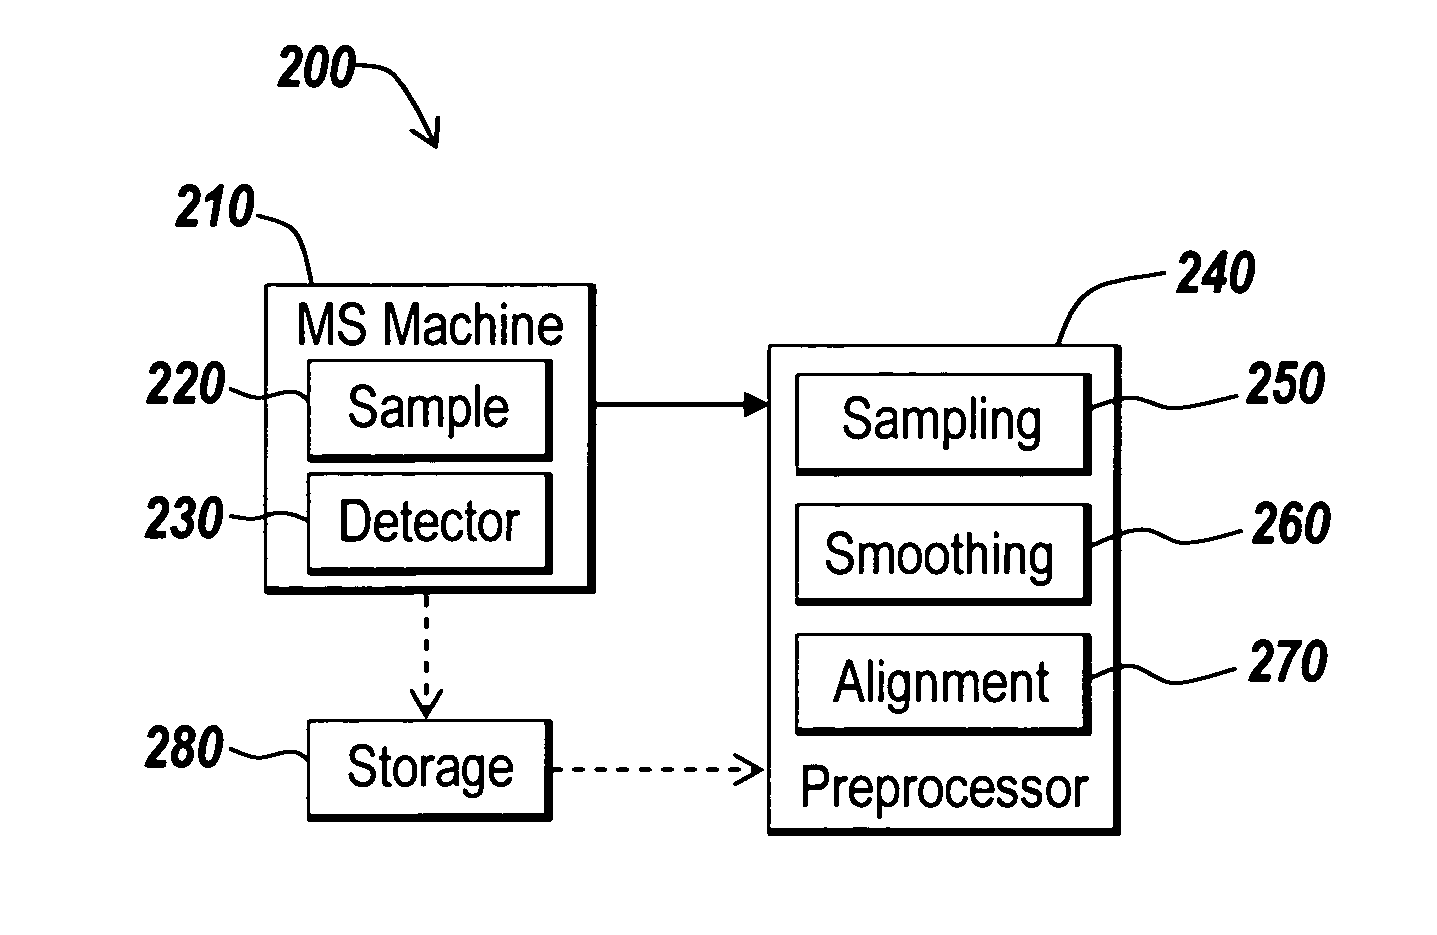
[0009]In another aspect of the present invention, a system is provided for aligning original spectrum data to a set of reference peaks. The system includes a preprocessor for building synthetic spectrum data with pulses centered at the reference peaks. The preprocessor shifts and scales the synthetic spectrum data so that cross-correlation between the original spectrum data and the synthetic spectrum data is a maximum value over shifts and scales.
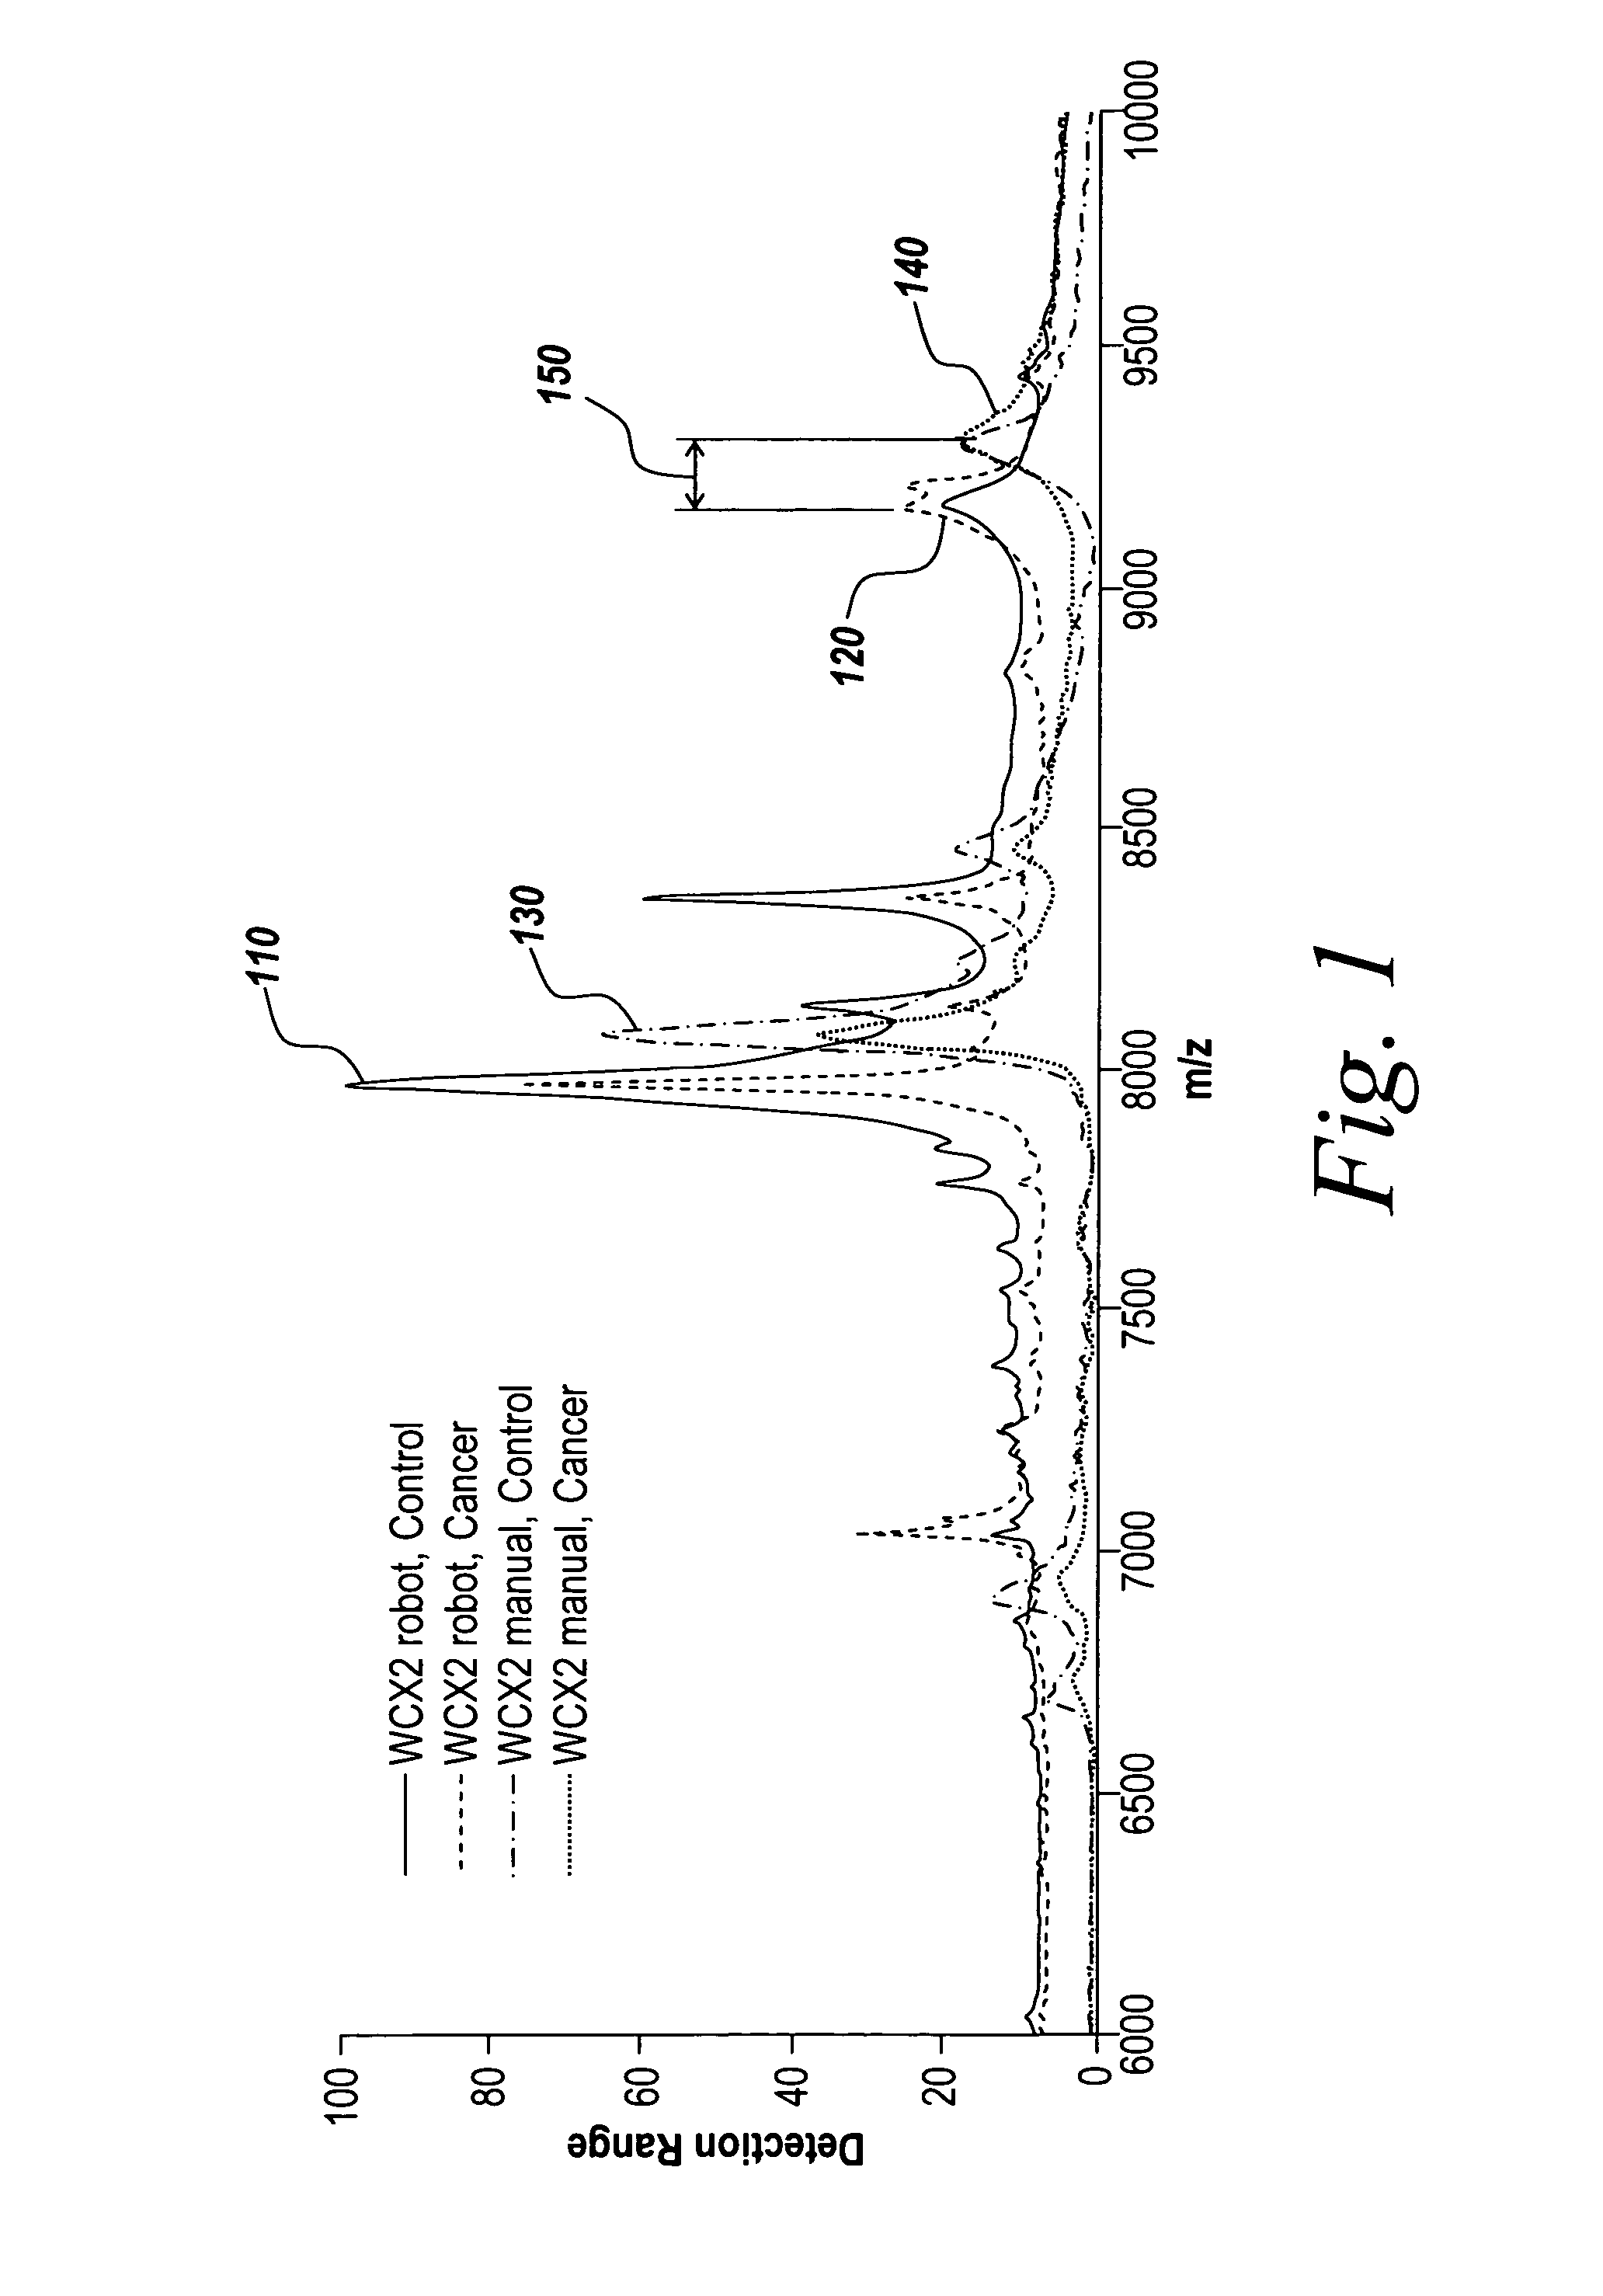
[0011]By using raw data, not just peak information, to align the peaks of the mass spectrometry data, the present invention prevents the failure of the alignment of mass spectrometry data caused by the defective peak determination.

Problems solved by technology

Although the high-throughput detector used in the mass spectrometry can generate numerous spectra per patient, undesirable variation may get introduced in the mass spectrometry data due to the non-linearity in the detector response, ionization suppression, minor changes in the mobile phase composition and interaction between analytes.

Method used


Image

  • Alignment of mass spectrometry data
  • Alignment of mass spectrometry data
  • Alignment of mass spectrometry data

Examples


Embodiment Construction

[0024]Certain embodiments of the present invention are described below. It is, however, expressly noted that the present invention is not limited to these embodiments, but rather the intention is that additions and modifications to what is expressly described herein also are included within the scope of the invention. Moreover, it is to be understood that the features of the various embodiments described herein are not mutually exclusive and can exist in various combinations and permutations, even if such combinations or permutations are not made express herein, without departing from the spirit and scope of the invention.

[0025]The illustrative embodiment of the present invention preprocesses mass spectrometry data before the analysis of the data. In the illustrative embodiment, the mass spectrometry data is preprocessed in the MATLAB® environment, which is provided from The MathWorks, Inc. of Natick, Mass. MATLAB® is an intuitive high performance language and technical computing en...


PUM


Abstract

Methods, systems and mediums are disclosed for aligning mass spectrometry data before the analysis of the mass spectrometry data. The mass spectrometry data may be received from a mass spectrometry machine, and re-sampled using a smooth warping function. To estimate the warping function, a synthetic signal is build using, for example, Gaussian pulses centered at a set of reference peaks. The reference peaks may be designated by users or calculated after observing a group of spectrograms. The synthetic signal is shifted and scaled so that the cross-correlation between the mass spectrometry data and the synthetic signal reaches its maximum value.

Description

TECHNICAL FIELD[0001]The present invention generally relates to data processing and more particularly to methods, systems and mediums for the analysis and enhancement of mass spectrometry data.BACKGROUND INFORMATION[0002]Mass spectrometry is a state-of-the-art tool for determining the masses of molecules present in a biological sample. A mass spectrum consists of a set of mass-to-charge ratios, or m / z values and corresponding relative intensities that are a function of all ionized molecules present in a sample with that mass-to-charge ratio. The m / z value defines how a particle will respond to an electric or magnetic field, which can be calculated by dividing the mass of a particle by its charge. A mass-to-charge ratio is expressed by the dimensionless quantity m / z where m is the molecular weight, or mass number, and z is the elementary charge, or charge number. Mass spectrometry provides information on the mass to charge ratio of a molecular species in a measured sample. The mass s...

Claims


Application Information

Patent Timeline
Patent Type & Authority Patents(United States)
IPC IPC(8): H01J49/00G06F19/00
CPCH01J49/0036Y10T436/24
Inventor CETTO, LUCIO
Owner THE MATHWORKS INC
Learn More