Methods of determining characteristics of doped regions on device wafers, and system for accomplishing same

a technology of doped regions and characteristics, applied in the field of method of determining characteristics of doped regions on device wafers, can solve the problems of high testing costs, adversely affecting the performance capability of the resulting integrated circuit device, and the depth and characteristics of doped regions associated with such devices also tend to decreas

Inactive Publication Date: 2009-03-17
GLOBALFOUNDRIES INC
View PDF19 Cites 12 Cited by
  • Summary
  • Abstract
  • Description
  • Claims
  • Application Information

AI Technical Summary

Problems solved by technology

In some cases, even slight variations in the characteristics of the doped regions versus the planned characteristics of such doped regions can adversely impact the performance capability of the resulting integrated circuit device.
As the critical dimensions decrease, the depth and characteristics of the doped regions associated with such devices also tends to decrease.
Such testing methodologies are expensive in that they involve at least partially processing the test wafers and, thereafter, performing the cross-sectioning and inspection activities to determine the characteristics of the doped regions.
Moreover, such test wafers typically do not include any production devices.
Additionally, in using such a testing methodology, there may be an unacceptable delay in receiving the results of such tests.
Unfortunately, in some applications, the Thermawave instrument lacks the required sensitivity to determine any meaningful information regarding the characteristics of the doped regions.
For example, when the dopant concentration is relatively high, the Thermawave instrument provides little meaningful feedback due to its limited sensitivity.
That is, due to its limited sensitivity, if such a device detects the presence of any dopant material, it is assumed that the correct amount of dopant material is present in the inspected region.
However, the size of the light beam used in such metrology tools to illuminate the desired inspection target may be relatively large, e.g., approximately 1-2 mm.
Unfortunately, with modern integrated circuit devices, the doped regions in need of inspection are much smaller than the size of the light beam used in traditional surface photovoltage metrology techniques.
However, using such techniques involves waiting until an anneal process has been performed to activate the implanted dopant atoms.
Due to a variety of reasons, there are limitations on when such an anneal process may be performed.
Thus, results from such electrical tests are not as timely as would otherwise be desired.
Additionally, the physical size of the probes is relatively large and, therefore, such a testing methodology may be of limited use in connection with the testing of modern semiconductor devices which have very small doped regions.
Moreover, such contact testing techniques may result in damage to the tested device.
As stated above, dimensions of integrated circuit devices continue to shrink and, as a result, the depths of the doped regions become shallower and the profiles of the doped regions become steeper.
Unfortunately, the energy levels of light sources employed in existing surface photovoltage metrology tools is too high and the excited region goes beyond the interface 102 between the active layer 100C and the buried insulation layer 100B.
This may occur because the high energy light may generate electrons in the active zone below the transistor 10 and it is not possible to discharge this area due to the buried insulation layer 100B.

Method used


Image

  • Methods of determining characteristics of doped regions on device wafers, and system for accomplishing same
  • Methods of determining characteristics of doped regions on device wafers, and system for accomplishing same
  • Methods of determining characteristics of doped regions on device wafers, and system for accomplishing same

Examples


Embodiment Construction

[0035]Illustrative embodiments of the invention are described below. In the interest of clarity, not all features of an actual implementation are described in this specification. It will of course be appreciated that in the development of any such actual embodiment, numerous implementation-specific decisions must be made to achieve the developers' specific goals, such as compliance with system-related and business-related constraints, which will vary from one implementation to another. Moreover, it will be appreciated that such a development effort might be complex and time-consuming, but would nevertheless be a routine undertaking for those of ordinary skill in the art having the benefit of this disclosure.

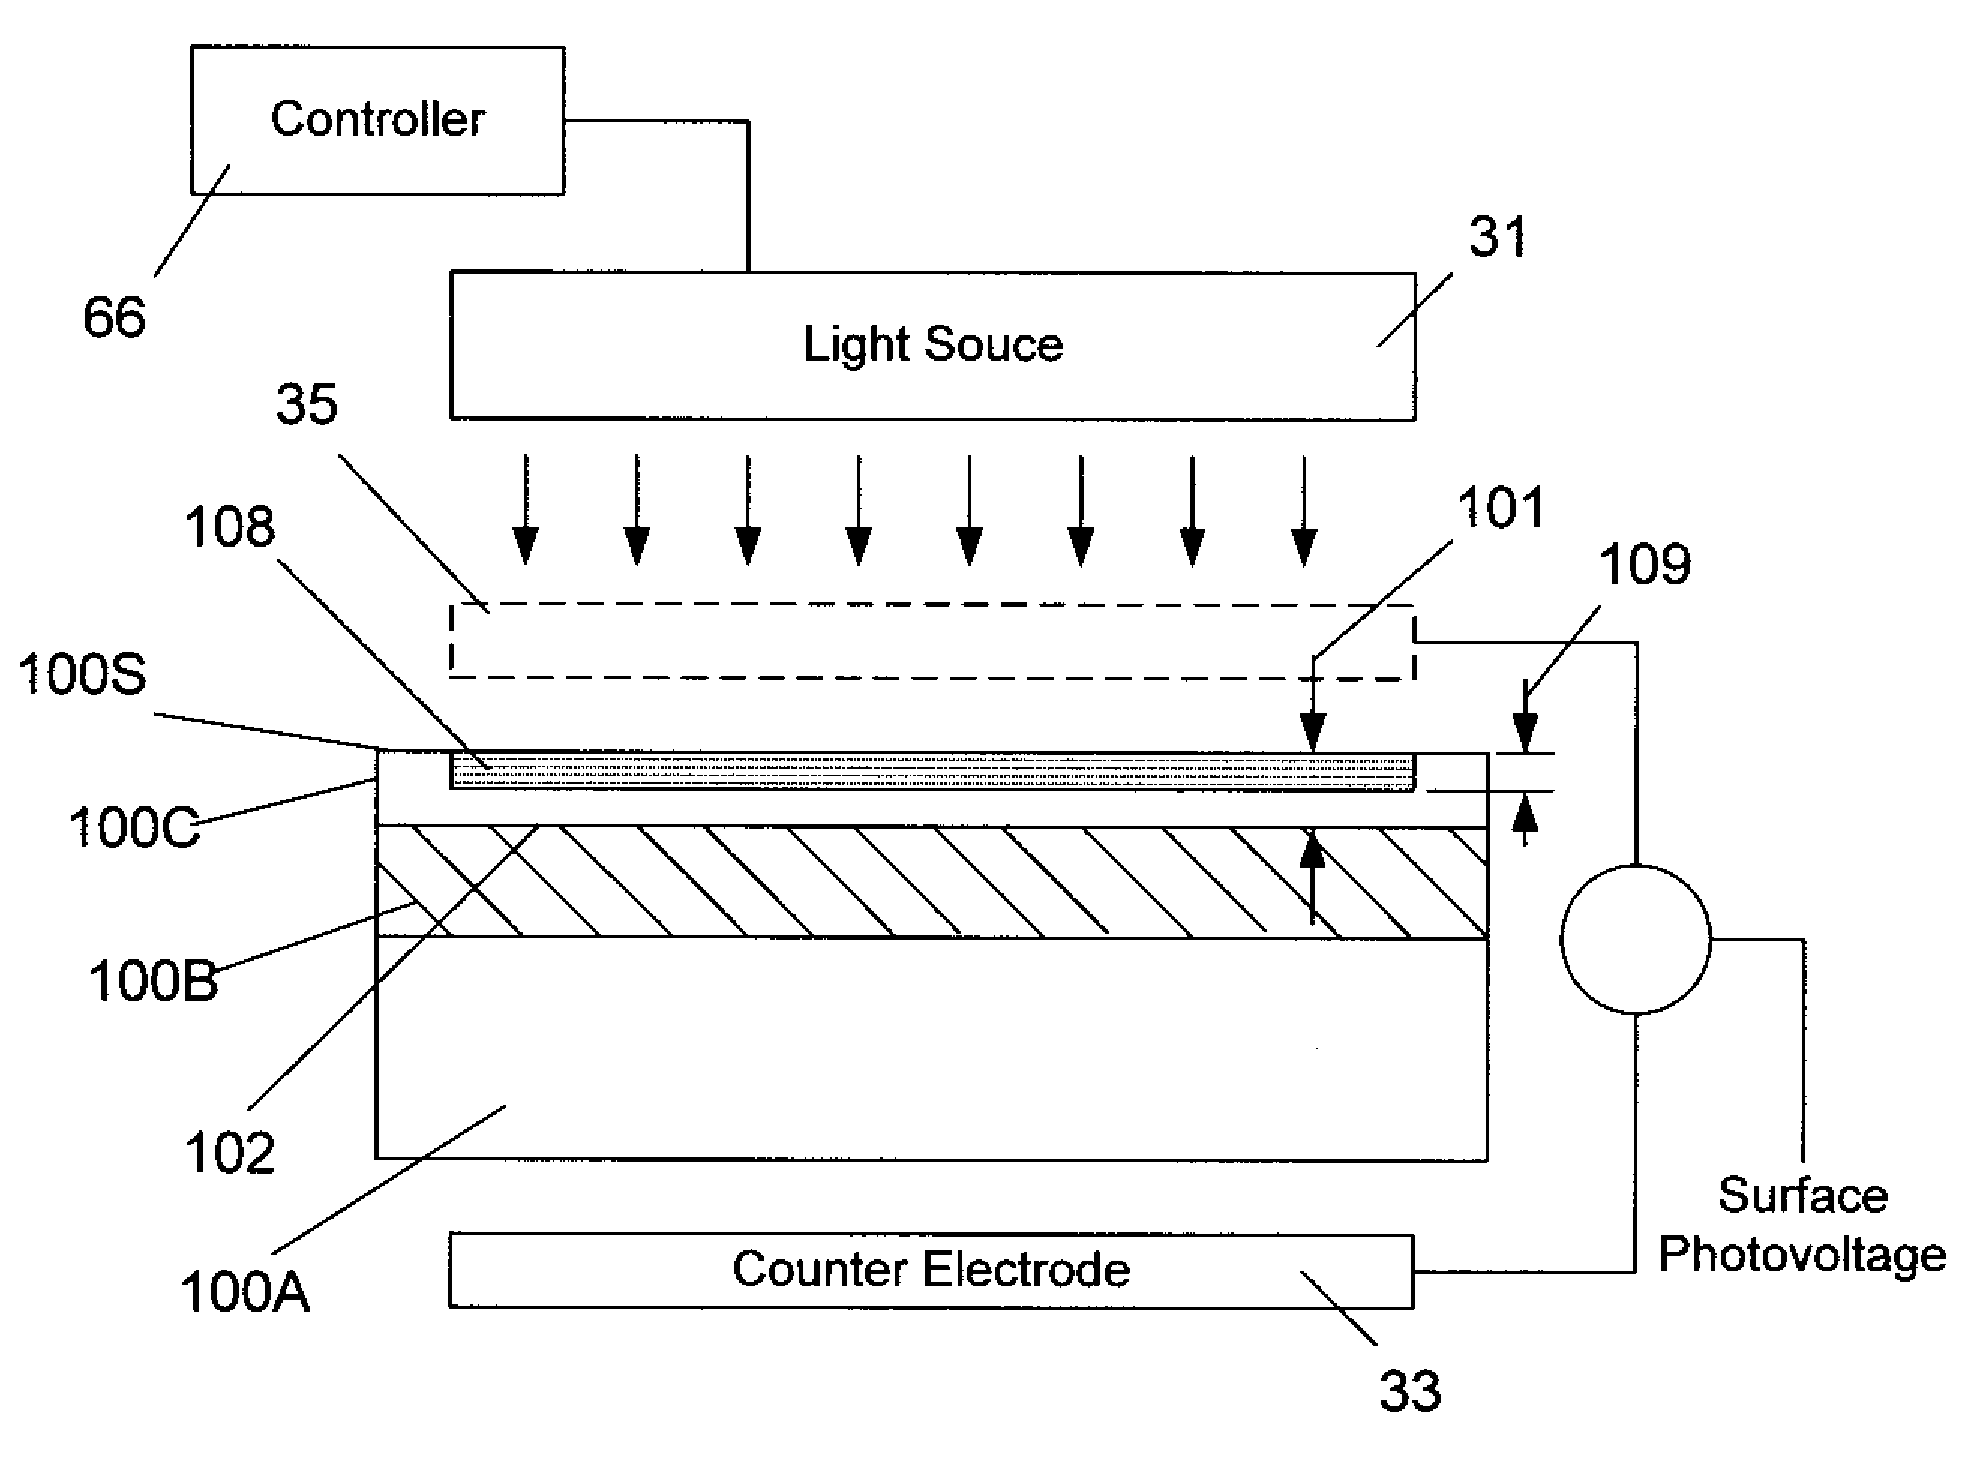
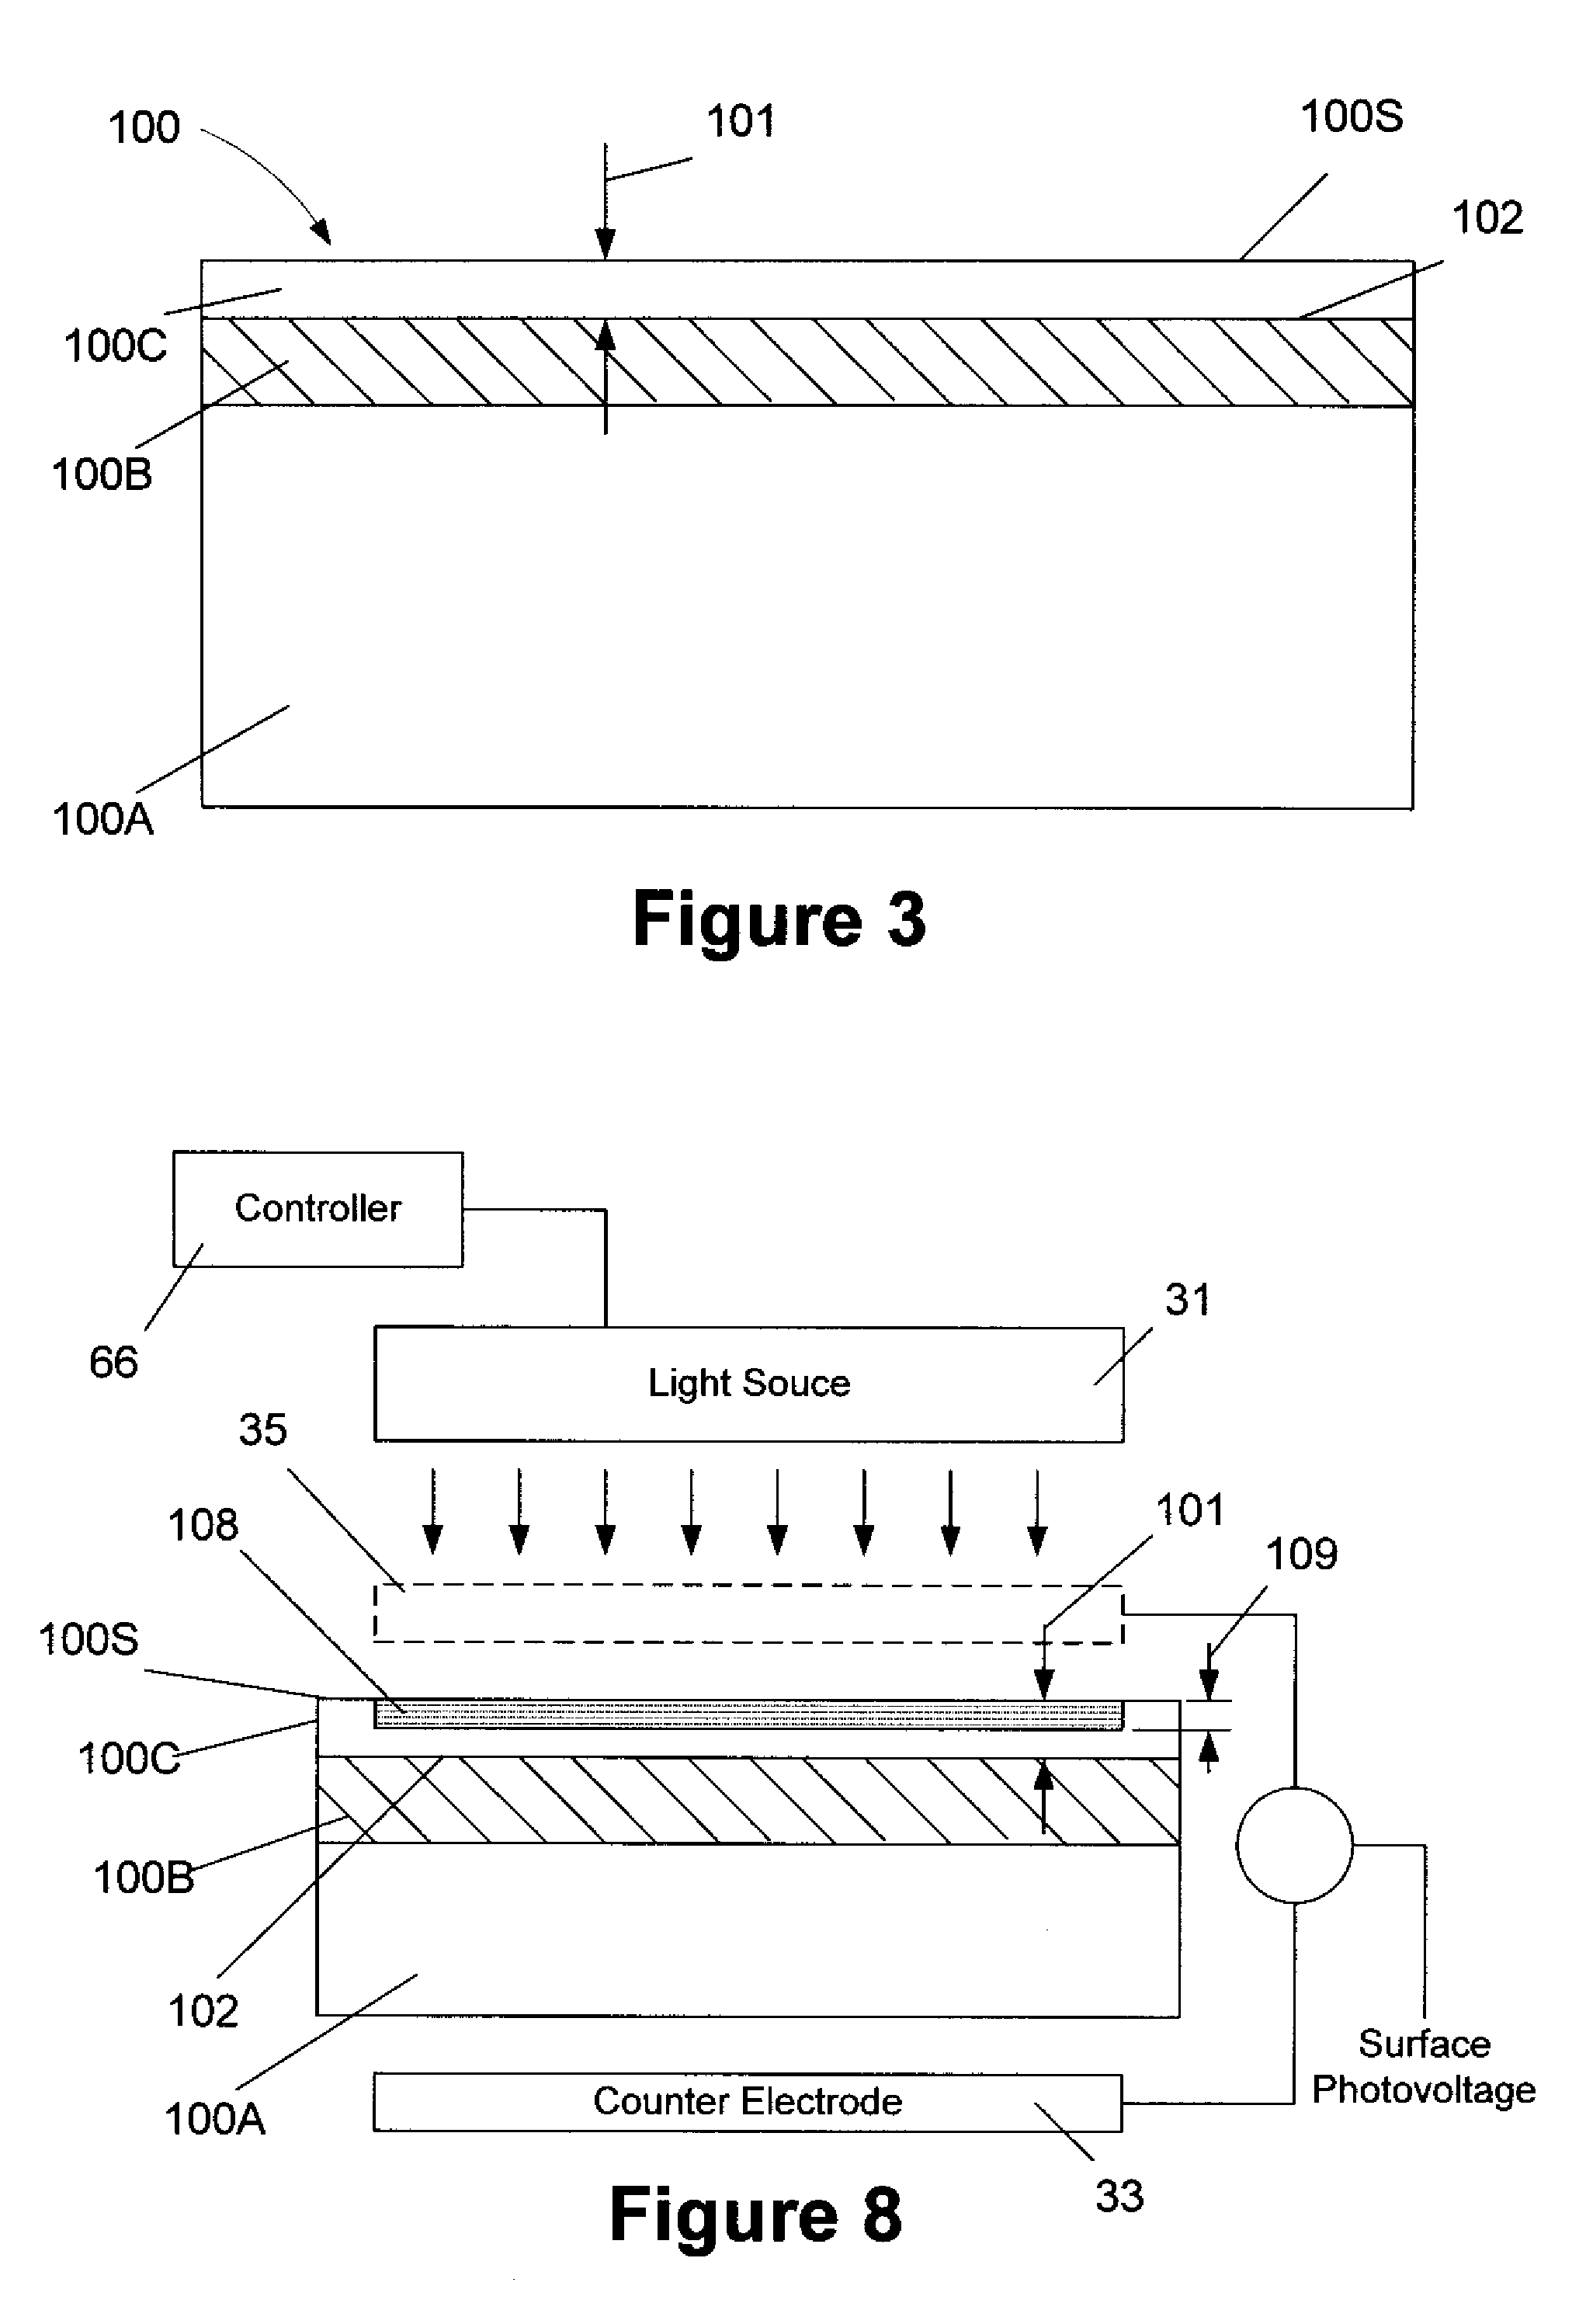
[0036]The present invention will now be described with reference to the attached figures. Various structures, systems, doped regions, devices and tools may be schematically depicted in the drawings for purposes of explanation only and so as to not obscure the present invention wi...


PUM


Abstract

Disclosed herein are various methods of determining characteristics of doped regions on device wafers, and a system for accomplishing same. In one illustrative embodiment, the method includes providing a device substrate comprising a plurality of masked areas, a plurality of unmasked areas, and at least one doped region formed in the substrate, determining a ratio between the unmasked areas and the masked areas for the device substrate, illuminating an area of the device substrate comprising the masked areas, the unmasked areas, and at least one doped region, and measuring an induced surface photovoltage of the device substrate while accounting for the ratio of the unmasked areas and the masked areas of the device substrate. In another illustrative embodiment, the method includes providing an SOI substrate comprised of an active layer, the active layer having a thickness, illuminating an area of the substrate using a light source having a wavelength that is sufficiently long such that an excited region created in the active layer due to the illumination does not extend beyond the thickness of the active layer, and measuring an induced surface photovoltage resulting from the illumination.

Description

CROSS-REFERENCE TO RELATED APPLICATION[0001]This application is a DIV of Ser. No. 10 / 900,832 filed on Jul. 28, 2004 now U.S. Pat. No. 7,063,991.BACKGROUND OF THE INVENTION[0002]1. Field of the Invention[0003]This invention relates generally to semiconductor metrology technology, and, more particularly, to various methods of determining characteristics of doped regions on device wafers, and a system for accomplishing same.[0004]2. Description of the Related Art[0005]There is a constant drive within the semiconductor industry to increase the operating speed of integrated circuit devices, e.g., microprocessors, memory devices, and the like. This drive is fueled by consumer demands for computers and electronic devices that operate at increasingly greater speeds. This demand for increased speed has resulted in a continual reduction in the size of semiconductor devices, e.g., transistors. That is, many components of a typical field effect transistor (FET), e.g., channel length, junction d...

Claims


Application Information

Patent Timeline
Patent Type & Authority Patents(United States)
IPC IPC(8): G01R31/02
CPCG01R31/2831H01L21/26513
Inventor ZHAO, ZHIYONGKRUEGER, CHRISTIAN
Owner GLOBALFOUNDRIES INC
Why Eureka
Try Eureka