Multidimensional visualization method

a multi-dimensional and visualization technology, applied in the field of information management, can solve the problems of difficult to compare trends and clusters, difficult to understand information distribution in higher dimensional spaces, and difficulty in presenting and making sense of such multi-dimensional information, so as to facilitate understanding of information or data, effectively distinguish

Active Publication Date: 2010-02-09
IBM CORP
View PDF12 Cites 10 Cited by
  • Summary
  • Abstract
  • Description
  • Claims
  • Application Information

AI Technical Summary

Benefits of technology

[0007]Preferred implementations of the invention permit a user to represent multi-dimensional information objects or data in two dimensions, thereby facilitating understanding of the information or data. This reduction in the number of dimensions is accomplished by constructing (preferably linear) unit vectors corresponding to the dimensions, in which the unit vectors (at least some of which are not orthogonal to each other) share a common plane. Information objects or multi-dimensional data are plotted and represented as small features such as points (or small circles, triangles, squares, etc.) on a display, such as a screen of a

Problems solved by technology

Representing and making sense of such multi-dimensional information is challenging, at least in part because of three-dimensional space in which we live.
However, if the representations are too complex and involve too many visual cues such as color, size, direction, and posit

Method used


Image

  • Multidimensional visualization method
  • Multidimensional visualization method
  • Multidimensional visualization method

Examples


Embodiment Construction

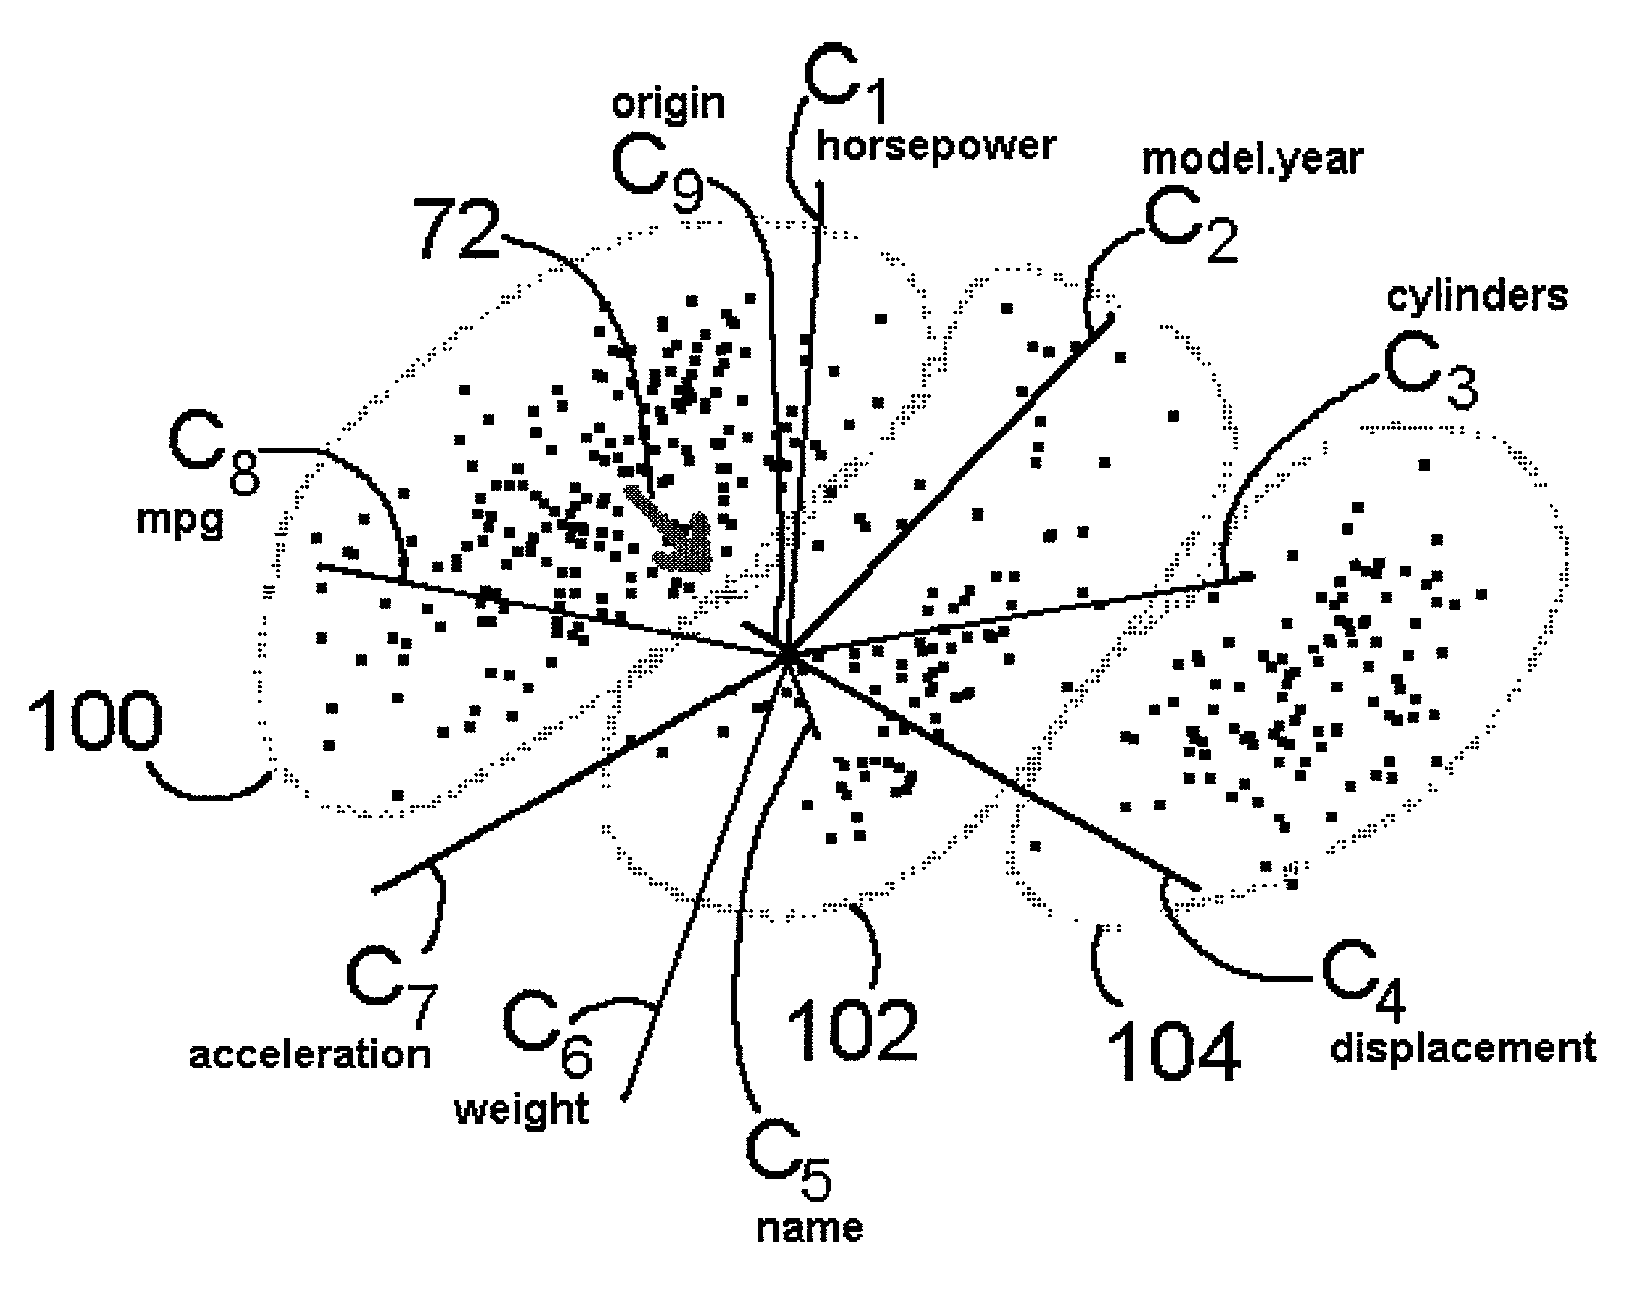
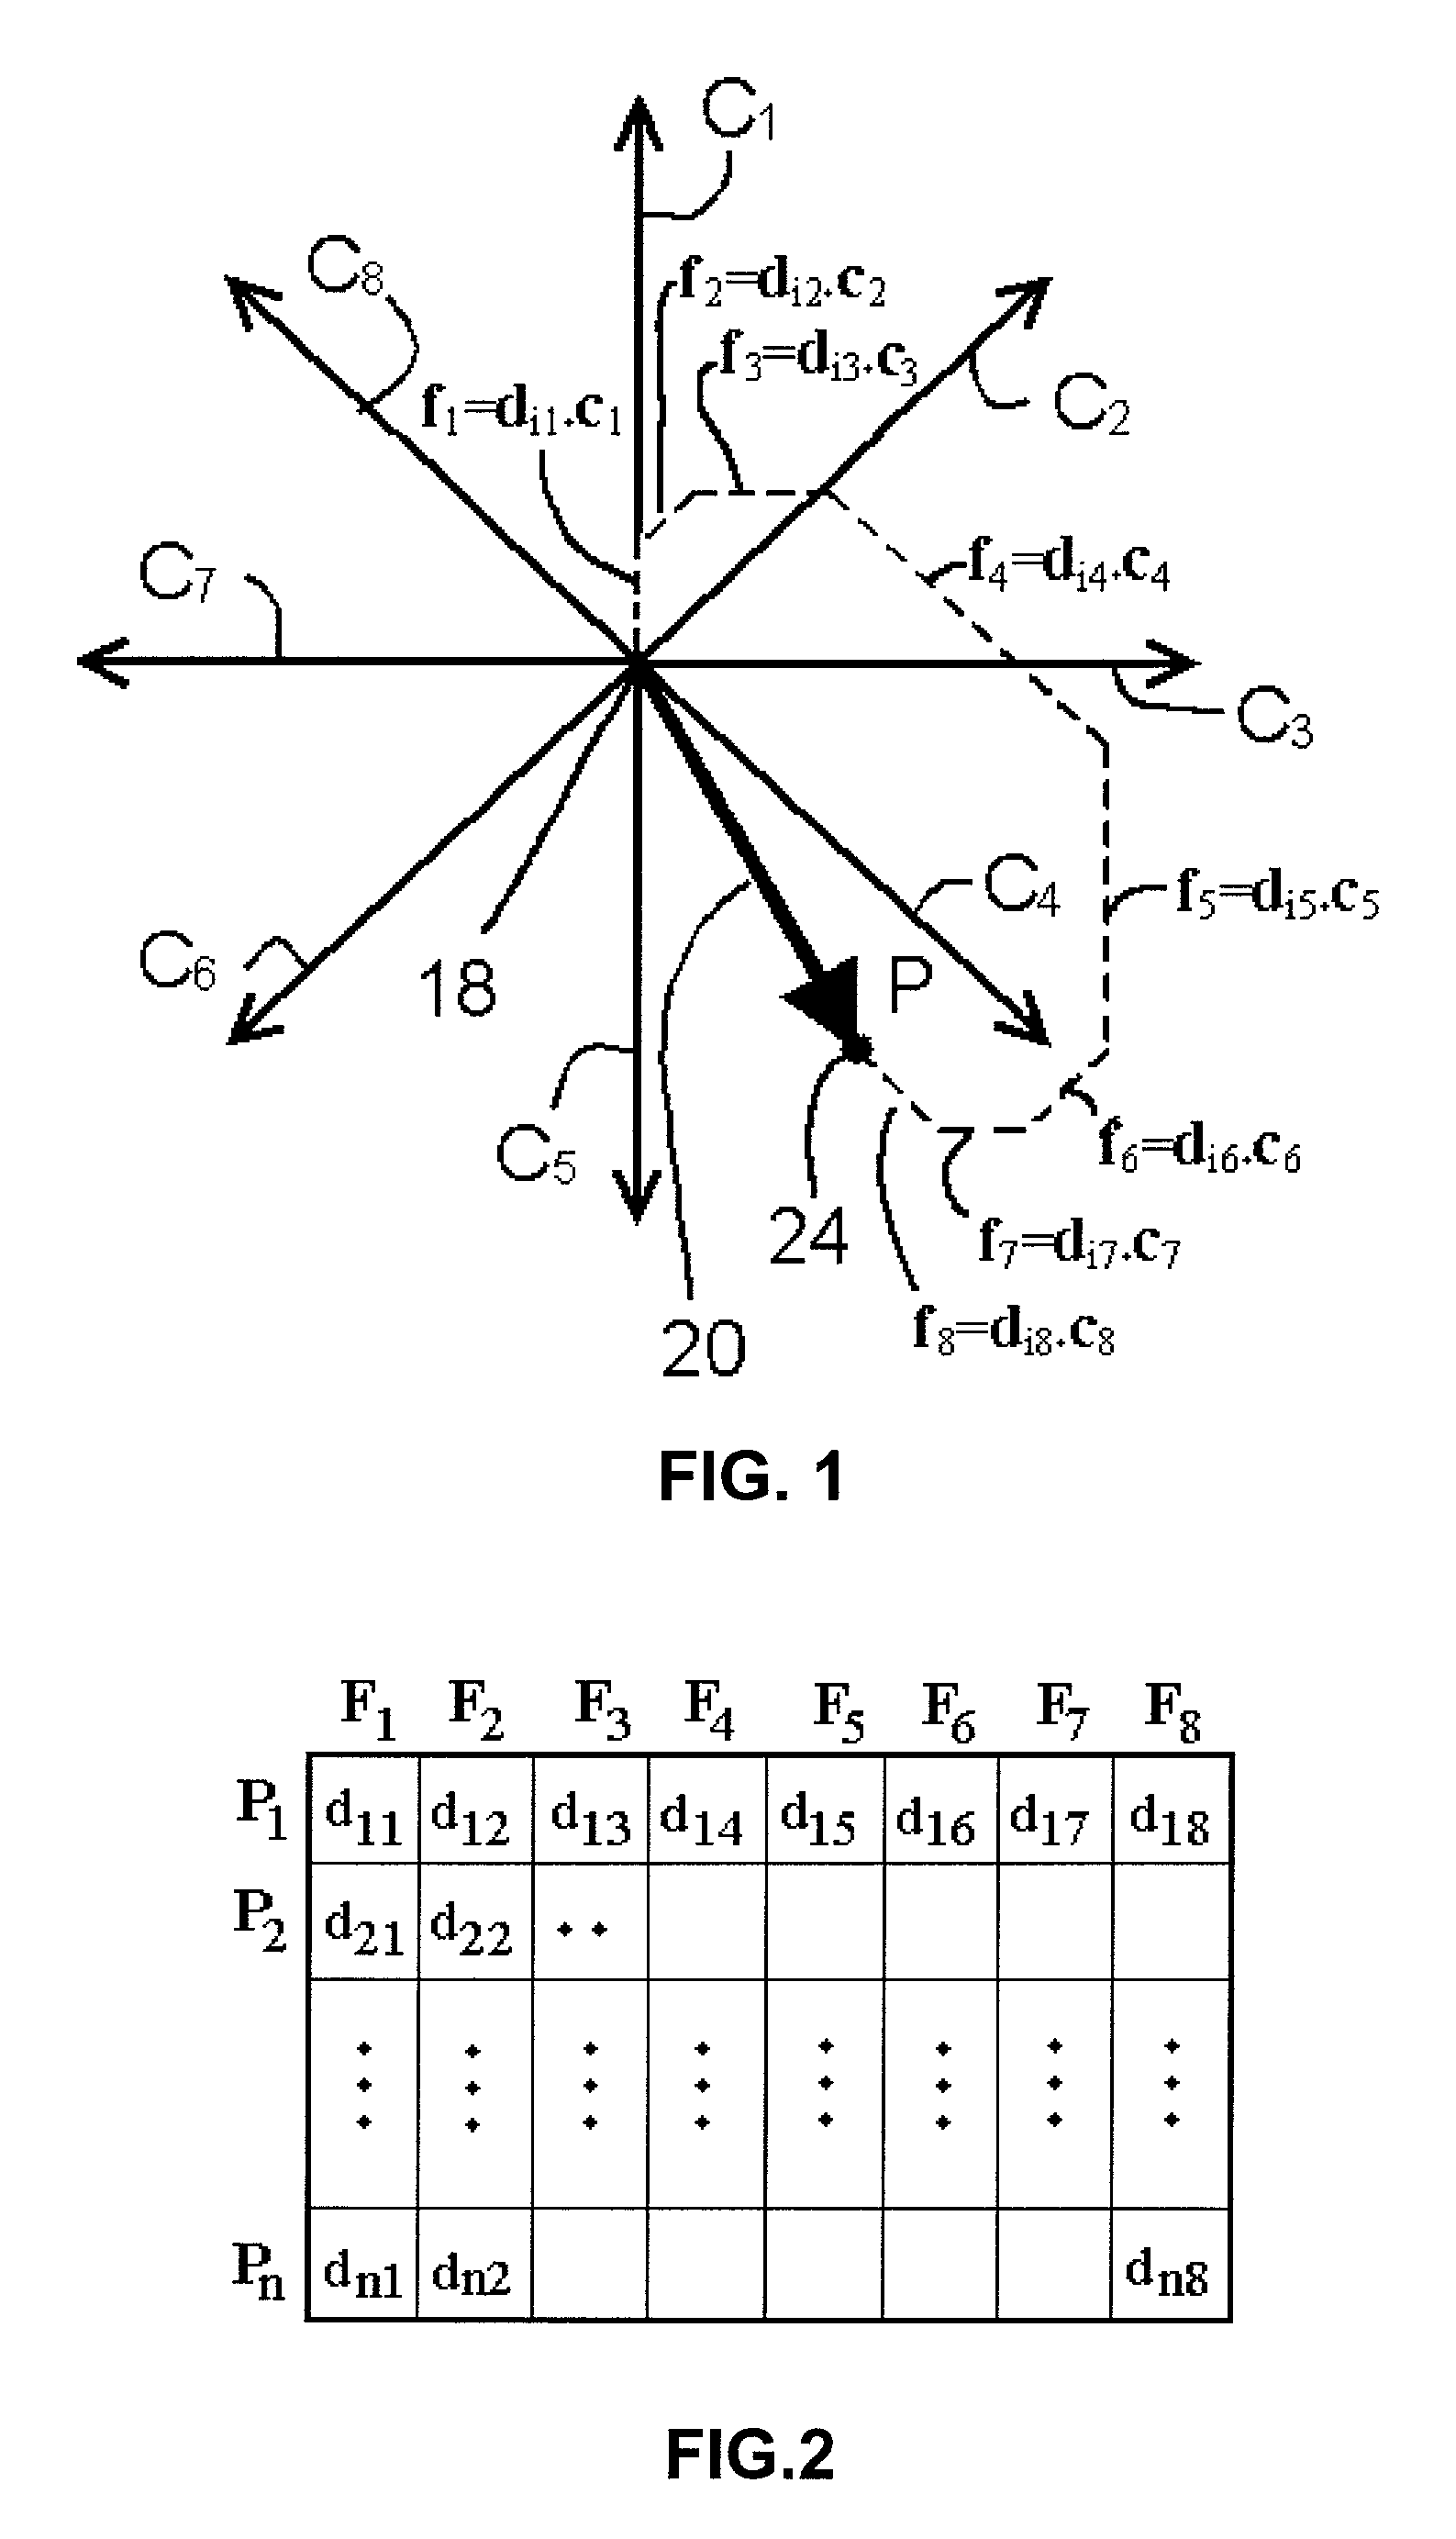
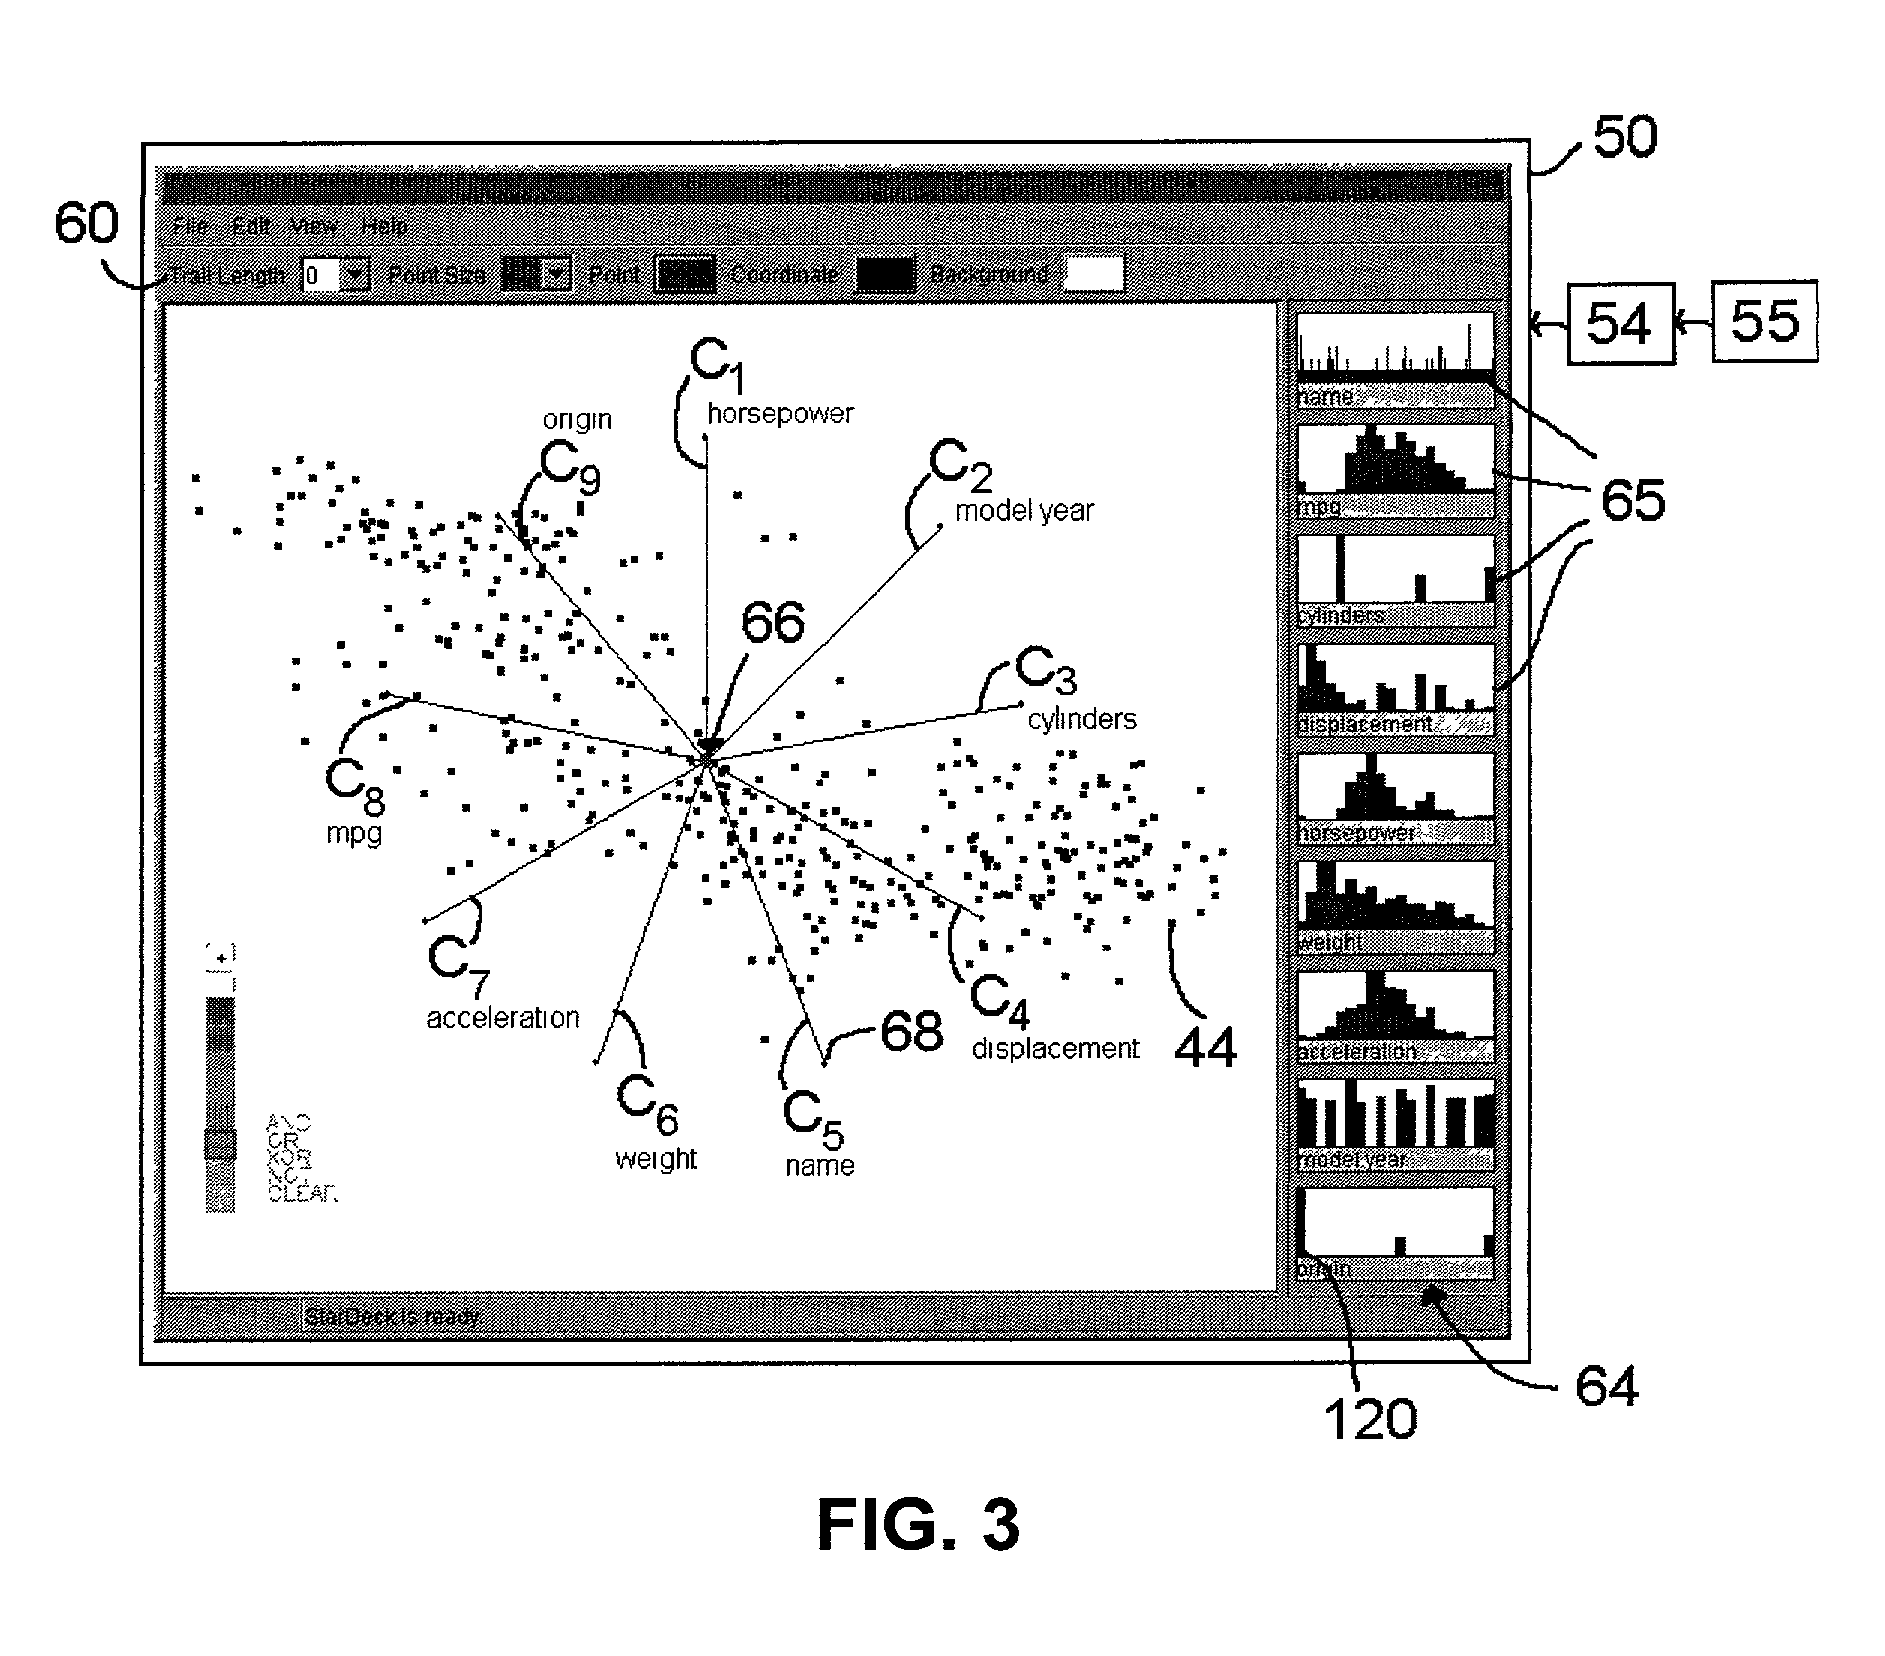
[0022]Preferred implementations of the invention provide the user with the ability to rapidly gain insight into multi-dimensional information sets (e.g., data sets) by reducing the information to a two-dimensional representation. To this end, multi-dimensional information is represented in two-dimensional space through the use of a coordinate system dubbed herein as “Star Coordinates.” One preferred Star Coordinate system is illustrated in FIG. 1. In this example, eight coordinate axes represented by arrows or rays C1, C2, C3, C4, C5, C6, C7, C8 are shown in a two-dimensional space (a common plane). Each of the axes corresponds to a different variable or “dimension” of a multi-dimensional information object or data entry. Thus, the information to be reduced to the Star Coordinate system of FIG. 1 has 8 variables. The rays C1, . . . C8 are shown in this example as defining equal angles between the rays, which is a preferred but not a required implementation (as discussed below).

[0023...


PUM


Abstract

Multi-dimensional objects or data may be represented in two dimensions, thereby facilitating understanding of the information or data. This reduction in the number of dimensions is accomplished by constructing unit vectors corresponding to the dimensions, in which the unit vectors share a common plane. Information objects or multi-dimensional data are plotted and represented as small features such as points on a display tied to a processor or computer. A user may gain insight into how the information is structured by performing certain transformations on it, such as scaling one (or more) unit vectors or rotating one or more unit vectors, followed by replotting the points.

Description

TECHNICAL FIELD[0001]The invention is in the field of information management. More particularly, the invention relates to the ability to understand and gain insight from multi-dimensional data.BACKGROUND[0002]Scientific, engineering, and business data (or more generally, information) are often multi-dimensional, i.e., they depend on several variables. Information presented in matrix form, in which typically the rows correspond to the “data points” and the columns correspond to the variables, may contain more than three columns of information. Representing and making sense of such multi-dimensional information is challenging, at least in part because of three-dimensional space in which we live. For example, reducing a four dimensional data space to a two or even three dimensional representation necessarily involves introducing some ambiguities in how the data is presented: In a two-dimensional projection of a three-dimensional scatter plot, a point may correspond to any value paralle...

Claims


Application Information

Patent Timeline
IPC IPC(8): G06T11/20G06F7/00G09G5/22G06V10/762
CPCG06T11/206G06K9/6218G06K9/6253G06V10/762G06V10/945G06F18/23G06F18/40
Inventor KANDOGAN, ESER
Owner IBM CORP
Why Eureka
Try Eureka