System, method, and computer program product providing three-dimensional visualization of ground penetrating radar data

a technology of ground-penetration radar and computer program, applied in the field of radar information analysis and display techniques, can solve the problems of large training investment of prior art systems, difficult to produce 3d display in real-time, and inability to intuitively understand the system, so as to free up some amount of processing power of the computer system, the effect of limiting the amount of data being processed

Inactive Publication Date: 2010-03-09
NIITEK
View PDF102 Cites 4 Cited by
  • Summary
  • Abstract
  • Description
  • Claims
  • Application Information

AI Technical Summary

Benefits of technology

[0006]The present invention is directed to systems, methods, and computer program products which analyze data and display data using techniques more advanced than those found in the prior art. For example, according to one embodiment, a method to analyze and display radar data employs a mathematical connection algorithm to further eliminate depth bins and also to derive more useful information from the remaining depth bins. Such further elimination of depth bins may help to limit the amount of data being processed, thereby freeing up some amount of processing power of a computer system.
[0007]Additionally or alternatively, other embodiments employ a display wherein a down-track B-scan and a cross-track B-scan are arranged orthogonally to each other to create two sides of a rectangular prism. Within the rectangular prism is a 3D plot of anomaly data. Some embodiments include a more intuitive down-track B-scan that selects channels of interest over time to create a 2D view of what is generally expected to be the most relevant data from a survey volume. The creation of the down-track B-scan can be enhanced by using an algorithm that smoothes the movement from one scan to the next, thereby helping to focus the B-scan on items of interest while minimizing abrupt shifts due to high frequency noise. Such displays tend to be more intuitive to human users than the displays of the prior art, at the very least, due to the rendering of more relevant data in a 3D plot, often in real-time.

Problems solved by technology

A disadvantage of prior art solutions is that they are not intuitive.
Thus, prior art systems tend to require a large training investment, as well as much human interpretation during operation.
An additional disadvantage of prior art systems is that they tend to process an enormous amount of data, making it difficult to produce a 3D display in real-time.
However, this still leaves enough data to strain the processing power of most military computing systems.
As a result, systems that provide real-time radar data rarely are able to generate a 3D display.
In fact, 3D GPR displays are currently limited to systems that are not real-time systems, such as archaeological systems that take hours to give final results.

Method used


Image

  • System, method, and computer program product providing three-dimensional visualization of ground penetrating radar data
  • System, method, and computer program product providing three-dimensional visualization of ground penetrating radar data
  • System, method, and computer program product providing three-dimensional visualization of ground penetrating radar data

Examples


Embodiment Construction

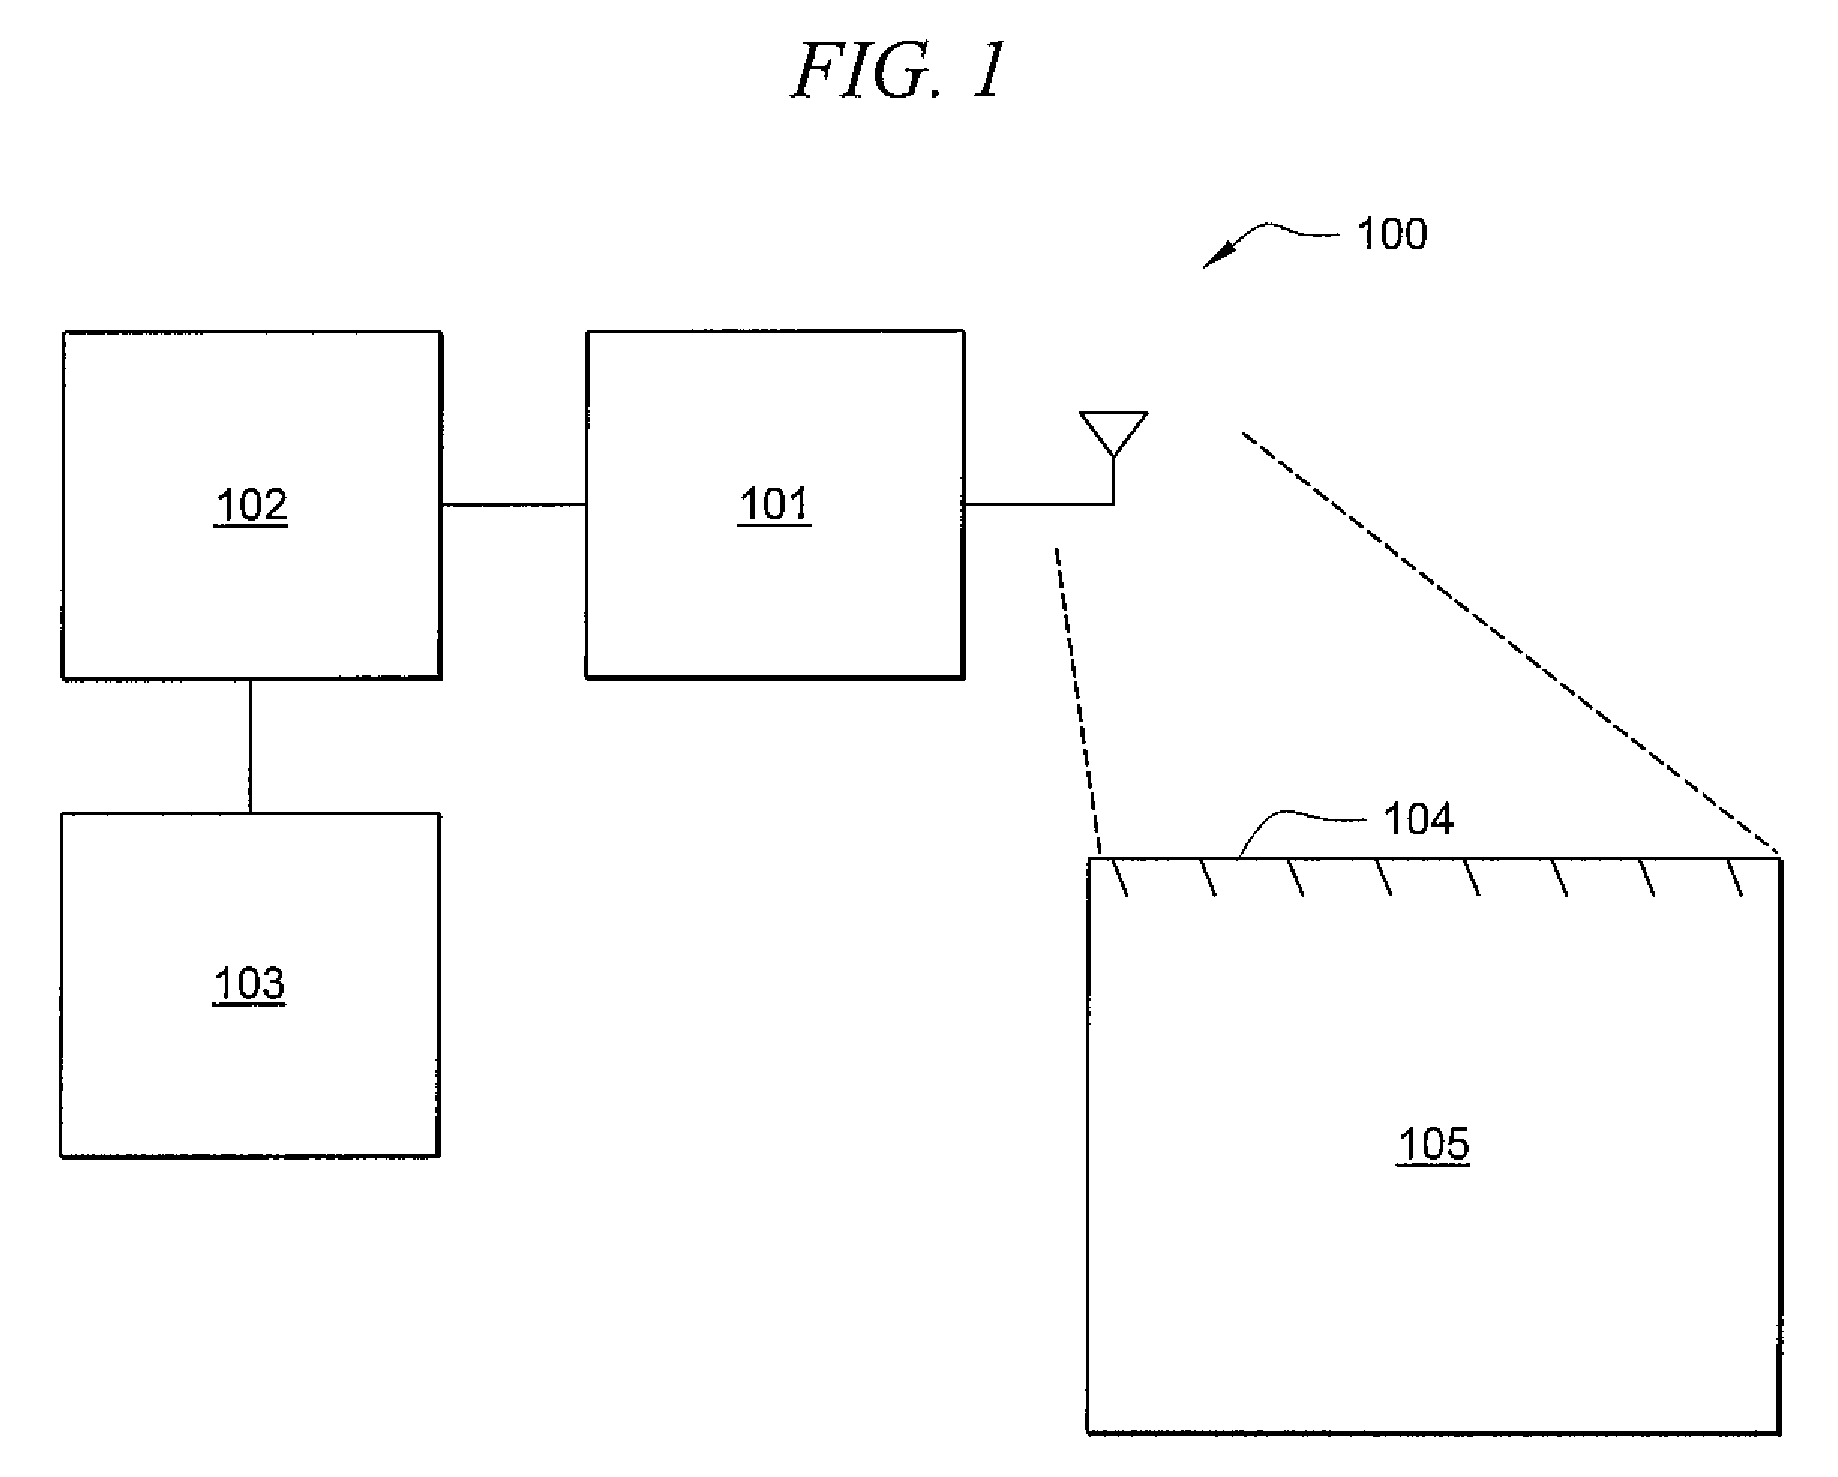
[0019]FIG. 1 is an illustration of exemplary system 100 adapted according to one embodiment of the invention. System 100 includes transmitter / receiver (Tx / Rx) unit 101, processing unit 102, and display unit 103 and is operable to produce a real-time Three-Dimensional (3D) radar display.

[0020]Tx / Rx unit 101 includes a plurality of elements that radiate radar signals and receive returned signals. In some embodiments, transmitter and receiver elements may be separate or may be integrated, e.g., transceiver elements. In this example, system 100 is a Ground Penetrating Radar (GPR) system, and its radiation is focused on ground survey area 104. The radiation penetrates the ground and provides data with regard to survey volume 105.

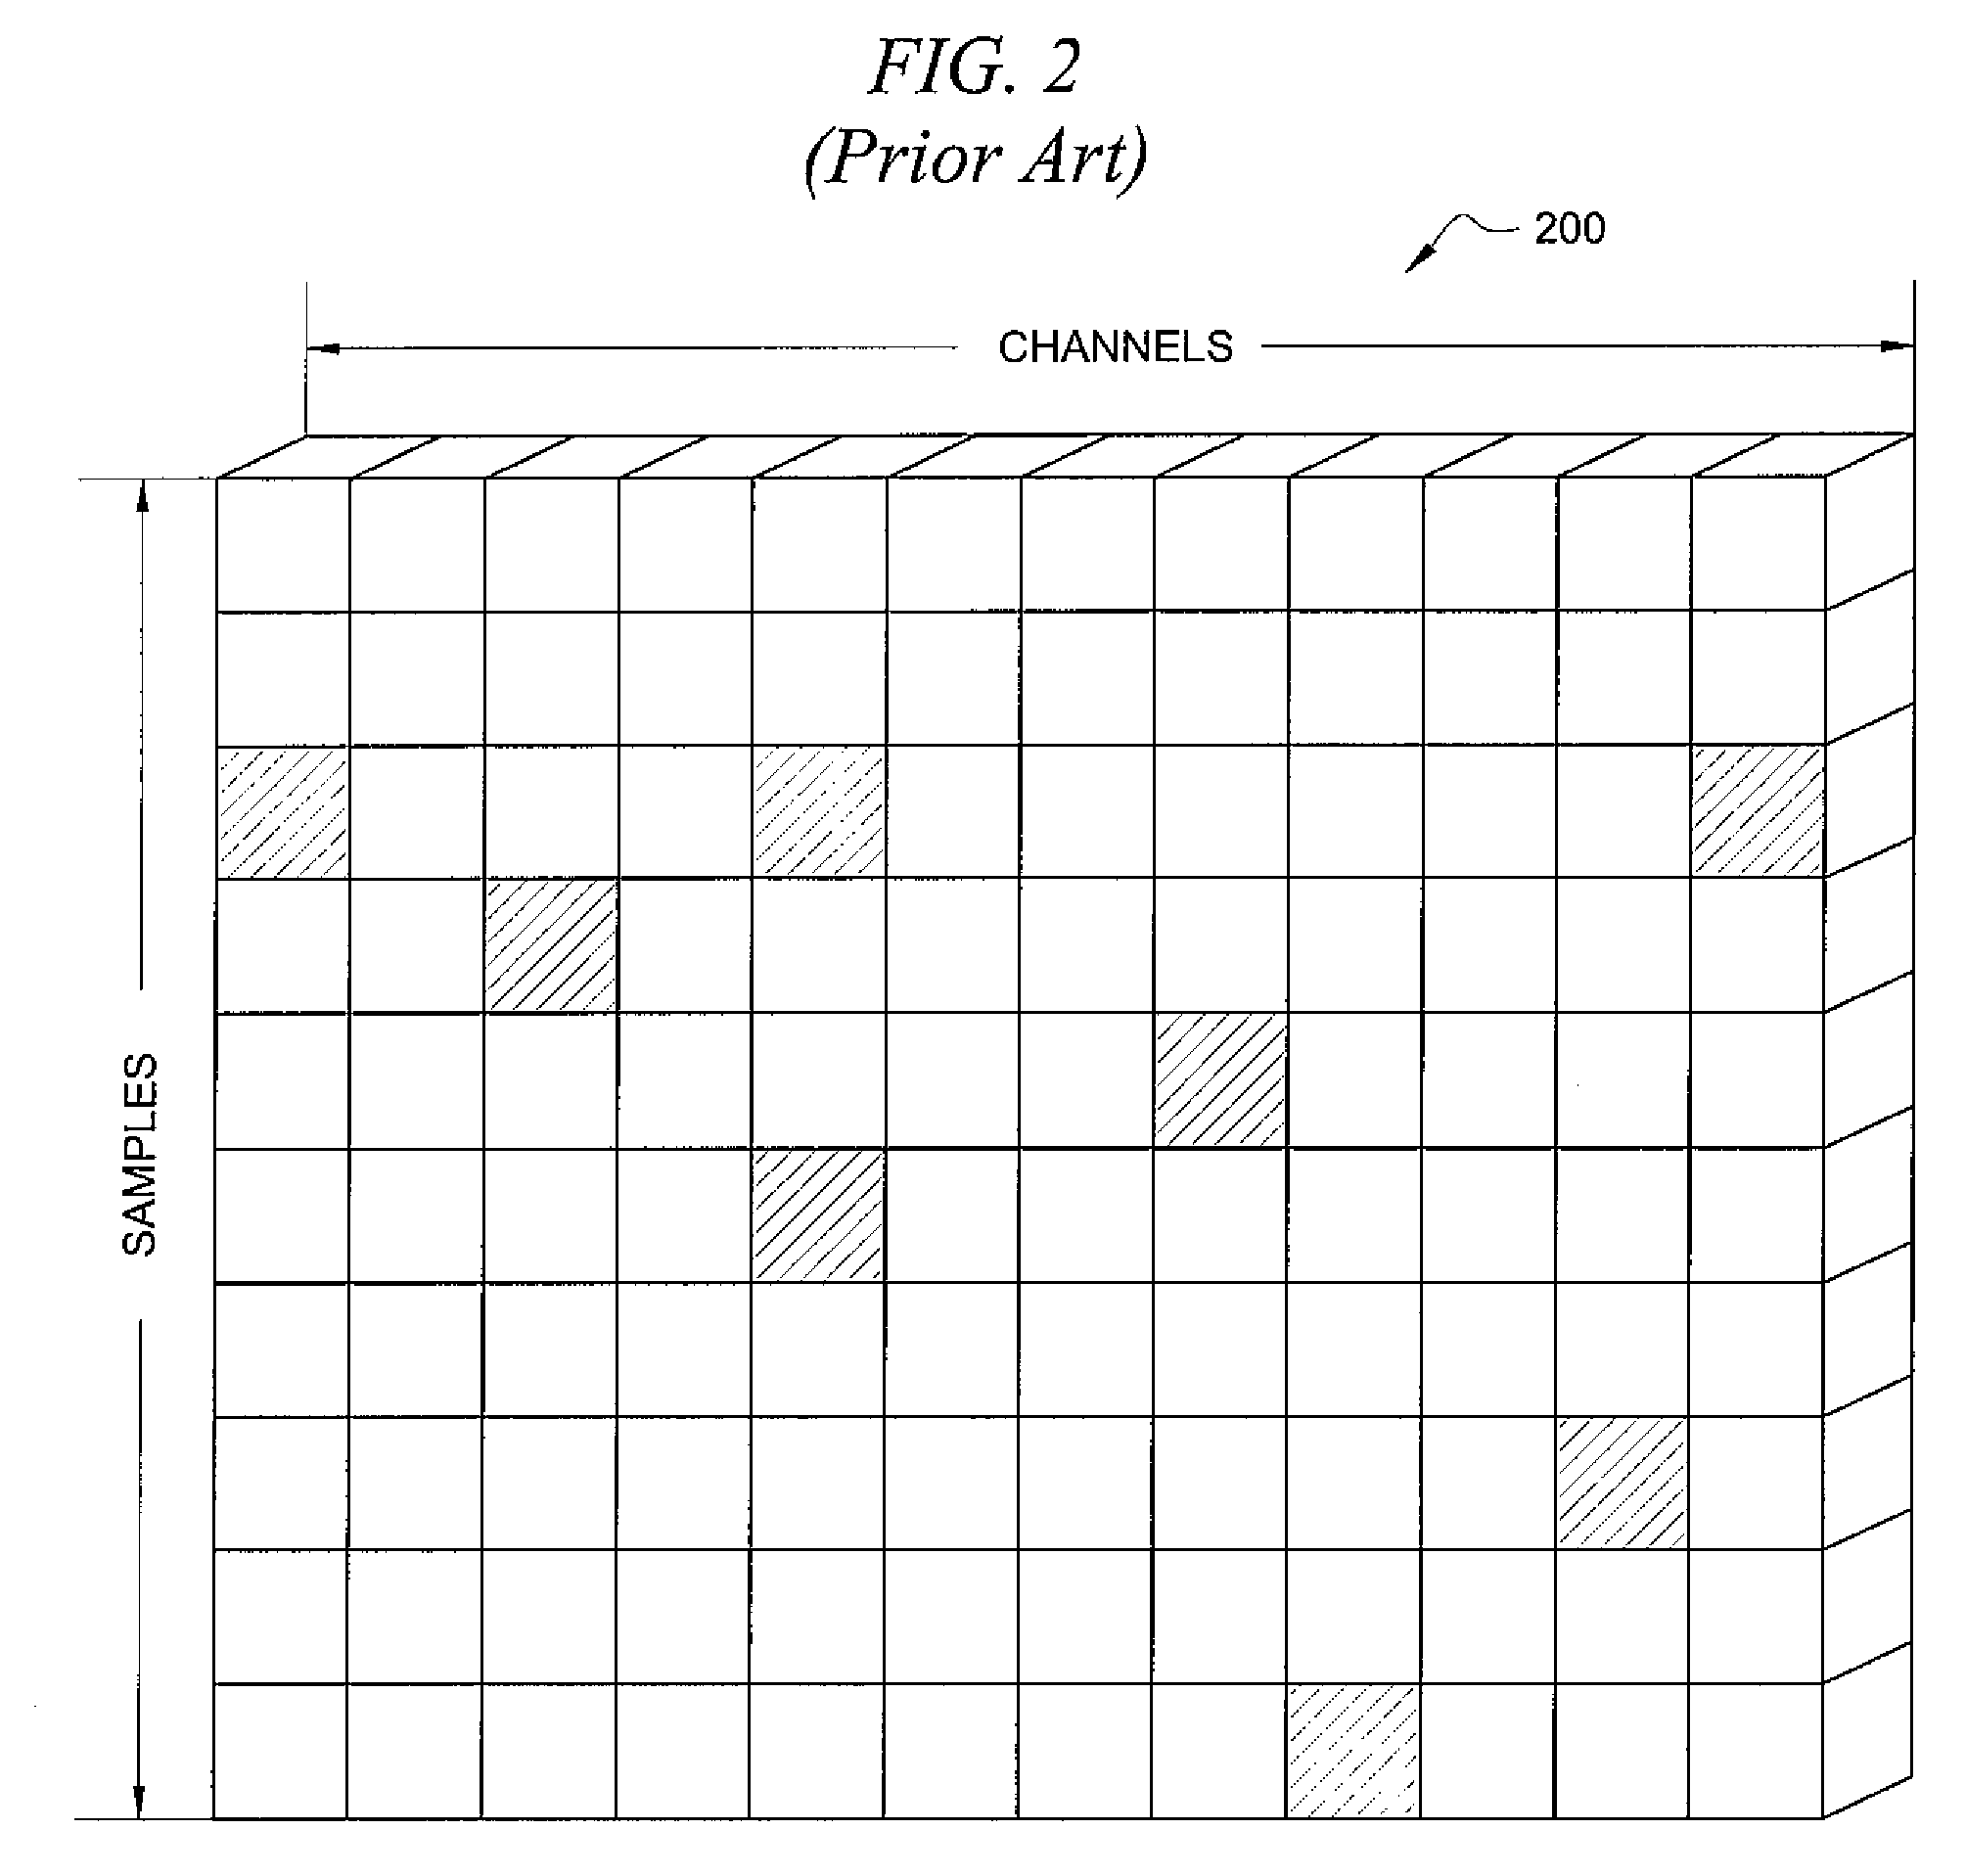
[0021]In this example, the transmitter / receiver elements are arranged in one or more linear arrays parallel to the ground, with each of the elements corresponding to a portion of the width of survey area 104. Further, in GPR systems, the time between a transmit p...


PUM


Abstract

A system for analyzing and displaying radar information comprises: a transmit and receive unit operable to transmit radar signals to a survey volume and to receive radar returned radar signals, a processing unit operable to: receive radar data from the returned radar signals, reduce the data into depth bins, each with a score based on received signal strength, create connections among depth bins based on respective scores, and to eliminate ones of the depth bins that do not meet a threshold number of connections, the system further comprising a display unit operable to create a display of at least a subset of the depth bins that are not eliminated by the processing unit.

Description

TECHNICAL FIELD[0001]The present description relates, in general, to techniques for analyzing and displaying radar information.BACKGROUND OF THE INVENTION[0002]Modern Ground Penetrating Radar (GPR) systems typically analyze and display radar data for a user to interpret. The data can be displayed to the user in a variety of ways, usually in “waterfall” plots that include a Two-Dimensional (2D) rendering of a most recent scan. However, prior art plots usually take one of three forms—as A-Scans, B-Scans or C-Scans. An A-Scan represents a single channel of a scan, and it is a line trace similar to the display on an oscilloscope. An A-Scan is a one dimensional data set with its progression being in the depth or time dimension. A B-Scan is a 2D slice of either a down-track or a cross-track in the ground (down-track and cross-track are explained in more detail with regard to FIG. 9). B-scans are often textured or color mapped. A C-Scan is similar to what many people call a “plan view” or ...

Claims


Application Information

Patent Timeline
Patent Type & Authority Patents(United States)
IPC IPC(8): G01S13/88
CPCG01S7/20G01S13/885
Inventor LAVEDAS, STEVENPATRIKAR, AJAYHIBBARD, MARK
Owner NIITEK
Why Eureka
Try Eureka