Soybean markers linked to SCN resistance
a technology of scn resistance and soybeans, applied in the field of plant disease resistance, can solve the problems of scn phenotyping time-consuming, cost and labor-intensive, and pathogens that are difficult to detect on the roots, and achieve the effects of more accurate and rapid commercialization of scn-resistant soybean varieties, reduced cost and time, and early selection
- Summary
- Abstract
- Description
- Claims
- Application Information
AI Technical Summary
Benefits of technology
Problems solved by technology
Method used
Image
Examples
example 1
Materials and Methods
[0104]24 soybean cultivars and SCN mapping parents were used to identify markers linked to the SCN resistance phenotype. 14 of the cultivars were SCN susceptible: 75110, 75155, 75163, 99630, 99726, 95895-755PRU, 99345-31, 75192, 75209, 75159, Essex, Williams82, 75213, and 6CH026-035. 10 of the cultivars were SCN resistant: Maverick, Peking, PI209332, PI437654, 99811, 99294, Forrest, PI88788, PI437654, and 98860-71.
[0105]SCN bioassay: SCN bioassays were performed to generate phenotype information of mapping populations produced by crossing SCN resistant soybean variety 98860-71 with SCN susceptible soybean varieties 75213 and 6CH026-035. The phenotype information of the mapping population used is listed in Table 3. The industry does not have a uniform approach to categorizing resistance levels in soybean varieties. Therefore, resistance levels were categorized in terms of “SCN score:” SCN score 0-10=R (resistance); SCN score 10.1-29.9=MR (medium resistance); SCN ...
example 2
Identification of Physical Positions of QTLs and QTL Intervals that are Linked to SCN Resistance Genes
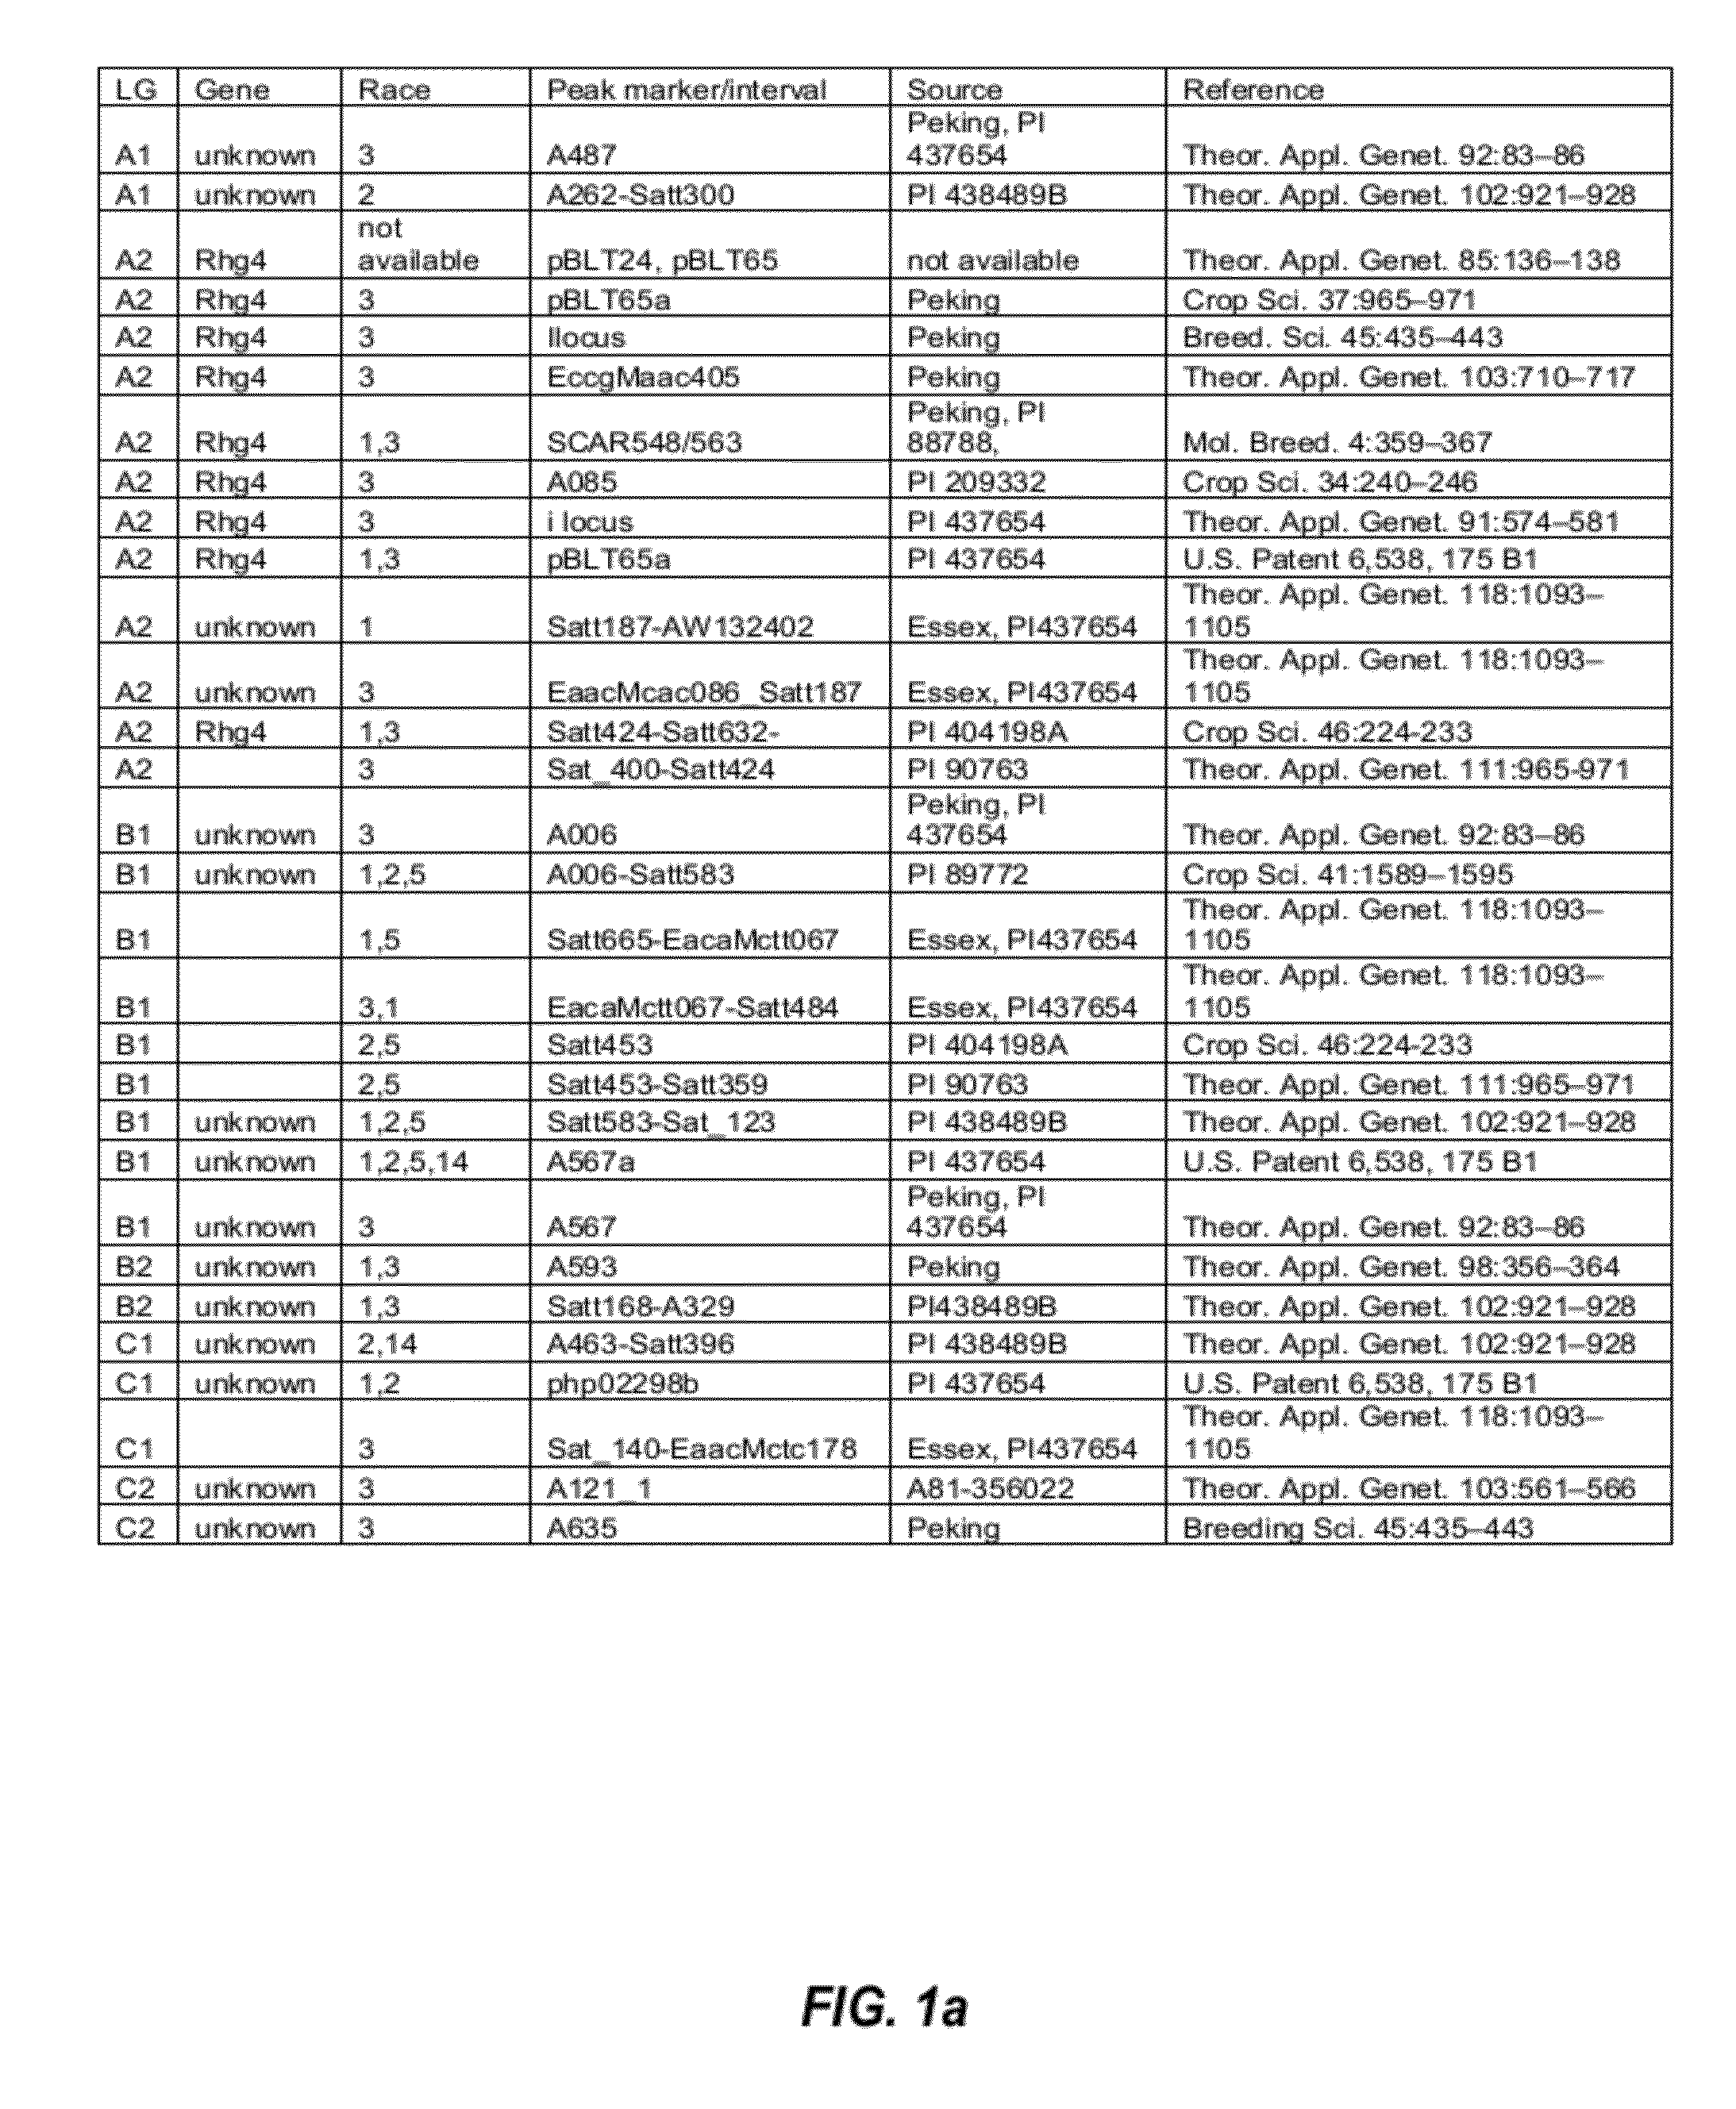
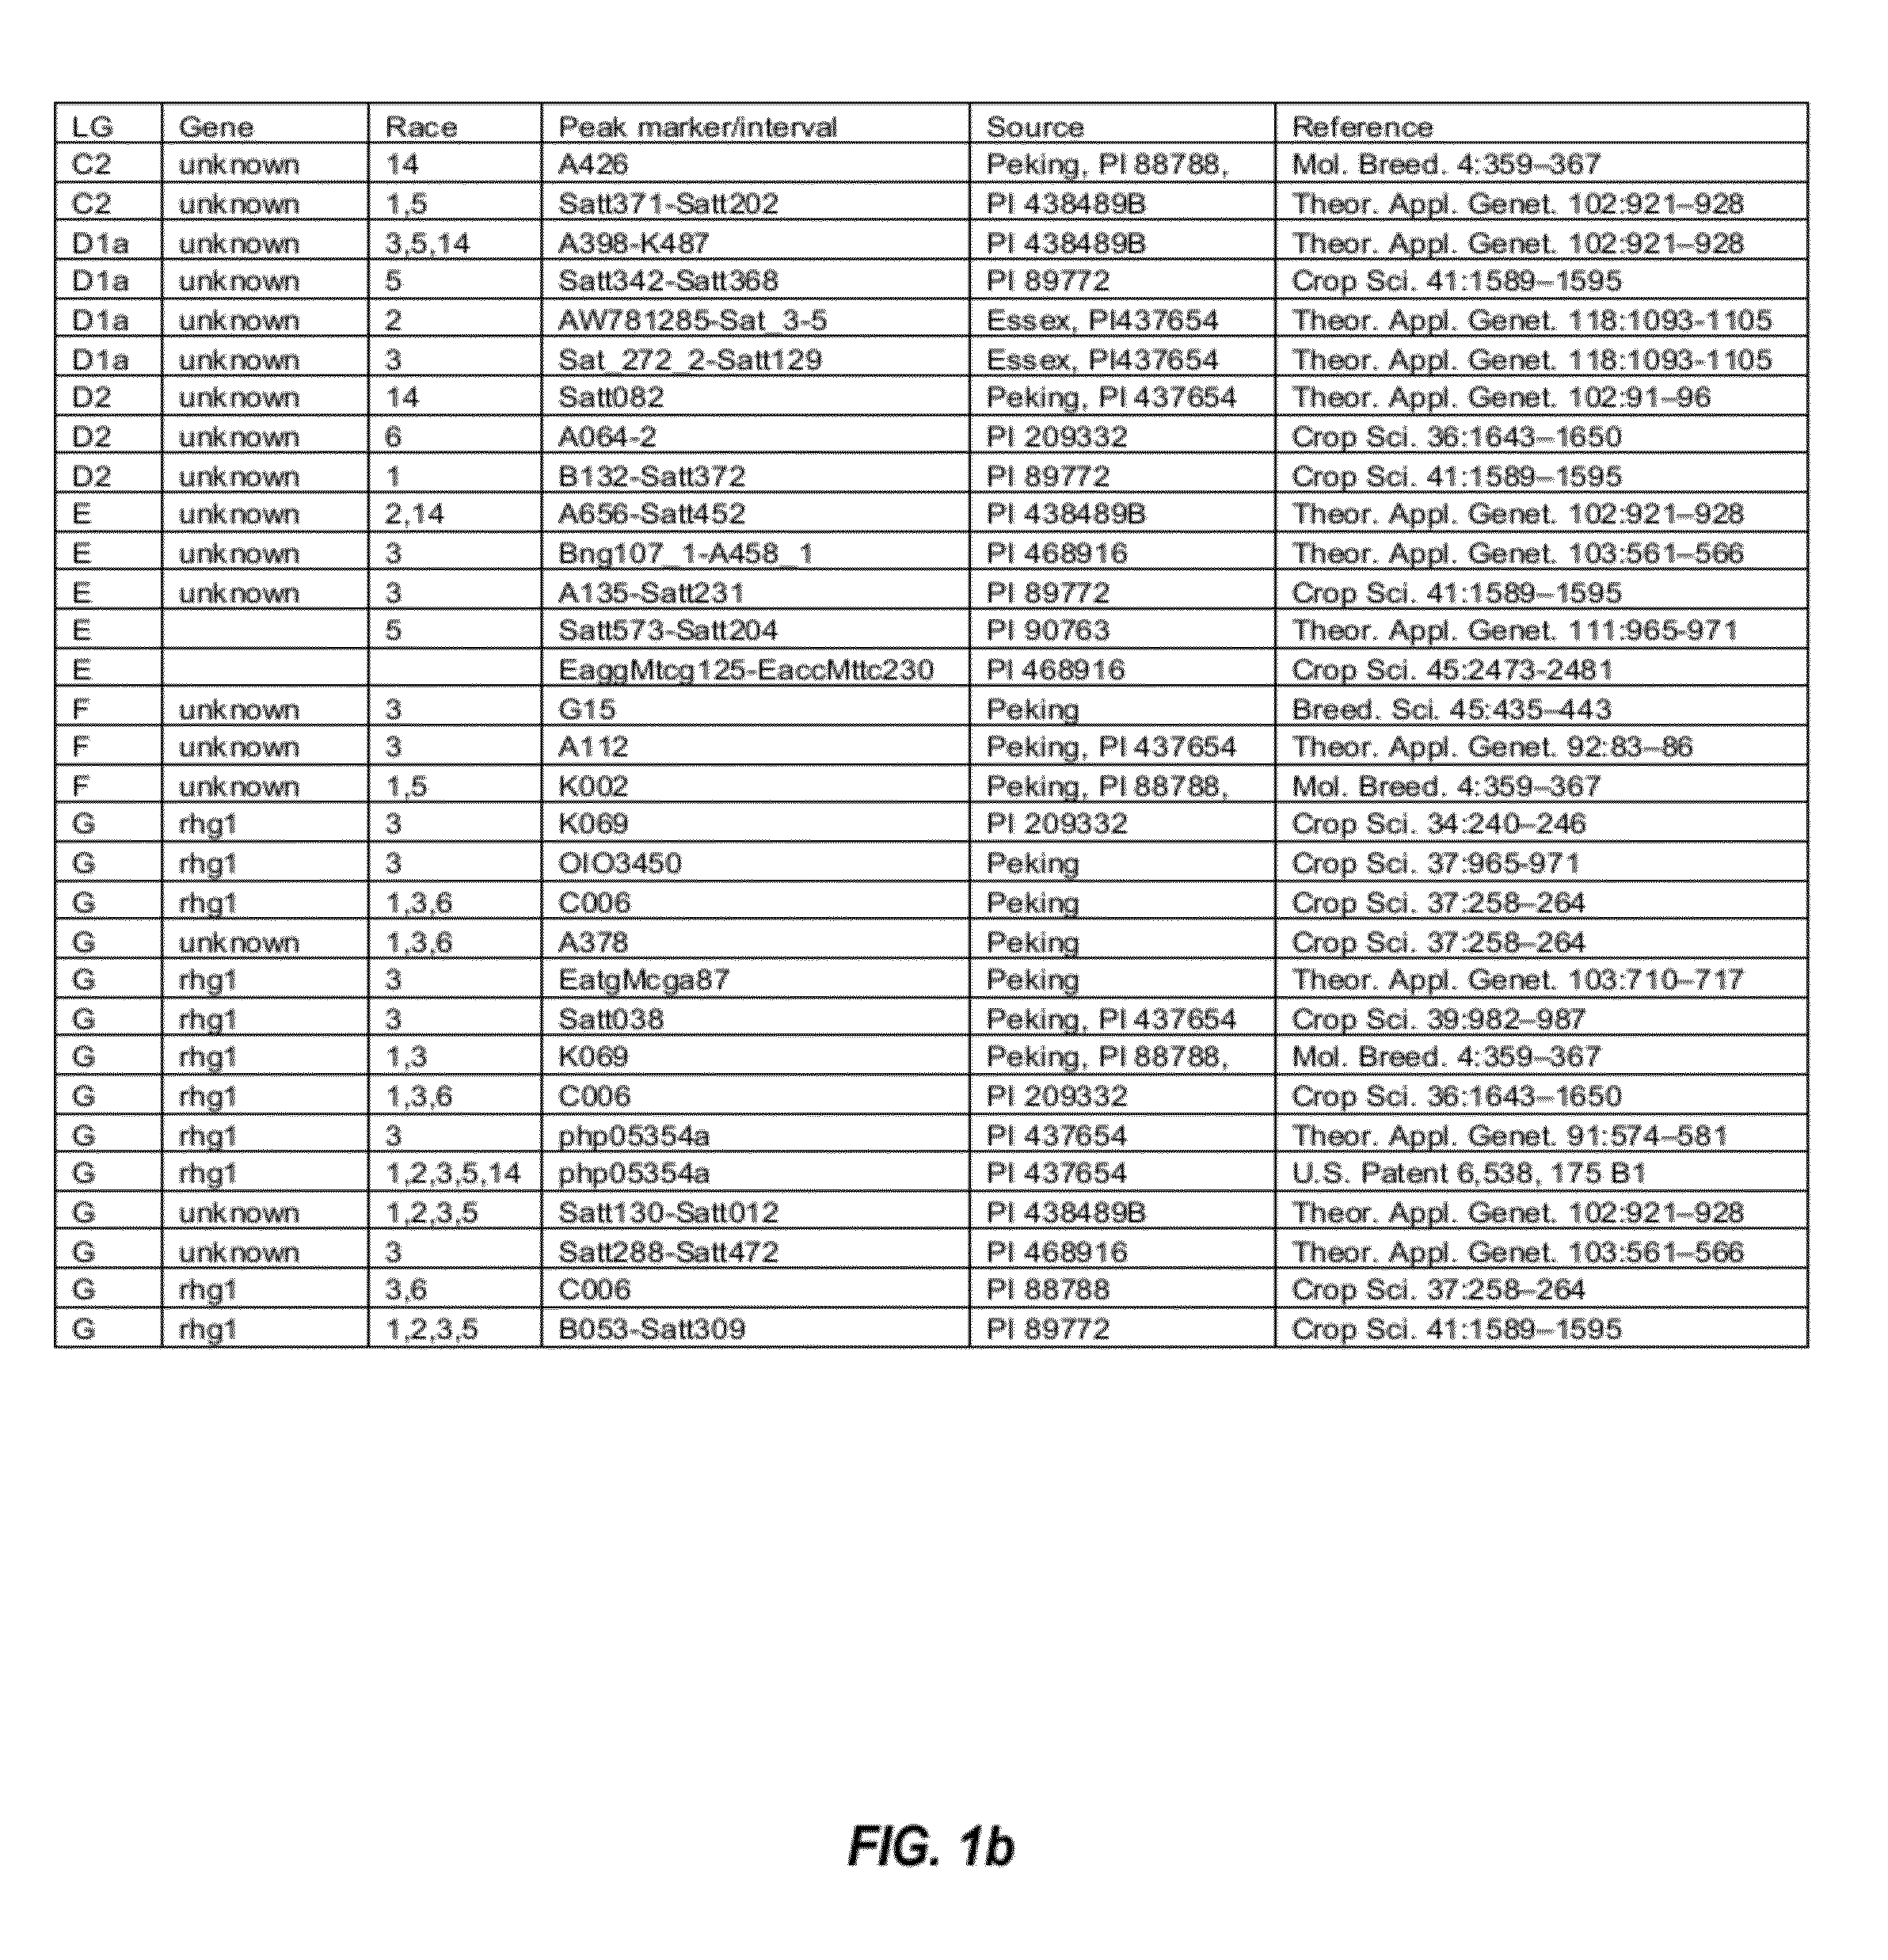
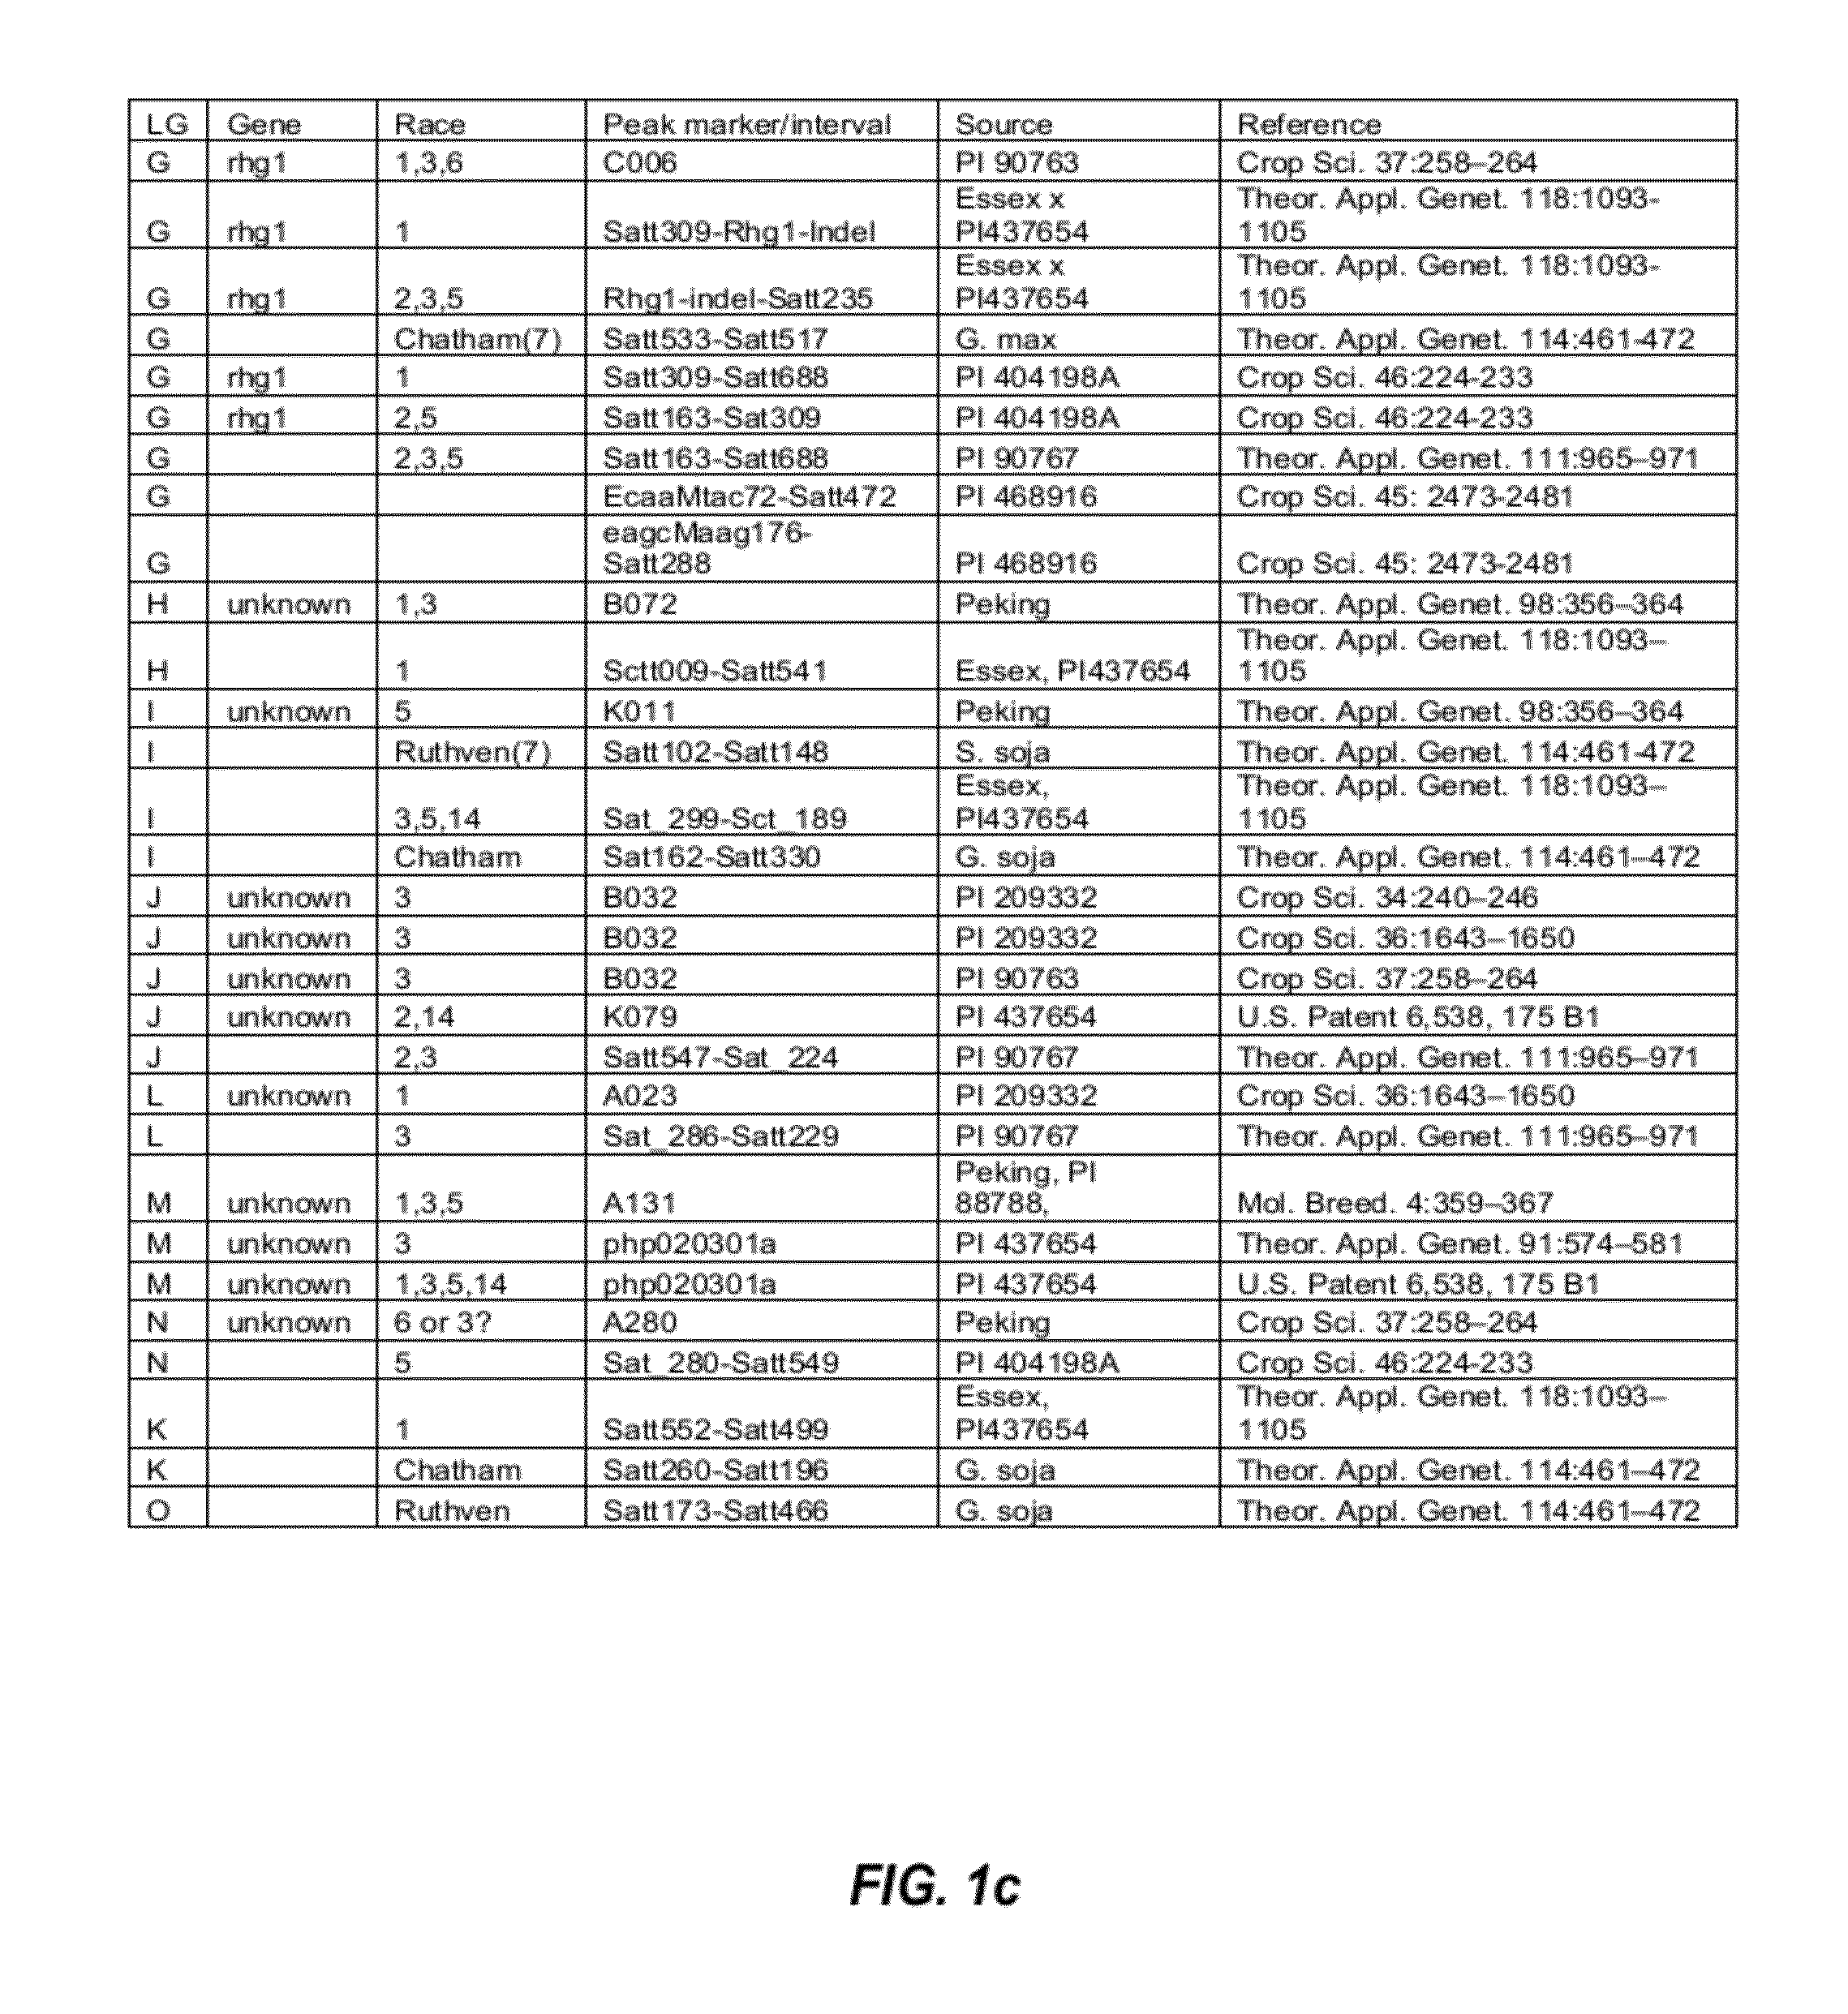
[0107]QTLs that are involved in SCN resistance were initially identified by studying the SCN literature. The initially identified SCN-associated QTLs found in the SCN literature are listed in FIGS. 1a and 1b.
[0108]From the list of QTLs that were initially identified in the SCN literature, several distinct QTL intervals that are involved in resistance to different SCN races were determined by reference to the soybean genome map. See, e.g., FIG. 2. For example, QTL intervals on linkage group (LG) G were determined as shown in FIG. 3; QTL intervals on LG A2 were determined as shown in FIG. 4; QTL intervals on LG B1 were determined as shown in FIG. 5; and QTL intervals on LG I were determined as shown in FIG. 6. Table 2 lists exemplary QTLs and their corresponding determined QTL intervals that are associated with resistance to different SCN races.
example 3
Identification of SNP Markers that are Physically Located in / Near / Between the QTLs and QTL Intervals that are Linked to SCN Resistance Genes
[0109]The soybean genome was searched using BLAST™ for SNP markers that are physically located in, near, or between the QTL intervals that were determined. It was hypothesized that some of these SNP markers may be linked to the SCN resistance phenotype. A total of 79 SNP markers were selected for an initial screen using 24 soybean lines (14 SCN susceptible and 10 SCN resistant) to determine which, if any, of these SNP markers are linked to the SCN resistance phenotype. 25 of the 79 markers were located on LG G, 12 of the markers were located on LG A2, 22 of the markers were located on LG B1, and 20 of the markers were located on LG I. All of the 79 selected markers are listed in Table 2.
[0110]
TABLE 2List of the 79 SNPs for screening with 24 soybean linesMarkerSNP alleleLinkage groupChromosomeBARC_018419_02911[C / T]A28BARC_025811_05088[C / T]A28BARC...
PUM
 Abstract
Description
Claims
Application Information
 - R&D
- Intellectual Property
- Life Sciences
- Materials
- Tech Scout
- Unparalleled Data Quality
- Higher Quality Content
- 60% Fewer Hallucinations
Browse by: Latest US Patents, China's latest patents, Technical Efficacy Thesaurus, Application Domain, Technology Topic, Popular Technical Reports.
© 2025 PatSnap. All rights reserved.Legal|Privacy policy|Modern Slavery Act Transparency Statement|Sitemap|About US| Contact US: help@patsnap.com


