
Method and device for detecting non-unimodal distribution of measurement data

A technology of measuring data, inspection and measurement, applied in the direction of comprehensive factory control, comprehensive factory control, electrical program control, etc., can solve problems such as untimely detection, non-unimodal distribution, defect error, etc., to improve accuracy, reduce The effect of the probability of a larger error

Inactive Publication Date: 2009-11-11
SEMICONDUCTOR MANUFACTURING INTERNATIONAL (BEIJING) CORP
View PDF1 Cites 1 Cited by
  • Summary
  • Abstract
  • Description
  • Claims
  • Application Information

AI Technical Summary

Problems solved by technology

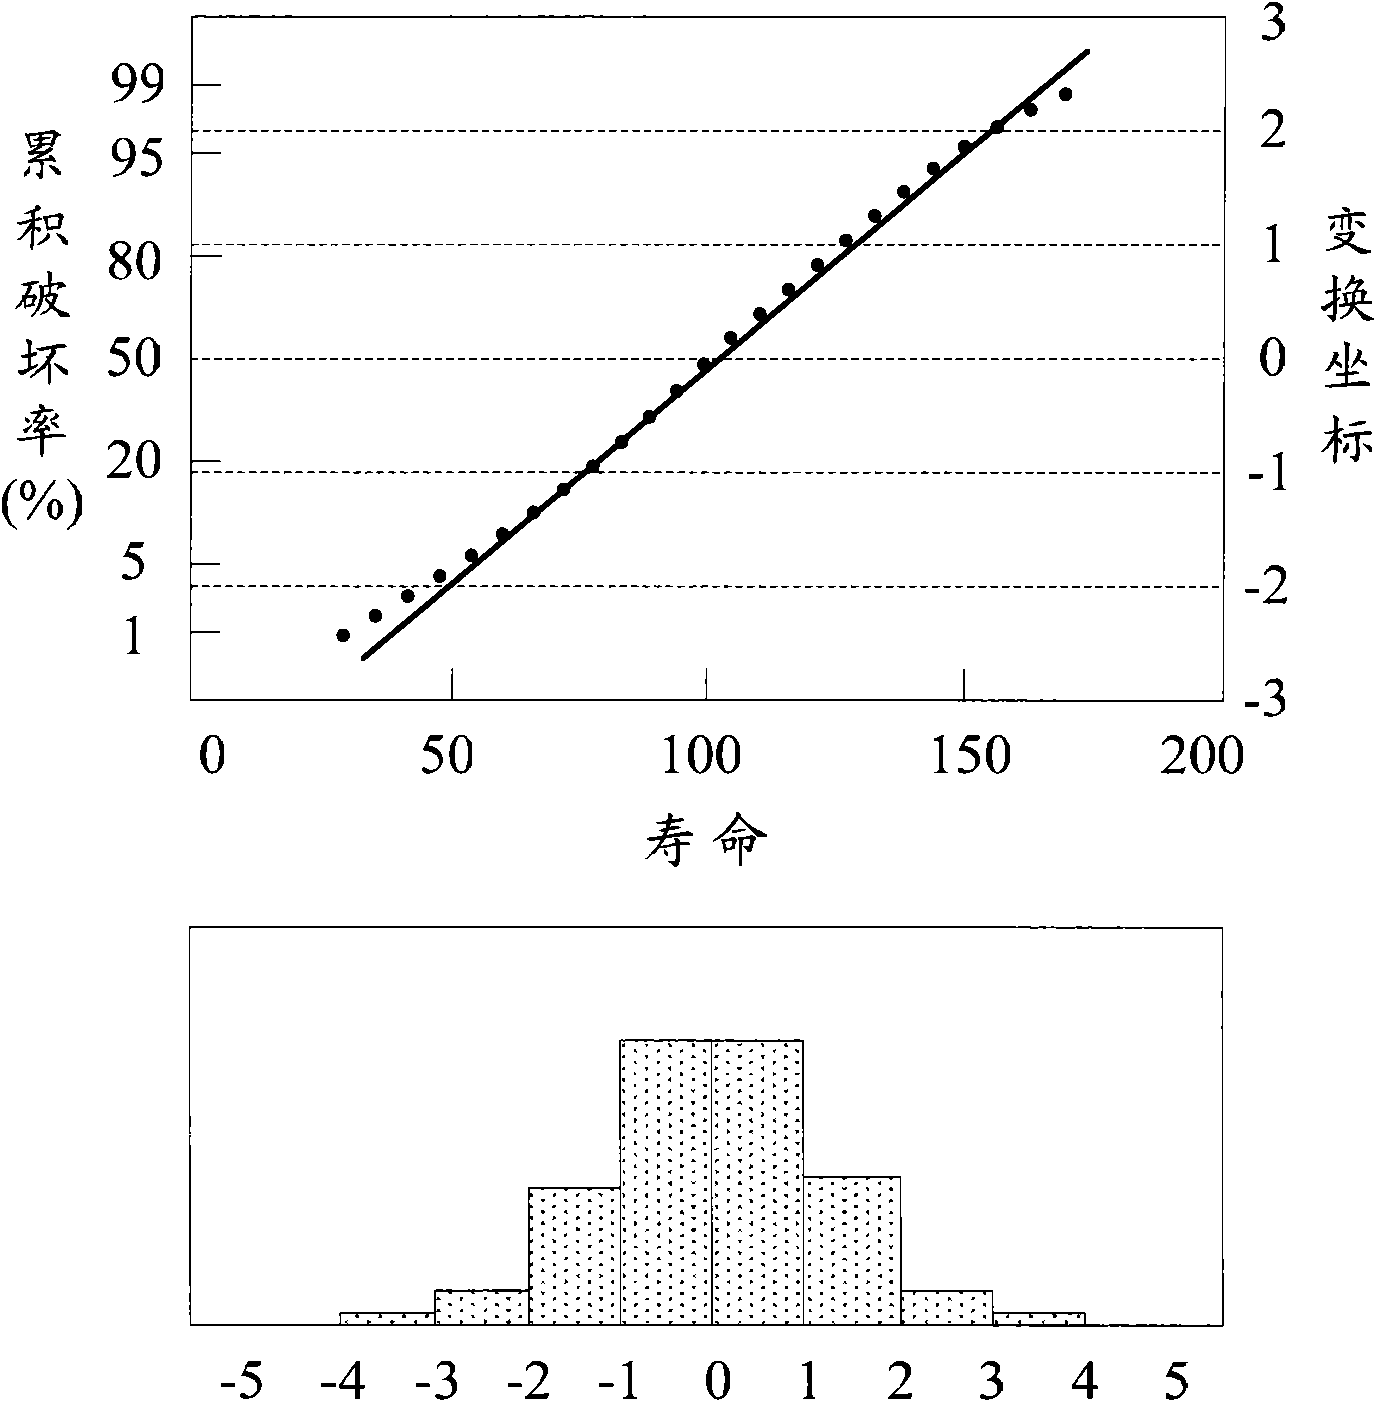
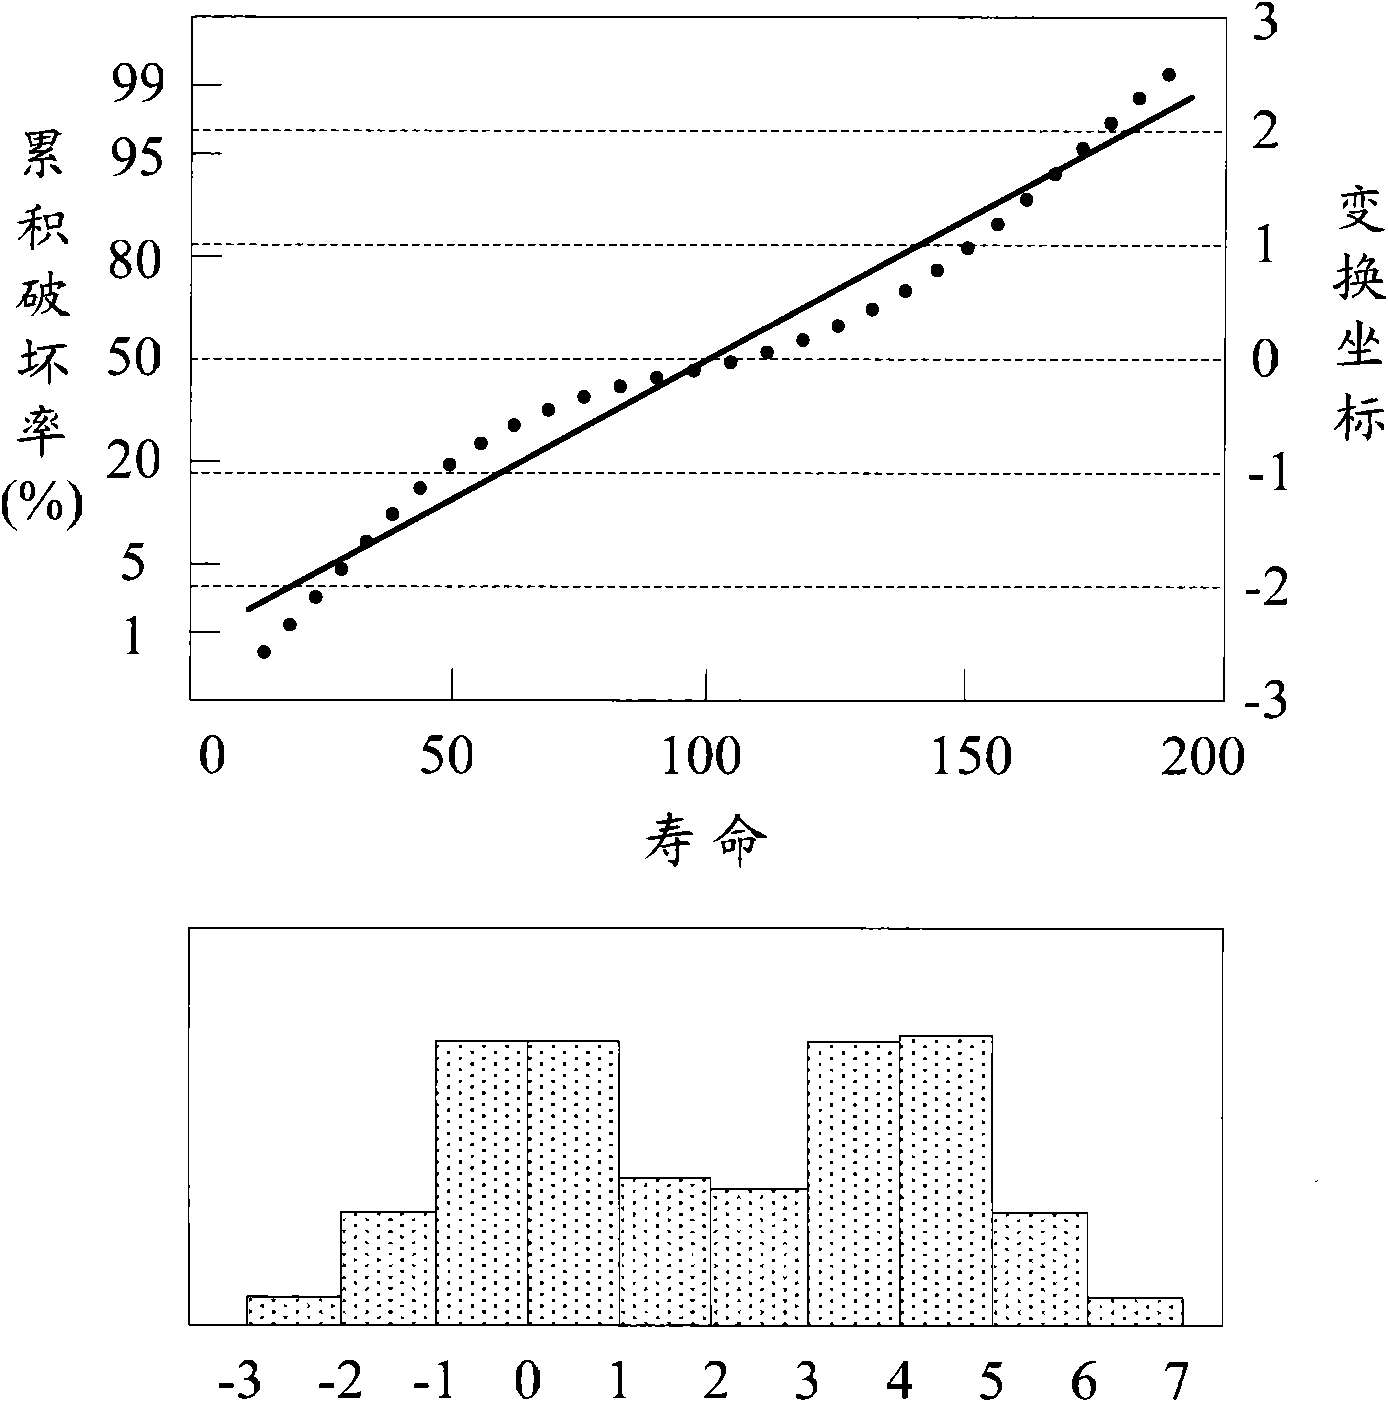
However, when actually collecting the measurement data in the production process, there will be a phenomenon that the measurement data is a non-unimodal distribution (non-normal distribution), such as figure 2 The bimodal distribution shown
Measurement data with non-unimodal distribution will produce large errors when applied to analyze defects in the manufacturing process, which will affect the accuracy of statistical process control
[0007] Due to the lack of ready-made or similar statistical methods or means for the measurement data of non-unimodal distribution in the existing technology, it cannot be detected in time, and then large errors will be generated when analyzing defects in the manufacturing process, which will affect the accuracy of statistical process control sex

Method used


Image

  • Method and device for detecting non-unimodal distribution of measurement data
  • Method and device for detecting non-unimodal distribution of measurement data
  • Method and device for detecting non-unimodal distribution of measurement data

Examples


Embodiment Construction

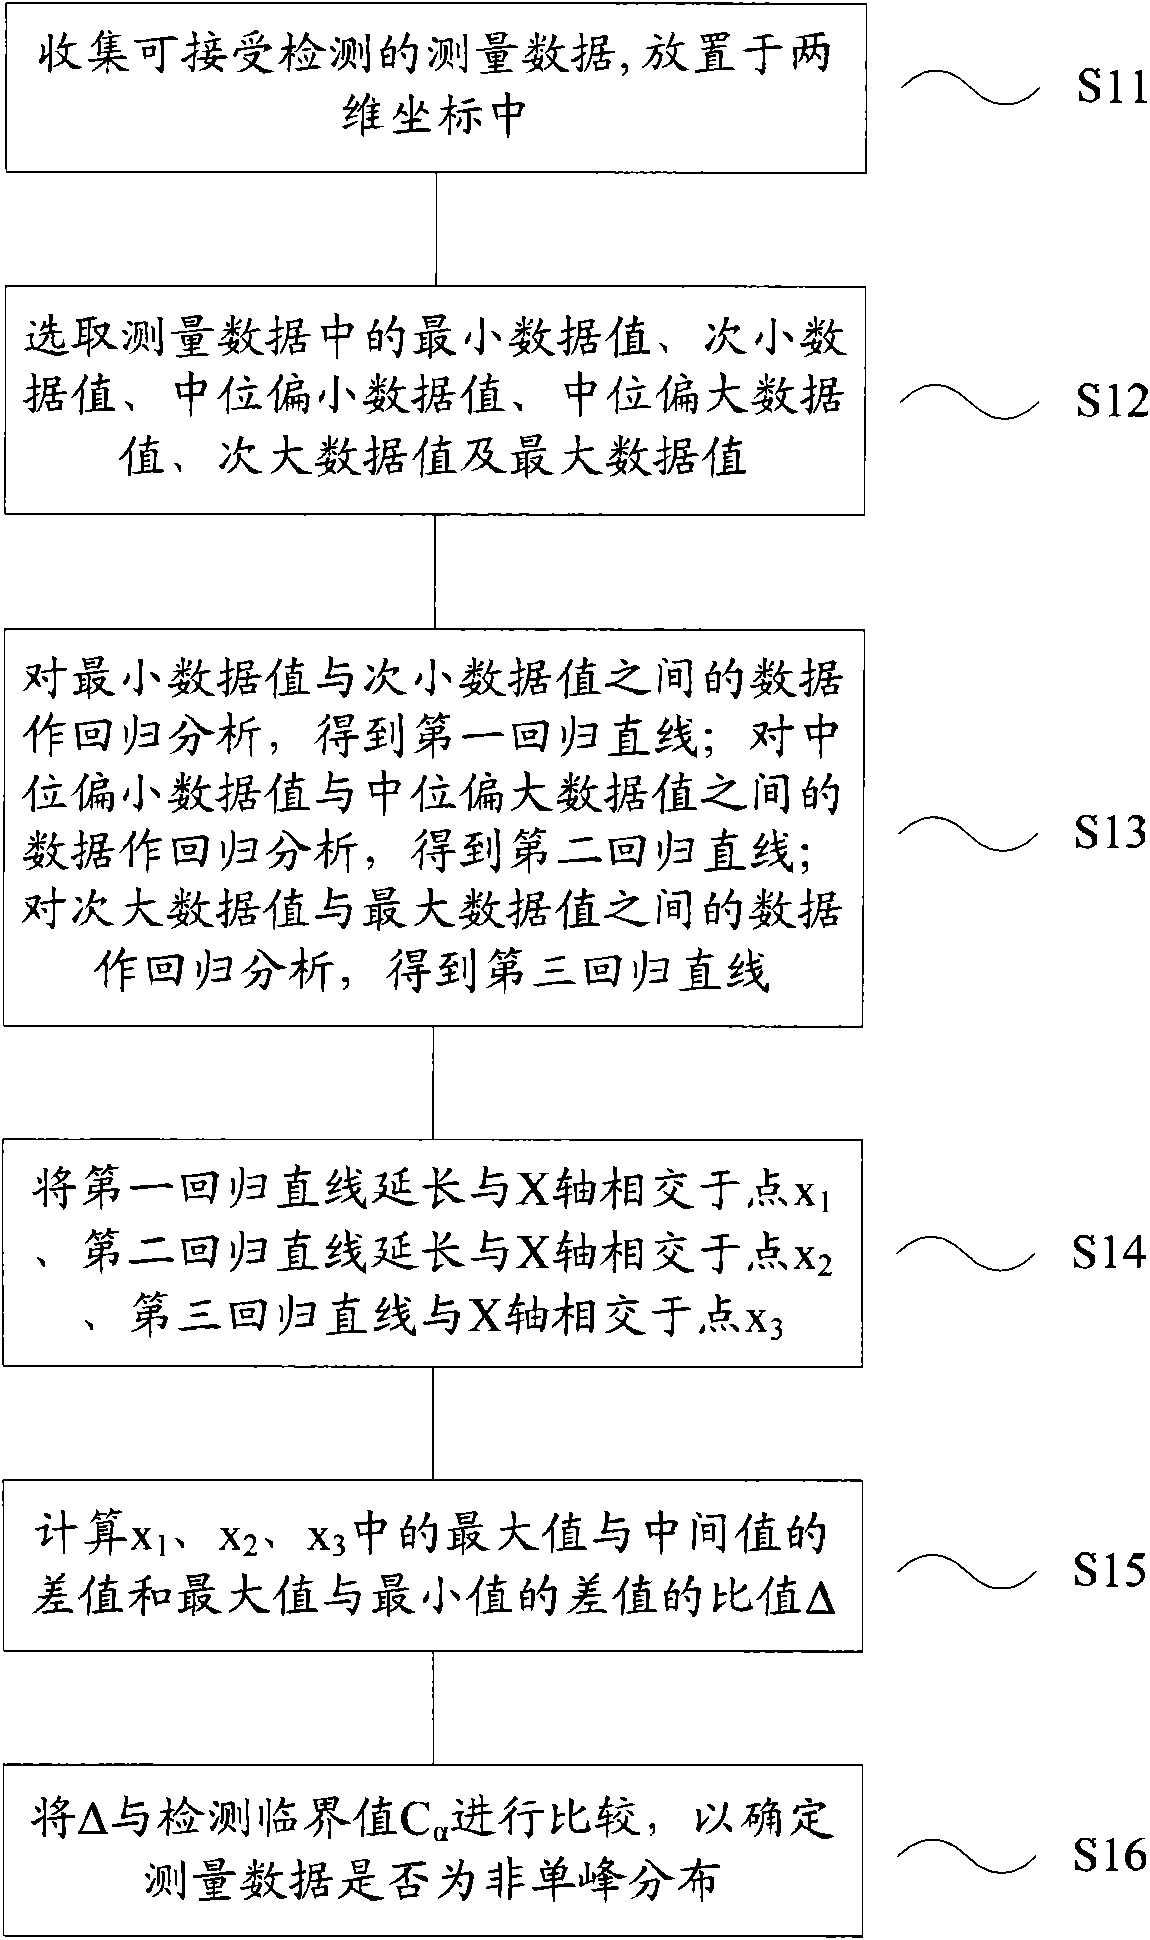
[0024] The method and device for detecting the non-unimodal distribution of measurement data disclosed by the present invention place the measurement data in two-dimensional coordinates, and select the smallest data value, the next smallest data value, the small median data value, and the median deviation in the measurement data. The large data value, the second largest data value and the maximum data value are used to determine the first regression line, the second regression line and the third regression line, and calculate the difference between the maximum value and the median value at the intersection of the regression line and the X-axis and the ratio Δ of the difference between the maximum value and the minimum value; compare Δ with the detection critical value C α A comparison is made to determine whether the measured data is non-unimodal. Since the above-mentioned method can timely detect which measurement data are non-unimodal distributions, the probability of large ...


PUM


Abstract

The invention discloses a method for detecting the non-unimodal distribution of measurement data, comprising the following steps: collecting measurement data capable of being detected; selecting a minimum data value, a second minimum data value, a median minimum data value, a median maximum data value, a second maximum data value and a maximum data value in the measurement data; making a first regression line for data between the minimum data value and the second minimum data value; making a second regression line for data between the median minimum data value and the median maximum data value; making a third regression line for data between the second maximum data value and the maximum data value; calculating the ratio Delta of a difference value between a maximum value and a median value to a difference value between the maximum value and a minimum value among an intersecting point x1 of the first regression line and an X-axis, an intersecting point x2 of the second regression line and the X-axis and an intersecting point x3 of the third regression line and the X-axis; and comparing the Delta with a detection critical value C alpha so as to confirm whether the measurement data is in non-unimodal distribution or not. The invention also provides a device for detecting the non-unimodal distribution of measurement data. The invention improves the accuracy of control in a counting process.

Description

technical field [0001] The invention relates to a method and a device for detecting non-unimodal distribution of measurement data. Background technique [0002] In the industrial production process, in order to find out the problems in the process in time, eliminate the problems or reduce the losses caused by the problems, it is necessary to carry out quality management control on each process, which includes testing each process. For example, the manufacturing process of semiconductor integrated circuits is a planar manufacturing process, which combines photolithography, etching, deposition, ion implantation and other processes to form a large number of various types of complex devices on the same substrate, and integrate them interconnected for full electronic functionality. Among them, a problem in any step of the process may lead to the failure of the production of the circuit. Therefore, in the prior art, the production results of each step of the process are often det...

Claims


Application Information

Patent Timeline
Patent Type & Authority Applications(China)
IPC IPC(8): G05B19/418
CPCY02P90/02
Inventor 简维廷王邕保
Owner SEMICONDUCTOR MANUFACTURING INTERNATIONAL (BEIJING) CORP
Learn More