

Methods and systems for incorporating multiple environmental and genetic risk factors
An environmental factor, environmental technology, applied in the field of integrating multiple environmental and genetic risk factors and systems, can solve expensive and other problems
- Summary
- Abstract
- Description
- Claims
- Application Information
AI Technical Summary
Problems solved by technology
Method used
Image

Examples
Embodiment 1
[0292] Example 1: Evaluation of GCI Scores
[0293] WTCCC data (Wellcome Trust Case Control Consortium, Nature. 447:661-678 (2007)) was used to test the GCI framework. The dataset contains genes from approximately 14,000 individuals classified into seven disease phenotype-based subgroups and an unaffected control subgroup of 1,500 samples from the UK Blood Service Control Group type. The GCI was tested in three different disease conditions: type 2 diabetes, Crohn's disease, and rheumatoid arthritis, which can vary widely in their heritability and mean lifetime risk. Therefore, analyzes were limited to type 2 diabetes, Crohn's disease, and rheumatoid arthritis subgroups and controls. SNPs reported in the literature as being significantly associated with any of these disorders and meeting a series of quality criteria were used (see Table 2).
[0294] Table 2: Allele frequencies for type 2 diabetes, Crohn's disease, and rheumatoid arthritis rate and relative risk
[029...
Embodiment 2
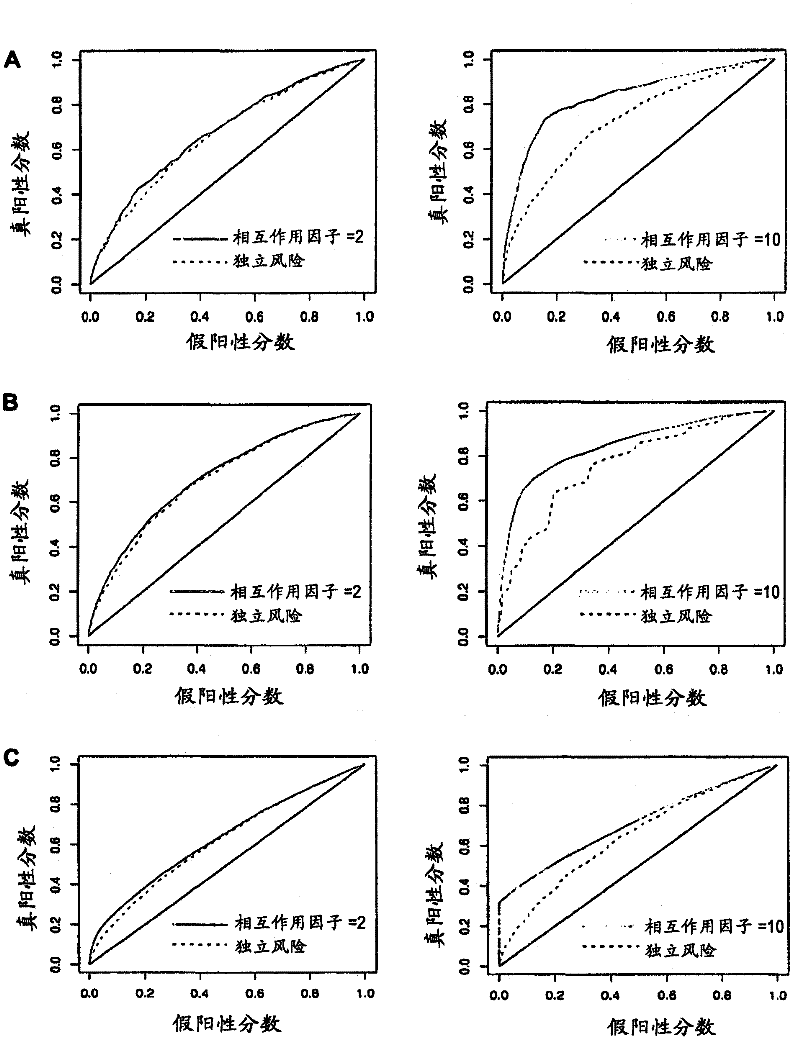
[0349] Example 2: Theoretical effects of unknown SNP-SNP interactions
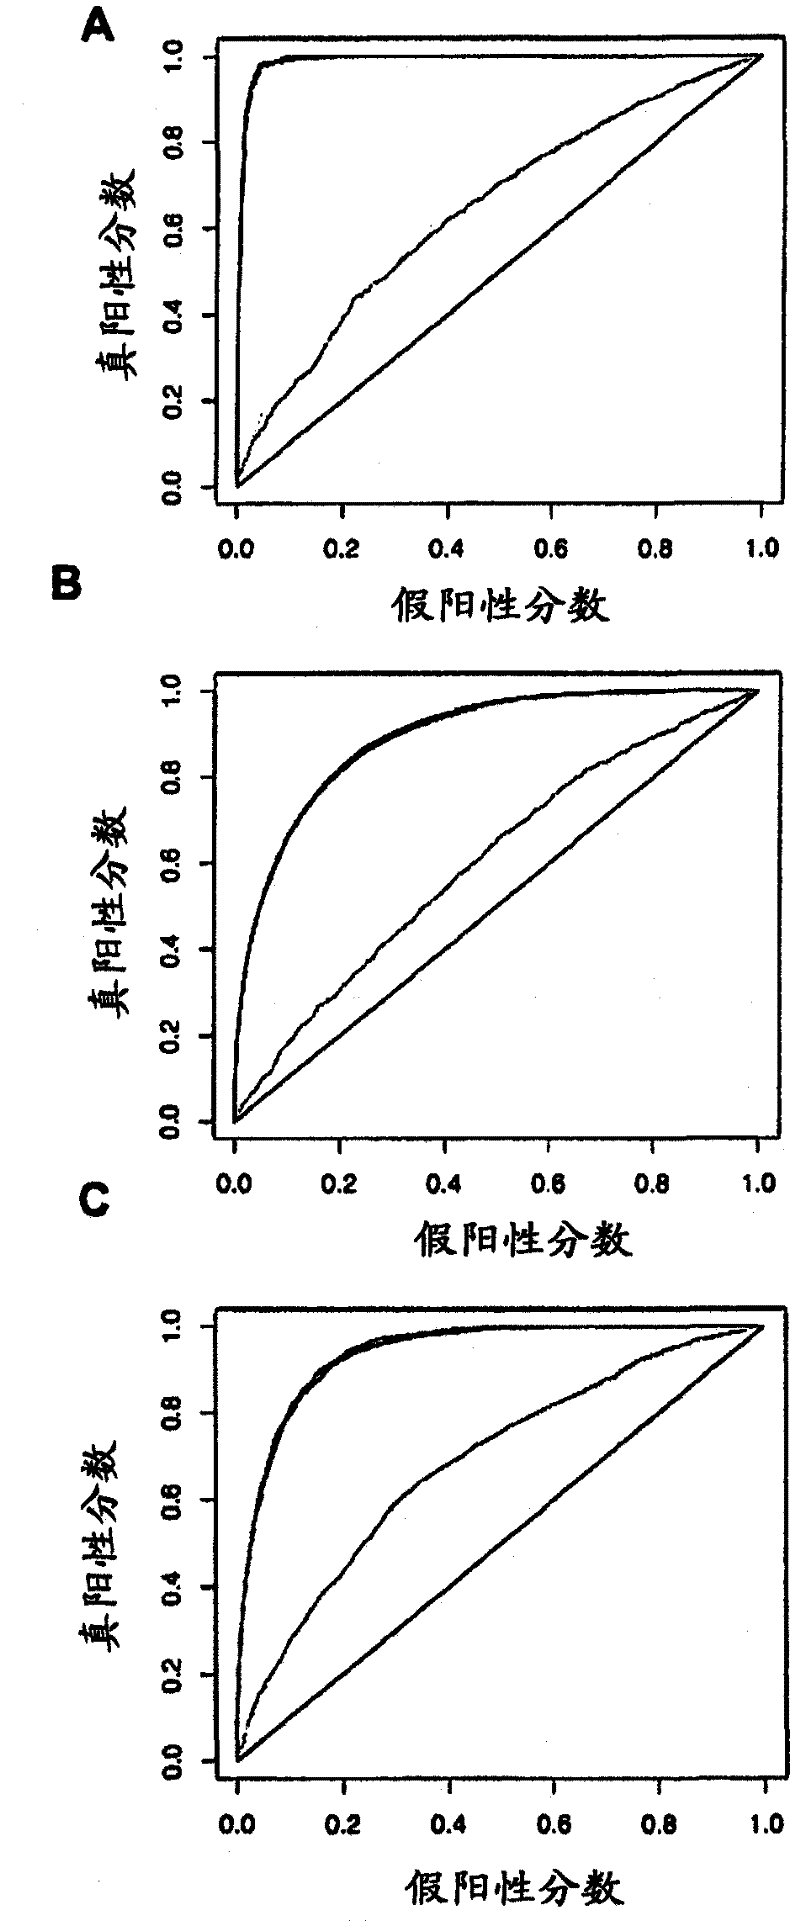
[0350] The GCI score is based on the assumption that all SNPs are independent of each other and that they have independent effects on the risk of the disease. like figure 1 As shown, the three examples studied in this paper did not show significant differences between the GCI model and the model in which the pairwise dependence between SNPs was included by logistic regression. There are some known examples where SNP-SNP interactions do exist in other diseases and must be taken into account (eg, Zheng et al., NEngl J Med. 358:910-919 (2008)). If these interactions are known, they can be easily incorporated into GCI models. However, it is important to understand the effect of unknown SNP-SNP interactions on risk estimates.
[0351] To explore the question of interactions in more detail, the data sets were simulated in an interaction model in which the relative risks were not independent for the individu...
Embodiment 3
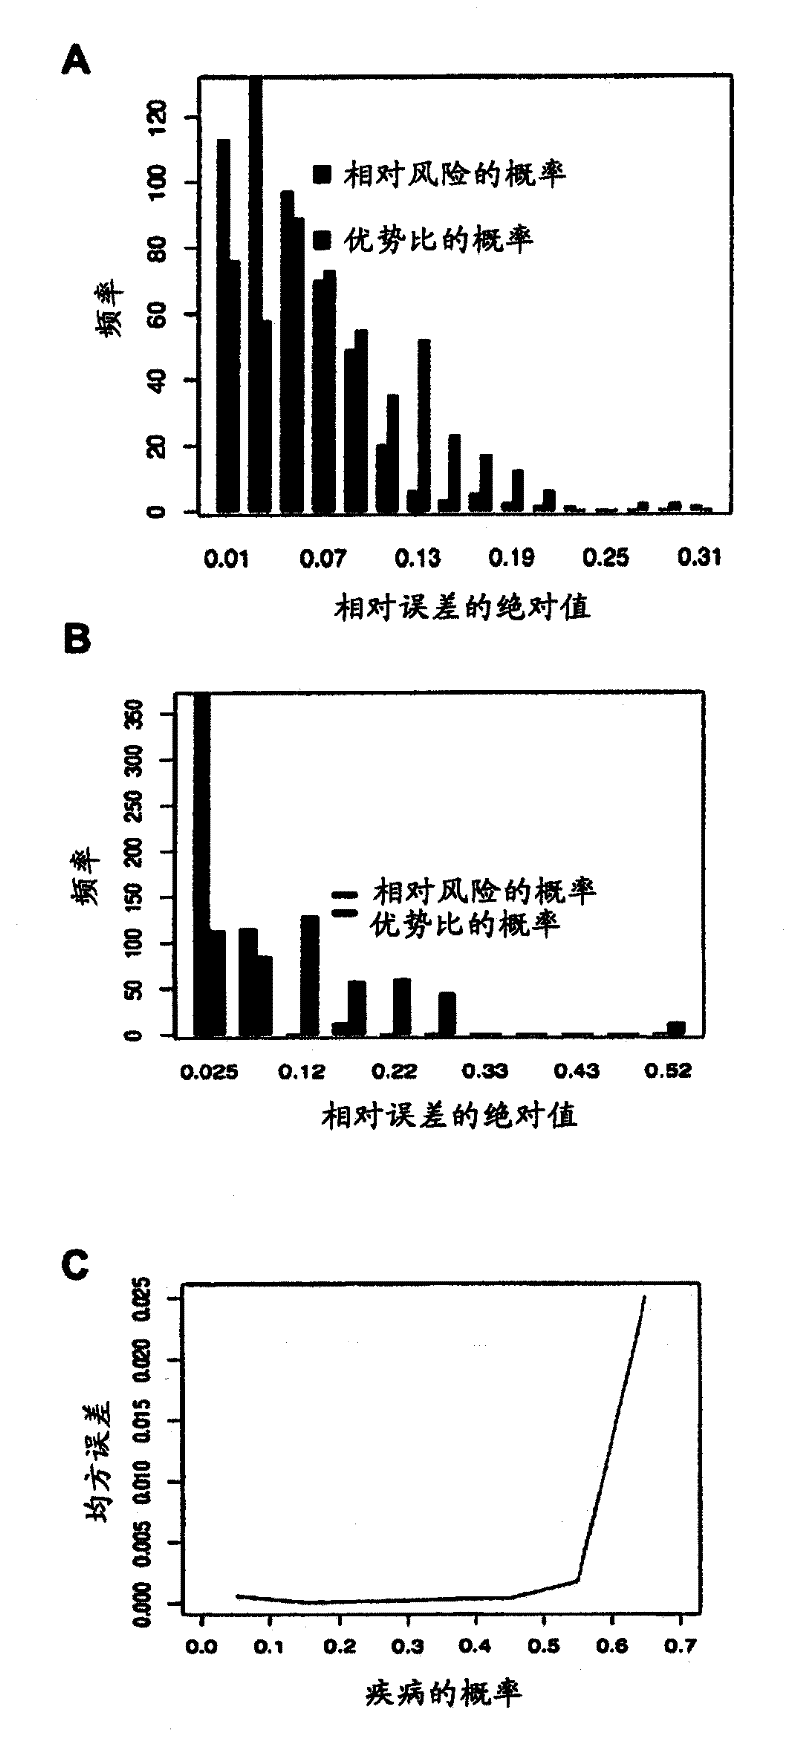
[0359] Example 3: Measuring absolute error in risk estimates
[0360] The ROC curve is used as a measure for evaluating diagnosis because it provides a quantitative measure of the test's ability to distinguish between healthy and sick individuals. However, when estimating lifetime risk, the ROC curve may not be an ideal measure if the correct probability estimate is not used. In particular, for any given pair of scoring functions f1(G) and f2(G), the ROC curves of the functions are consistent as long as f1 is a monotonically increasing function of f2. For example, we could simply assign f2(G)=log(f1(G)), and in this case by using the f1 and f2 scores to assess risk, we will obtain exactly the same ROC curve. However, these two functions may yield very different probabilistic risk estimates for individuals. Therefore, a ROC curve is not necessarily a good measure for a test reporting probabilistic risk. For probabilistic risk assessment, a more informative test is the mean...
PUM
 Abstract
Description
Claims
Application Information