Traffic sign detection method based on classification template matching
A traffic sign, template matching technology, applied in character and pattern recognition, instruments, computer parts and other directions, can solve the problems of high light and image quality requirements, complex operation process, poor real-time performance, etc., to achieve high real-time performance and accuracy , reduce interference information, good real-time effect
- Summary
- Abstract
- Description
- Claims
- Application Information
AI Technical Summary
Problems solved by technology
Method used
Image


Examples
Embodiment Construction
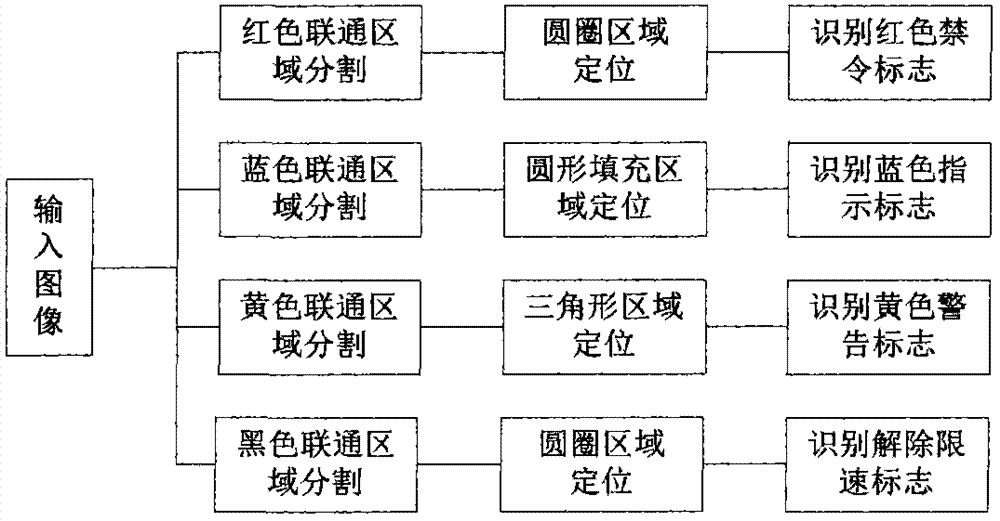
[0039] A kind of traffic sign detection method based on classification template matching provided by the present invention is introduced below in conjunction with accompanying drawing and embodiment:
[0040] Such as figure 1 As shown, a traffic sign detection method based on classification template matching includes the following steps:
[0041] (1) Segment different color regions of the region of interest, and classify traffic signs by color.
[0042] Since the captured image usually contains not only traffic signs but also road scenery and other information, effective and recognizable traffic signs always appear in a certain area of the captured image, so the region of interest is set for the image; and commonly used signs can be pressed The colors are divided into red prohibition signs, blue indication signs, yellow warning signs and black signs (such as lifting speed limit signs), etc., and the first step can be classified by color in turn.
[0043] When performing co...
PUM
 Abstract
Description
Claims
Application Information
PatSnap Eureka turns technology decisions into work you can execute. Powered by our Innovation Knowledge Graph, it runs expert workflows across engineering, life sciences, materials and intellectual property. Get your review-ready output in minutes.


