Refrigerator van temperature field actually-measured data visualization processing method and system

A technology of measured data and processing methods, applied in the direction of electrical digital data processing, special data processing applications, instruments, etc., can solve problems such as waste of energy, low efficiency of logistics storage and transportation of agricultural product refrigerated vehicles, and changes in temperature field, and achieve clear storage logic , Conducive to file building and access, to achieve the effect of data visualization

Inactive Publication Date: 2014-05-14
中商商业发展规划院有限公司
View PDF3 Cites 12 Cited by
  • Summary
  • Abstract
  • Description
  • Claims
  • Application Information

AI Technical Summary

Problems solved by technology

Therefore, researchers have tried various modeling processes for refrigerated cars, and even used complex 3D modeling software to simulate the temperature field in refrigerated cars. Under the conditions of various stacking methods, such as the four most common methods of "pin type", "well shape", "123321" type, and "basket mouth paired" type, the temperature field in the compartment changes significantly. Yes, even if the sensor

Method used


Image

  • Refrigerator van temperature field actually-measured data visualization processing method and system

Examples


Embodiment 1

[0021] A visual processing method for the measured data of the temperature field of a refrigerated vehicle is a technique involving the processing, visual display and query of the measured data of the temperature field of the refrigerated vehicle. The temperature parameters of the layout points are used to obtain the temperature contour graphic set of each layer of goods according to the obtained temperature parameters, and finally the palletizing plan for the next package of goods is determined according to the temperature contour graphic set of each layer of goods. The method includes The steps are as follows:

[0022] Step 1: Set up different multi-layer palletizing methods in the refrigerated compartment and palletize goods for packaging;

[0023] Step 2: Determine the coordinate system of the refrigerated compartment: establish a coordinate system with the inner bottom corner of the compartment as the origin of the coordinate, and set the coordinate value of the compartment to...

Embodiment 2

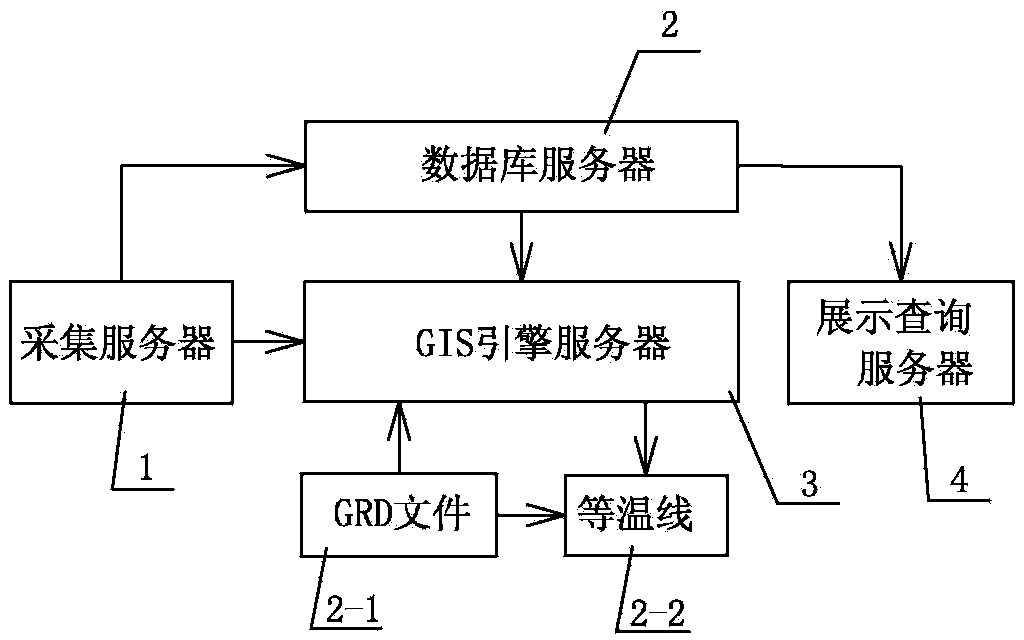
[0061] A visual processing system for the measured data of the temperature field of the refrigerated compartment that implements the method described in embodiment 1, see figure 1 The system is composed of a collection server 1, a database server 2, a GIS engine 3 server, and a display query server 4.

[0062] The collection server is used to collect temperature parameters of multiple layout points on each layer of various cargo packages in different multi-layer palletizing modes;

[0063] The GIS engine server is used to obtain a collection of temperature contour graphs of each layer of goods according to the obtained temperature parameters;

[0064] The database server is used to store a collection of temperature contour graphs of each layer of goods;

[0065] The display query server is used to determine the palletizing plan of the next package of goods according to the set of temperature contour graphs of each layer of goods.

[0066] Among them, the database server is provided with...


PUM

PropertyMeasurementUnit
Lengthaaaaaaaaaa
Lengthaaaaaaaaaa
Heightaaaaaaaaaa

Abstract

The invention discloses a refrigerator van temperature field actually-measured data visualization processing method and system. The method comprises the steps of firstly, collecting temperature parameters of each layer of layout of various kinds of cargo packaging in different multi-layer stacking modes, obtaining a temperature contour line graphic set of each layer of cargos according to the obtained temperature parameters, and finally, determining the stacking scheme of the next cargo packaging according to the temperature contour line graphic set of each layer of cargos. According to the refrigerator van temperature field actually-measured data visualization processing method and system, the map counter line method is utilized for drawing counter lines, the situation of temperature field changes caused by different stacking modes can be seen clearly, and the data visualization can be achieved; the cargos are stacked in a layering mode no matter what method is adopted, the three-dimensional problem is converted into a two-dimensional problem, and the three-dimensional characteristics are not lost. Due to the fact that the discrete data meshing and the interpolation algorithm are adopted, the estimated temperature value of a non-sampling area can be obtained and basically conform to the practical situation. Actually-measured data are stored by the adoption of the layering thought, the logic stored in a database is more clear, and historical data are conveniently filed, retrieved and used.

Description

technical field [0001] The present invention relates to the data processing of the measured data of the temperature field of the refrigerated car, and in particular to a method and system for visualizing the measured data of the temperature field of the refrigerated car. Height temperature distribution images, so as to obtain scientific advice on the layer height and stacking method of different types of goods. Background technique [0002] Existing refrigerated vehicles generally have a single air outlet. Even for refrigerated vehicles with multiple air outlets, the temperature of each part of the compartment is different, and even when fully loaded with goods, there will be a large temperature difference. Due to the fact that agricultural products often need to be mixed with multiple fresh varieties during the logistics loading process, different varieties have different optimal storage and transportation temperatures. Therefore, researchers have tried various modeling pr...

Claims


Application Information

Patent Timeline
IPC IPC(8): G06F17/50G06F17/30
Inventor 罗杰含王勇段月永张钉钉李亚琼
Owner 中商商业发展规划院有限公司
Why Eureka
Try Eureka